The Nifty 50 index opened with a gap down on Wednesday and remained largely range bound during the first half of the trading session. However, selling pressure intensified sharply in the second half after geopolitical tensions between the US and Iran escalated. Market sentiment weakened after US President Donald Trump stated that the ceasefire with Iran was “over”.
This triggered a spike in crude oil prices and added pressure on Indian equities. Volatility also surged, with India VIX jumping nearly 26% in a single session. By the close, the Nifty declined 516.65 points, or 2.12%, marking its sharpest single day fall in three months. Market breadth remained extremely weak, reflecting broad based selling across sectors.
Sharp Fall Damages Short Term Structure
Also Read | Layoffs Are Rising In Tech, But These Skills Are Helping People Unlock Better Pay
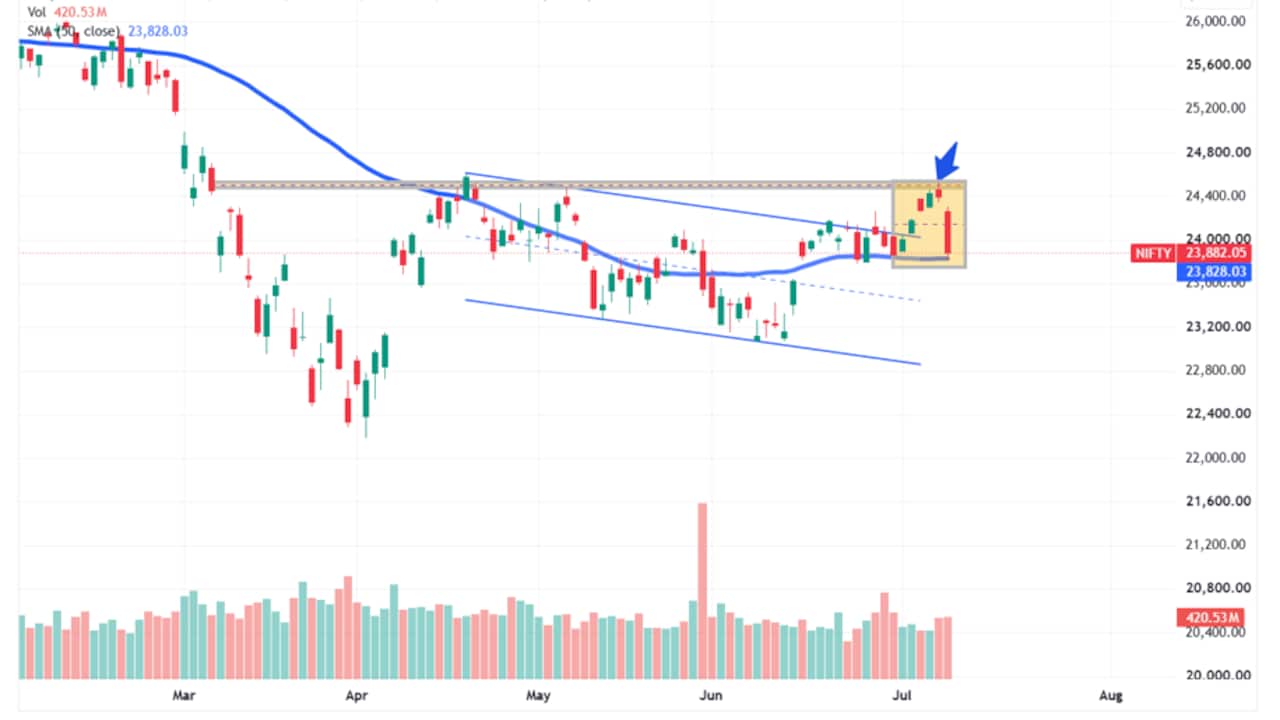
The intense sell-off led to the formation of a sizeable bearish candle after a gap down opening. The decline was sharp enough to wipe out the gains made during the first five trading sessions of the month in just one session, indicating faster downside retracement.
The index closed decisively below its 20-DMA and tested the 50-DMA after falling more than 500 points. All sectoral indices ended in the red, while the index also filled two gaps created in the previous week. On the weekly chart, the price action is currently pointing towards the formation of a bearish engulfing candle, although a couple of trading sessions are still left for the week to conclude.
Interestingly, the index has now slipped back into its earlier trading range, which makes the next few sessions crucial.
Key Support And Resistance Levels For Nifty On Thursday
Going ahead, immediate support is placed near 23,828, which coincides with the 50 DMA. This is followed by the four-week low of 23,784. A major support zone is placed near the June 15 gap area around 23,645.
Hence, the price behaviour in the 23,645 to 23,828 zone would be important to watch. A decisive break below 23,784 could invite fresh selling pressure and may drag the index towards 23,645.
On the upside, the index is likely to face resistance in the 24,000 to 24,200 zone. As long as the index trades below this band, it may remain difficult for bulls to regain momentum.
Momentum Indicators Turn Weak
With Wednesday's fall, the price structure has weakened and bears appear to have gained control in the short term. The 14 period daily RSI has slipped below the 50 mark, indicating loss of momentum.
The MACD (Moving Average Convergence/Divergence) is also close to generating a fresh bearish signal. On the hourly chart, the moving average ribbon has turned downward, while the MACD remains below the zero line, further confirming weakness.
Overall, the short term bias has turned cautious. The Nifty needs to defend the 23,645 to 23,828 support zone to avoid deeper downside. A sustained move above 24,200 would be required for bulls to regain confidence.
Also Read | Sharp Stock Market Crash: Nifty Falls Over 200 Points In 15 Minutes; 47 Of 50 Stocks In Red
Essential Business Intelligence, Sharp Market Insights, Practical Personal Finance Advice, Daily Fuel, Gold and Silver Prices and Latest Stories — On NDTV Profit.