The Nifty 50 reclaimed its 200-day exponential moving average (DEMA) for the first time since Feb. 27, marking an improvement in its technical setup after extending gains in Monday's session. The index rose past the 24,450 level during the day before settling at 24,430.35.
The advance was driven largely by HDFC Bank and Reliance Industries, which together contributed nearly 118 points to the Nifty's gain.
Technical Setup Turns Positive
The latest move has strengthened the index's near-term technical outlook. Monday's session formed a bullish candle with a higher high and a higher low, while the Nifty also closed above the previous session's high. A fall in open interest indicates the rally was driven largely by short covering. At the same time, the 20-day moving average crossed above the 50-day moving average, signalling a positive short-term trend.
Also Read | Layoffs Are Rising In Tech, But These Skills Are Helping People Unlock Better Pay
The index is now approaching a key resistance zone between 24,482 and 24,520. After gaining more than 600 points from its June 30 low to its July 6 high, the market could pause or consolidate before attempting another move higher.
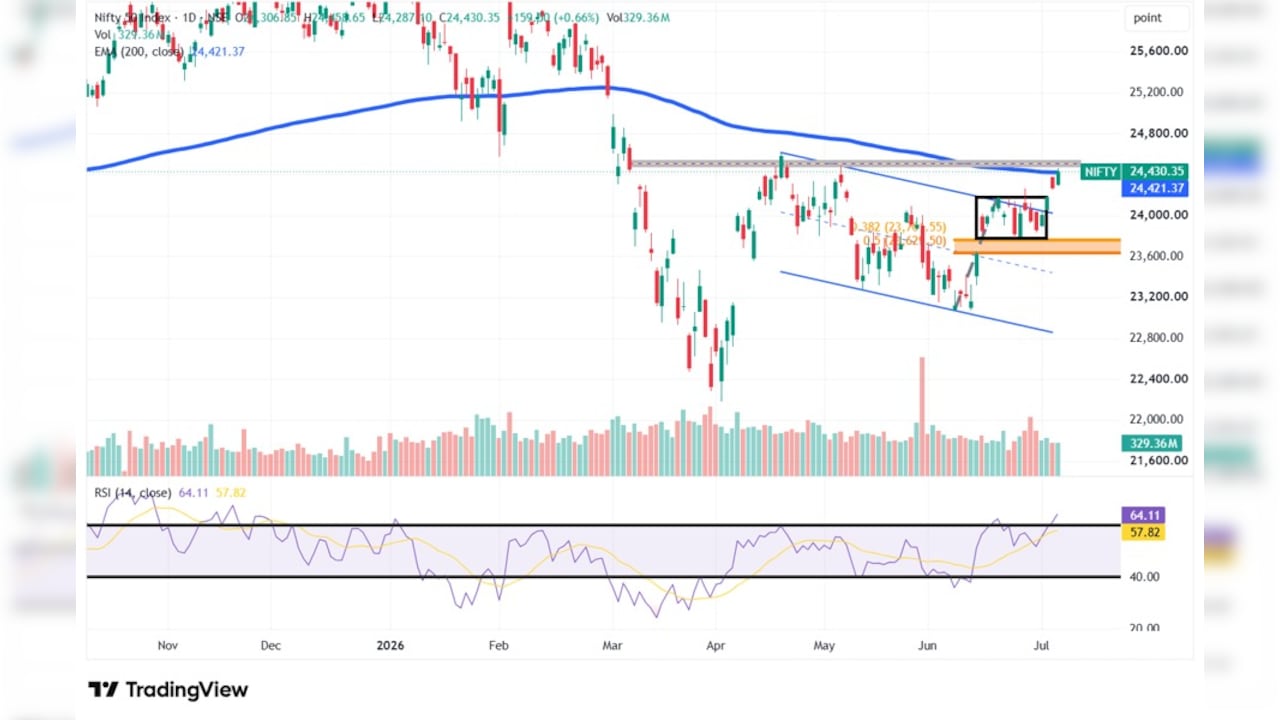
Another pattern also warrants attention. The Nifty has generally managed no more than four or five consecutive positive sessions in 2026. Monday's close marked its fourth straight day of gains, raising the possibility of consolidation near current levels.
Key Levels To Watch
Immediate support is seen around 24,300. Below that, the July 3 opening gap between 24,195 and 24,252 will be an important support zone. The broader technical view remains positive as long as the index holds above this range.
Momentum indicators also continue to favour the bulls. The 14-day Relative Strength Index (RSI) has climbed to its highest level of 2026, while the Moving Average Convergence Divergence (MACD) indicator continues to strengthen. Even so, the approach towards a major resistance area and the recent pattern of four to five advancing sessions suggest that some consolidation cannot be ruled out.
Gabriel India Remains On Watch
Gabriel India has gained more than 30% from its June 9 low to its June 29 high before moving into a consolidation phase. The stock approached a possible breakout from that range on Monday, supported by higher trading volumes.
The stock needs to remain above the Rs 1,285-Rs 1,290 zone for the momentum to continue. It is trading above its key moving averages, while the 14-day RSI has entered what the report describes as a "super bullish" zone. The Average Directional Index (ADX) stands at 34 and the positive Directional Movement Index (+DMI) has resumed its uptrend after finding support near the 25 level.
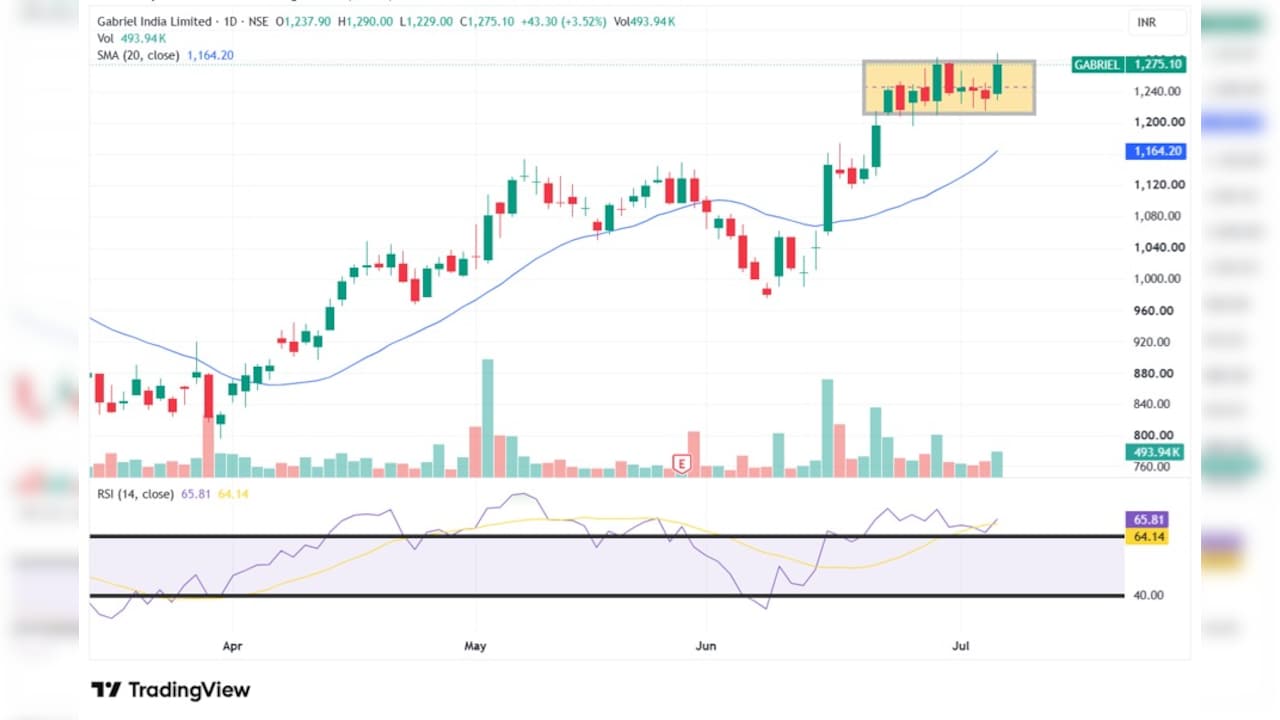
According to the report, Gabriel India could test the Rs 1,350-Rs 1,380 range if it sustains above Rs 1,285-Rs 1,290, with a stop loss at Rs 1,212.
Essential Business Intelligence, Sharp Market Insights, Practical Personal Finance Advice, Daily Fuel, Gold and Silver Prices and Latest Stories — On NDTV Profit.