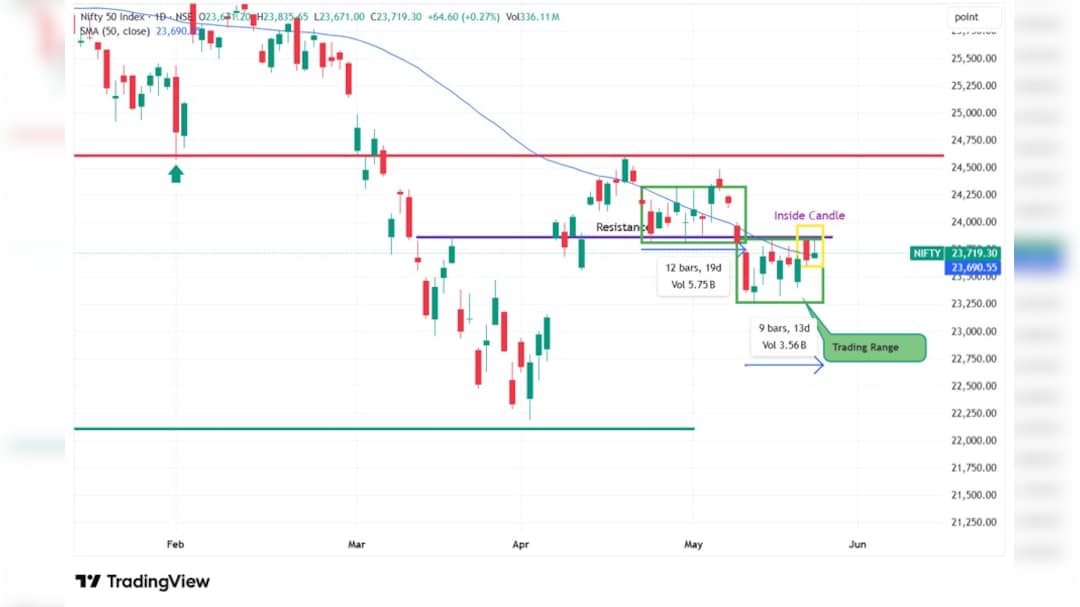
The Nifty50 ended higher on Friday but once again failed to cross the 23,830-23,860 resistance zone, signalling continued hesitation at higher levels. The index erased more than 100 points from the day's high before settling above 23,700, up 64.60 points, or 0.27%. Banking and financial stocks supported the market through the session.
The latest price action points to a market that remains in consolidation mode, with both daily and weekly charts showing inside candle formations. The narrowing trading range suggests momentum has slowed and traders are awaiting a decisive trigger. A sustained move above 23,860 could open the way for a rally towards 24,000 and 24,130, while support remains at 23,450.
Resistance Holds Firm
Friday's session formed a small-bodied candle with a long upper shadow on the daily chart, indicating selling pressure near the resistance band of 23,830-23,860. The index also traded within the previous session's range, creating an inside candle pattern. The 165-point trading range was the narrowest seen in the last 10 sessions.
Also Read | Layoffs Are Rising In Tech, But These Skills Are Helping People Unlock Better Pay
The same pattern appeared on the weekly chart, where the entire week's movement remained within the previous week's range. Such price behaviour often reflects indecision before a larger directional move.
Consolidation Phase Deepens
The current consolidation phase has now extended to around nine sessions. In the earlier phase between April 23 and May 11, the market remained range-bound for 12 sessions before breaking out. The ongoing setup suggests the index may be approaching another decisive phase.
On lower time frames, the Nifty continues to form higher lows while facing resistance near similar highs, creating an ascending triangle pattern. Repeated rejection near 23,830-23,860 indicates the zone remains a supply area for the market.
A close above 23,860 may trigger short covering and strengthen the near-term structure, potentially lifting the index towards 24,000 and then 24,130. On the downside, 23,450 remains the immediate support level, followed by the May 13 low of 23,262.55. Until a breakout occurs, the market may continue to move within a broad range with intermittent volatility.
Stock To Watch
Mahindra Lifespace Developers has broken out of a triangular pattern that had been forming for nearly six weeks. The stock is also nearing a neckline breakout from a double-bottom pattern, placing the Rs 348-349 zone in focus. A sustained move above this level could strengthen the setup further.
The stock has moved back above its 20-day and 50-day moving averages, indicating improved price strength. The MACD histogram also points to a gradual rise in momentum. On the weekly chart, the stock formed a large bullish candle resembling a bullish engulfing pattern, adding support to the current structure.
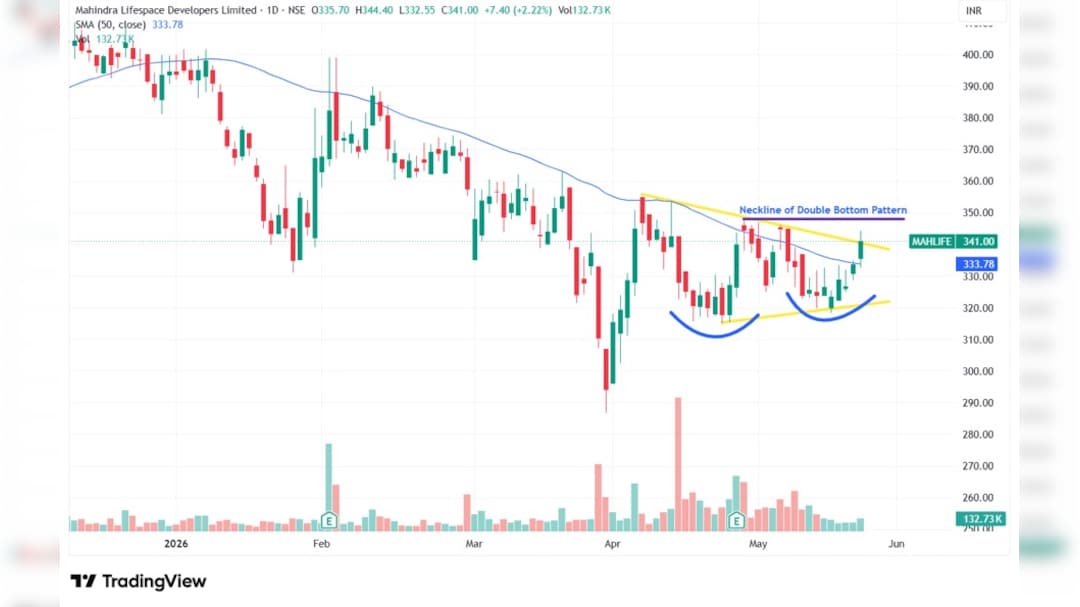
If the breakout sustains above Rs 348-349, the stock may move towards Rs 375-384. A stop loss may be maintained at Rs 325.
Disclaimer: The views expressed in this article are solely those of the author and do not necessarily reflect the opinion of NDTV Profit or its affiliates. Readers are advised to conduct their own research or consult a qualified professional before making any investment or business decisions. NDTV Profit does not guarantee the accuracy, completeness, or reliability of the information presented in this article.
Essential Business Intelligence, Sharp Market Insights, Practical Personal Finance Advice, Daily Fuel, Gold and Silver Prices and Latest Stories — On NDTV Profit.