The Nifty 50 began Monday, October 12, 2026, on a positive note, opening above Friday's high and subsequently surpassing the high of October 8, a session that had witnessed an open=high formation.
The index extended its early gains in early deal to touch an intraday high of 22,651.10. However, the recovery was short-lived, as selling pressure emerged at higher levels. From the day's peak, Nifty surrendered nearly 288 points to close near its session low at 22,363.35, declining 157.10 points or 0.70%.
Daily Chart Indicates Failed Recovery Attempt
On the daily chart, the index formed a sizeable bearish candle, reflecting the inability of buyers to sustain the early momentum. The last two candles resemble a Dark Cloud Cover formation, although the prevailing downtrend makes it more relevant as a failed recovery attempt than a conventional bearish reversal pattern.
Monday's decline has weakened the possibility of counter-trend rally. The formation of lower highs and lower lows on the lower timeframes further indicates that sellers continue to dominate short-term price action.
Also Read | Layoffs Are Rising In Tech, But These Skills Are Helping People Unlock Better Pay
India VIX Closed Near Its 4-Month High
Market breadth remained heavily tilted towards the bears, with only 14 Nifty 50 constituents ending the session in positive territory. The weakness was accompanied by a rise of over 6% in India VIX, which closed near its four-month high, indicating heightened uncertainty among market participants.
The rise in volatility was also reflected in the options market, where Nifty's Implied Volatility (IV) Percentile climbed to 77.8. This indicates that current implied volatility is higher than nearly 78% of historical observations over the selected lookback period.
The simultaneous decline in Nifty and rise in volatility measures suggest that traders are pricing in greater near-term price fluctuations. With the weekly derivatives expiry scheduled for October 13, sharp intraday swings cannot be ruled out.
India VIX and Nifty's Inverse Relationship: Is a Market Bottom Nearby?
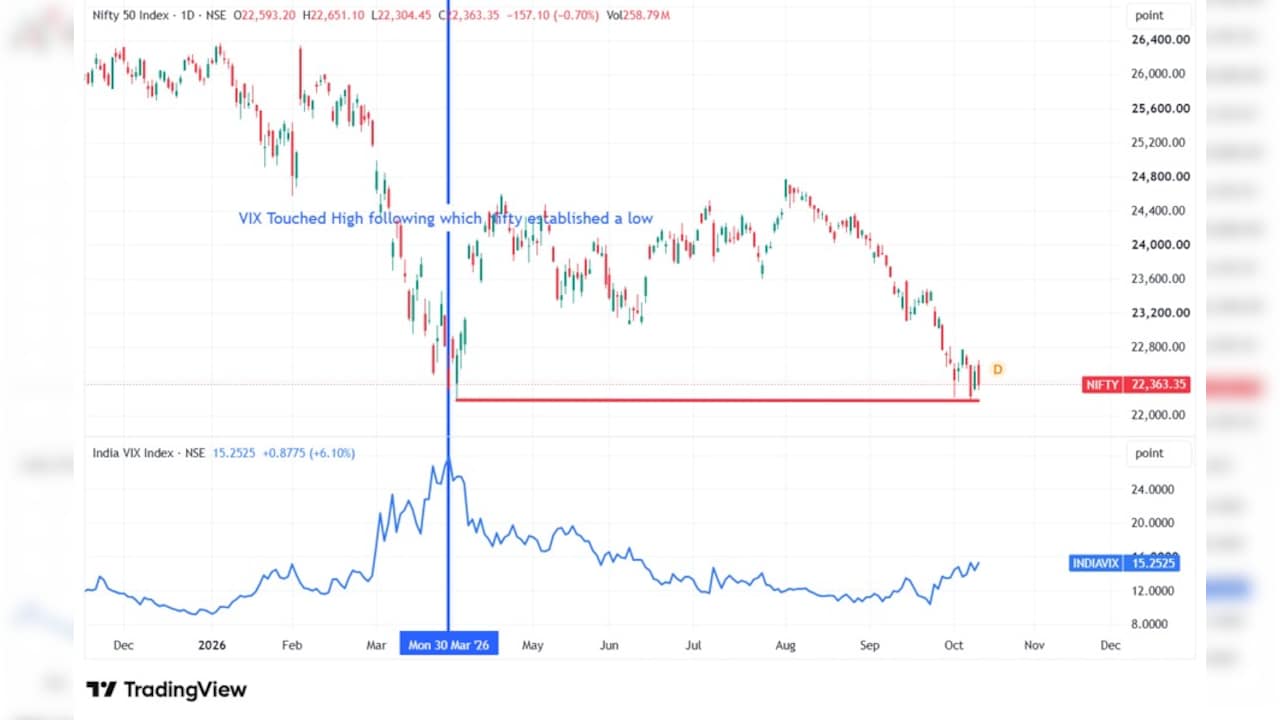
Interestingly, India VIX closed near a four-month high. Historically, sharp spikes in India VIX have occasionally preceded important market bottoms, as heightened fear and uncertainty may indicate selling pressure is nearing exhaustion. However, elevated volatility alone does not confirm a sustainable market bottom.
Just to provide you a context, during the final week of March, India VIX climbed to 28.90, following which Nifty established a significant low near 22,182 a few days later. Interestingly, the index has once again approached a similar price zone, with the October 8 low recorded at 22,179.90.
This makes the 22,180 area particularly relevant from a technical perspective. A decisive break below this support would weaken the case for a recovery and could extend the prevailing downtrend.
Momentum indicators also remain unfavourable. The daily Relative Strength Index (RSI) has stayed in below the level of 40 since early September, while the recent positive divergence has failed to produce a sustained recovery.
Key Levels to Watch on Weekly Expiry: 22,180 Support and 22,651 Resistance
For the immediate outlook to improve, Nifty must first demonstrate an ability to sustain gains and close above the previous session's high. Until then, short-term recoveries may continue to attract selling pressure.
On the upside, 22,651, Monday's intraday high, is the immediate resistance. A sustained close above this level would indicate an improvement in short-term sentiment and could allow the index to extend its recovery towards the 22,800-23,070 zone.
On the downside, 22,280-22,290 remains the immediate support area. Failure to defend this zone could expose the index to another test of 22,179.90, the low recorded on October 8. A decisive daily close below this level would confirm renewed weakness and further reduce the possibility of a near-term reversal.
Stock to Watch: Solar Industries India
Solar Industries India has developed an ascending triangle-like base and moved back above the 38.2% Fibonacci retracement level of prior down move, indicating an improvement in its technical structure. The latest session witnessed higher trading volume compared with the previous day, suggesting increased market participation. Meanwhile, the Mansfield Relative Strength indicator reflects the stock's outperformance relative to the broader market.
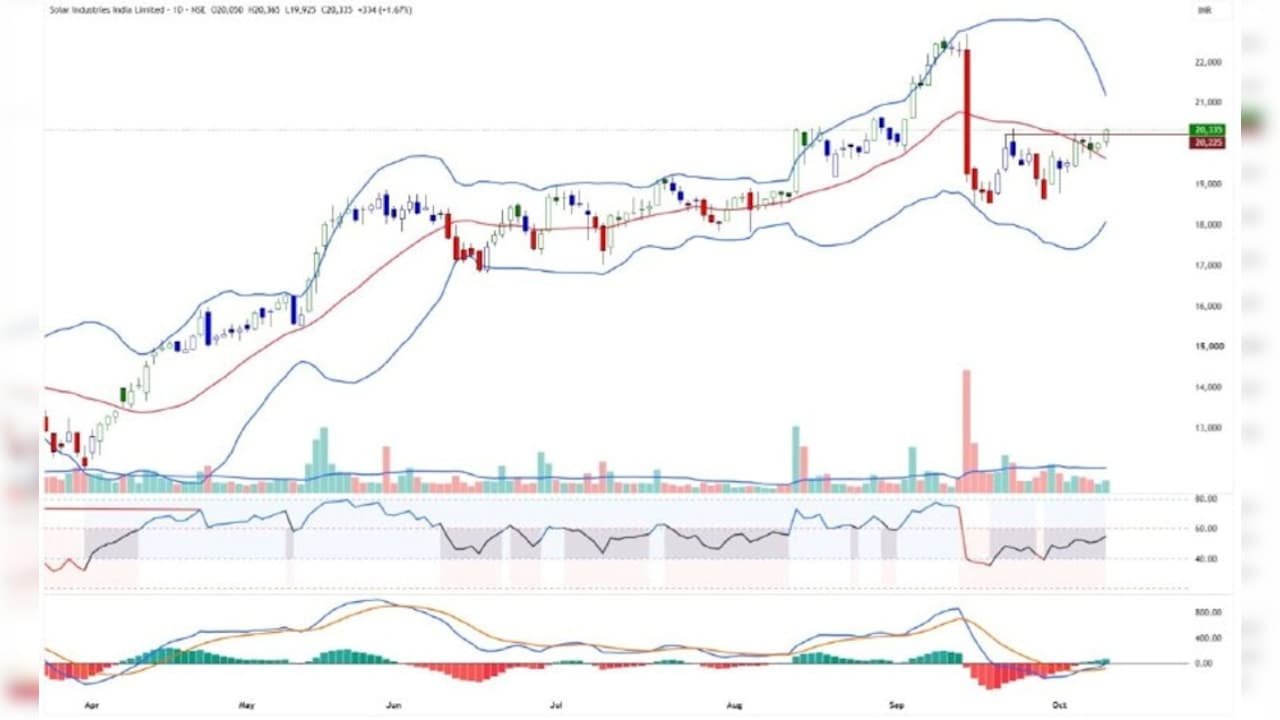
It has also closed above the moving average ribbon, reinforcing the positive price structure.
Overall, the technical setup suggests that Solar Industries India is approaching a potential breakout. A sustained move above Rs 20,400 could pave the way for an upward move towards Rs 21,000, followed by 21,350 while a stop-loss may be maintained at Rs 19,850 to manage downside risk.
Essential Business Intelligence, Sharp Market Insights, Practical Personal Finance Advice, Daily Fuel, Gold and Silver Prices, Watch Business News Live and Latest Stories — On NDTV Profit.