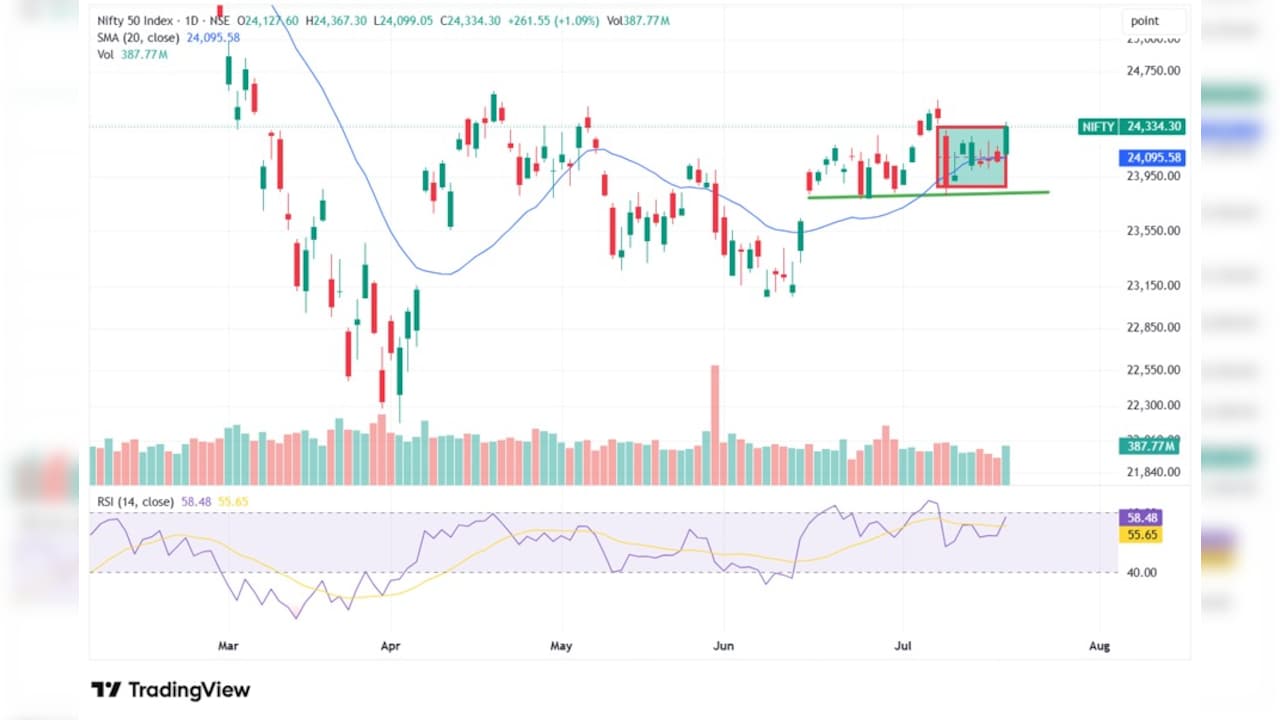
The Nifty 50 ended above its July 8 high, breaking out of its recent trading range and filling the downside gap created during that session. Higher trading volumes accompanied the move, suggesting renewed buying interest ahead of a week that could be shaped by the market's response to quarterly earnings from major banks.
The index now approaches a key resistance zone near the July 7 swing high of 24,531. A sustained move above that level could pave the way for a test of 24,602, while immediate support is seen at 24,250. A break below that level could drag the index towards the 24,000 mark.
Technical indicators point to improving momentum
Friday's rally came with the strongest trading volumes in the past six sessions, indicating that buying activity strengthened rather than being driven by a low-volume rebound. On the weekly chart, the Nifty formed a bullish candle but remained within the previous week's range, resulting in an inside candle. The broader trading band of 23,785 to 24,531 therefore remains intact.
The 10-week moving average has provided support for the past five weeks and continues to trend higher, pointing to an improving short-term trend. However, the 20-week moving average continues to slope lower, indicating that the medium-term trend has yet to turn positive. The index is also trading 2.11% above its 50-day moving average, although that average remains flat.
Bollinger Bands, which had narrowed during the recent consolidation, are beginning to expand. That typically signals higher volatility and the potential for a stronger directional move.
Momentum indicators have also improved. The weekly Relative Strength Index stands at 51.55 and is moving higher, while the 14-period daily RSI has moved above its previous minor high and is approaching 60. A sustained move above that level would strengthen the current momentum.
The weekly MACD histogram continues to improve and the daily MACD is close to generating a bullish crossover. The positive directional indicator has also crossed above the negative directional indicator. However, the Average Directional Index continues to decline, suggesting the current trend still lacks strength and may require a decisive breakout above resistance.
Bank earnings remain the next trigger
The market's response to quarterly earnings from major banks will be the next key test for the rally. Banking stocks advanced sharply on Friday, and investors will be watching whether the results support further gains or lead to profit-taking.
The report said traders should monitor the first hour of trading. A sustained move above the first-hour high would indicate continued buying interest and could support a further advance in the benchmark index.
Stock in focus: Five-Star Business Finance
Five-Star Business Finance broke above a five-month horizontal consolidation pattern in early July on strong trading volumes. Since then, the stock has traded in a narrow range while volumes have eased, a pattern that suggests consolidation above the breakout level.
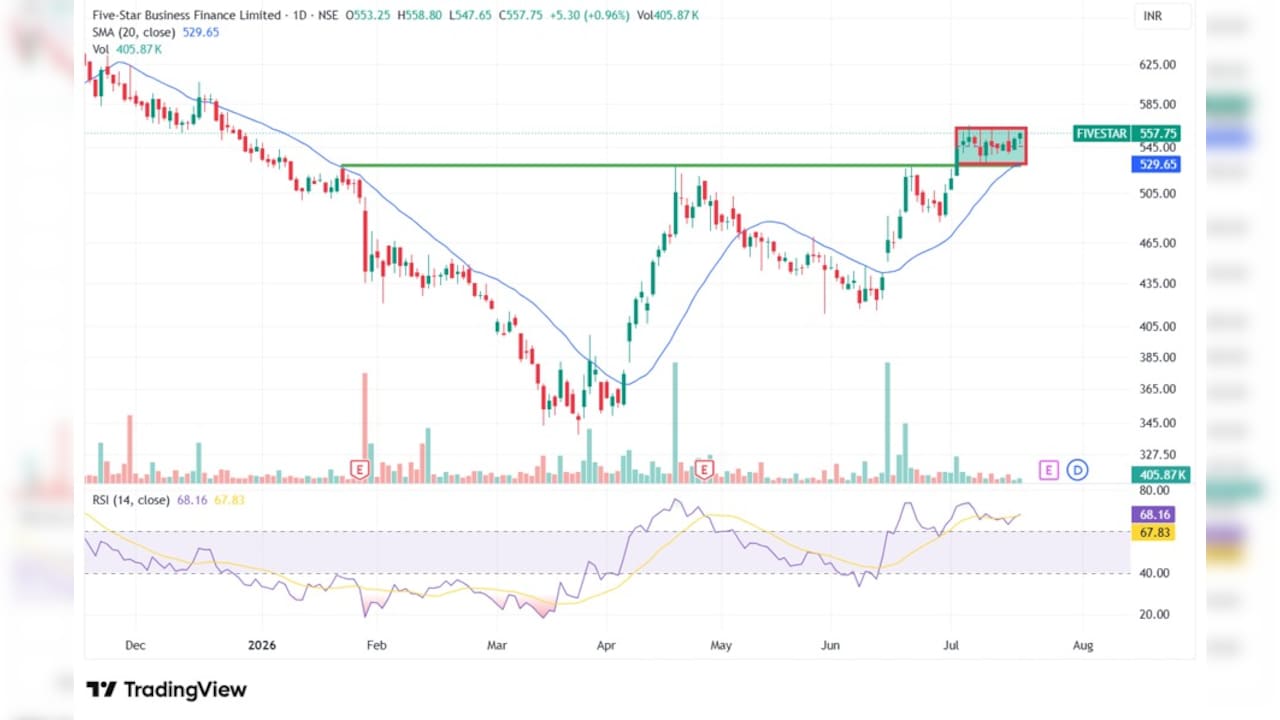
The stock is trading above its 20-day, 50-day, 100-day and 200-day moving averages. The 14-period daily RSI has shifted into a stronger range, while the Average Directional Index remains above 36. The positive directional indicator also remains above the negative directional indicator, signalling continued buying momentum.
According to the report, the outlook remains positive if the stock holds above the Rs 560-Rs 562 range. It could then move towards Rs 594, followed by Rs 630. A stop-loss is placed at Rs 526.
Essential Business Intelligence, Sharp Market Insights, Practical Personal Finance Advice, Daily Fuel, Gold and Silver Prices and Latest Stories — On NDTV Profit.