The Nifty 50 broke a 12-session sequence of lower highs on Thursday, offering some relief to bulls after the index opened higher but struggled to sustain its gains. The index moved within a narrow range of about 81 points before closing at 24,231.85, almost unchanged from its opening level. The move has improved the near-term technical setup, but the index still needs to clear key resistance levels for the recovery to gain strength.
The Nifty opened above its 50-day moving average and moved towards its eight-day exponential moving average, or 8-EMA, but failed to build enough momentum to extend the gains. The index continued to hold an important support zone formed by the rising trendline and the 61.8% retracement level of its recent upswing.
Lower Highs
The break in the 12-session lower-high sequence marks a change in the recent price pattern. However, Thursday's session ended with the index close to its opening level, forming a Doji-like candlestick. The pattern points to indecision, with neither buyers nor sellers establishing clear control.
Also Read | Layoffs Are Rising In Tech, But These Skills Are Helping People Unlock Better Pay
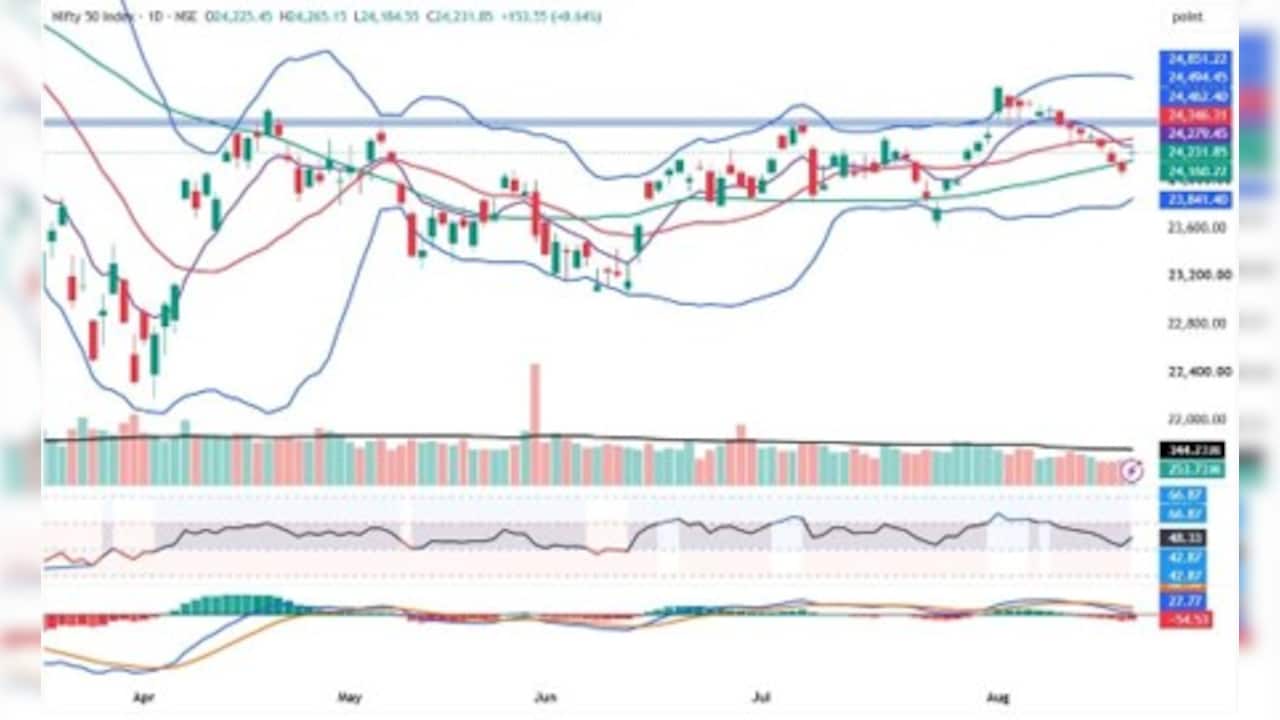
Momentum indicators have also improved. The 14-period daily Relative Strength Index, or RSI, rebounded from around the 40 level, while the Moving Average Convergence Divergence, or MACD, histogram showed that bearish momentum was gradually easing. Further price confirmation is needed before the move can be treated as a reversal.
Key Resistance
For bulls, Thursday's high of 24,265 is the first hurdle, followed by the 8-EMA at 24,279. A sustained move above the 24,265-24,280 zone could strengthen the recovery and take the index towards 24,346, where the 20-day moving average is currently placed.
On the downside, the 50-day moving average at 24,160 is the immediate support level. A break below it would bring the 23,960-24,040 zone into focus. A decisive move below this band could increase selling pressure and expose the Nifty to a deeper correction towards 23,700.
Weekly Close
Thursday's Doji-like formation makes the weekly close important. A similar long-legged Doji formed last Friday but did not lead to a reversal. The current pattern therefore needs confirmation through follow-through buying.
A close above 24,265, and more importantly above the 8-EMA near 24,279, would improve the prospects of a near-term reversal. If the Nifty closes the week above 24,280, the next level to watch would be the 20-day moving average near 24,346.
Dixon Setup
Dixon Technologies has broken out of a five-week consolidation phase with a strong bullish candle, accompanied by a noticeable increase in trading volume. The rise in volume supports the breakout and indicates stronger buying interest.
The stock's Relative Strength line is also rising, suggesting that it is outperforming the broader market. Dixon continues to trade above its key short- and long-term moving averages.
The technical setup has strengthened further as its Bollinger Bands have begun to widen after a period of contraction. Its moving average ribbon also remains in an uptrend.
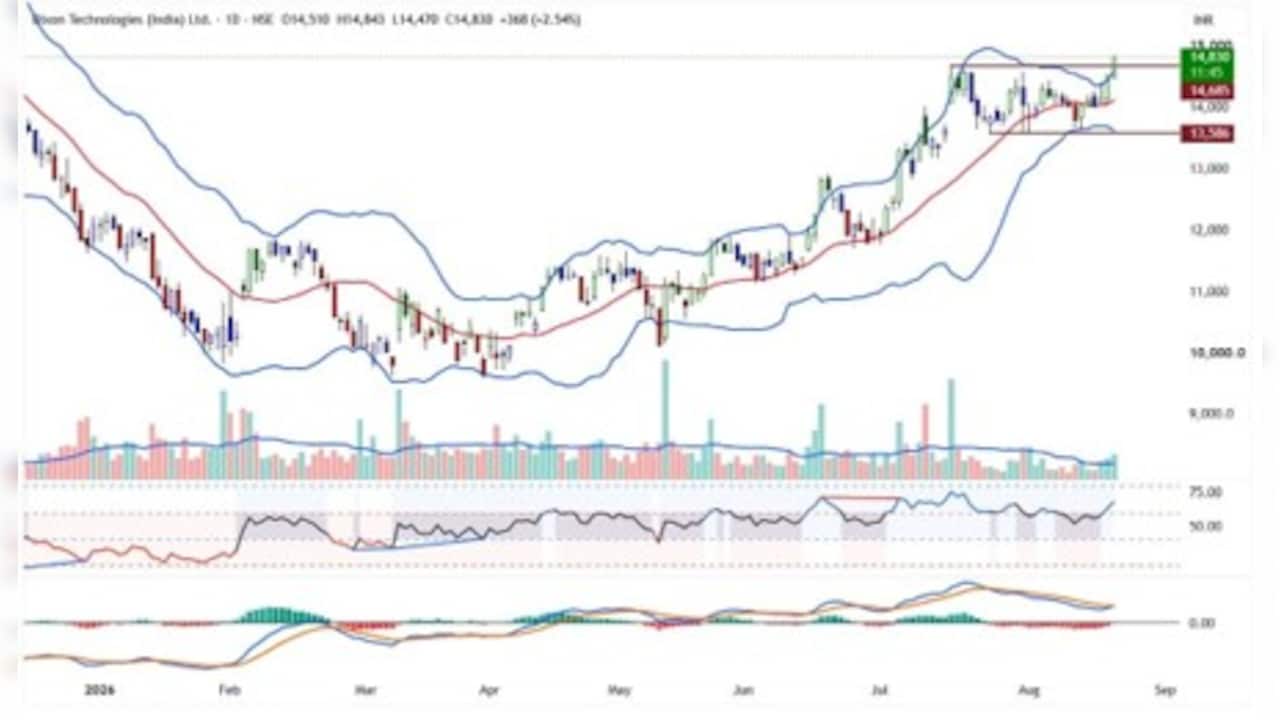
Momentum indicators are supportive. The daily MACD has generated a bullish crossover, while the 14-period RSI has moved into bullish territory. The Stochastic RSI and Elder Impulse System have also turned positive.
A sustained move above Rs 14,900 could open the way towards Rs 15,600. The stop loss can be maintained at Rs 14,400. If the stock decisively moves above Rs 15,600, the next potential upside level is near Rs 16,200.
Essential Business Intelligence, Sharp Market Insights, Practical Personal Finance Advice, Daily Fuel, Gold and Silver Prices and Latest Stories — On NDTV Profit.