Courtesy the face-off between China and the United States, India has a once-in-a-generation opportunity to become the factory of the world for knowledge-intensive light industrial manufacturing in sectors such as electronics, pharmaceuticals and specialty chemicals. However, India's competitiveness is hindered by an effective corporate tax rate that is 4%-points higher than America's or China's. This higher tax rate makes India uncompetitive in key export-oriented sectors and creates the need for expensive policy interventions like PLIs. For India to decisively capture the China+1 opportunity and transform the employment prospects of tens of millions of Indians, a corporate tax rate cut, rather than PLIs, is a necessary and a sufficient pre-condition for take-off.

Early Signs Of A Recovery In Corporate Capex…
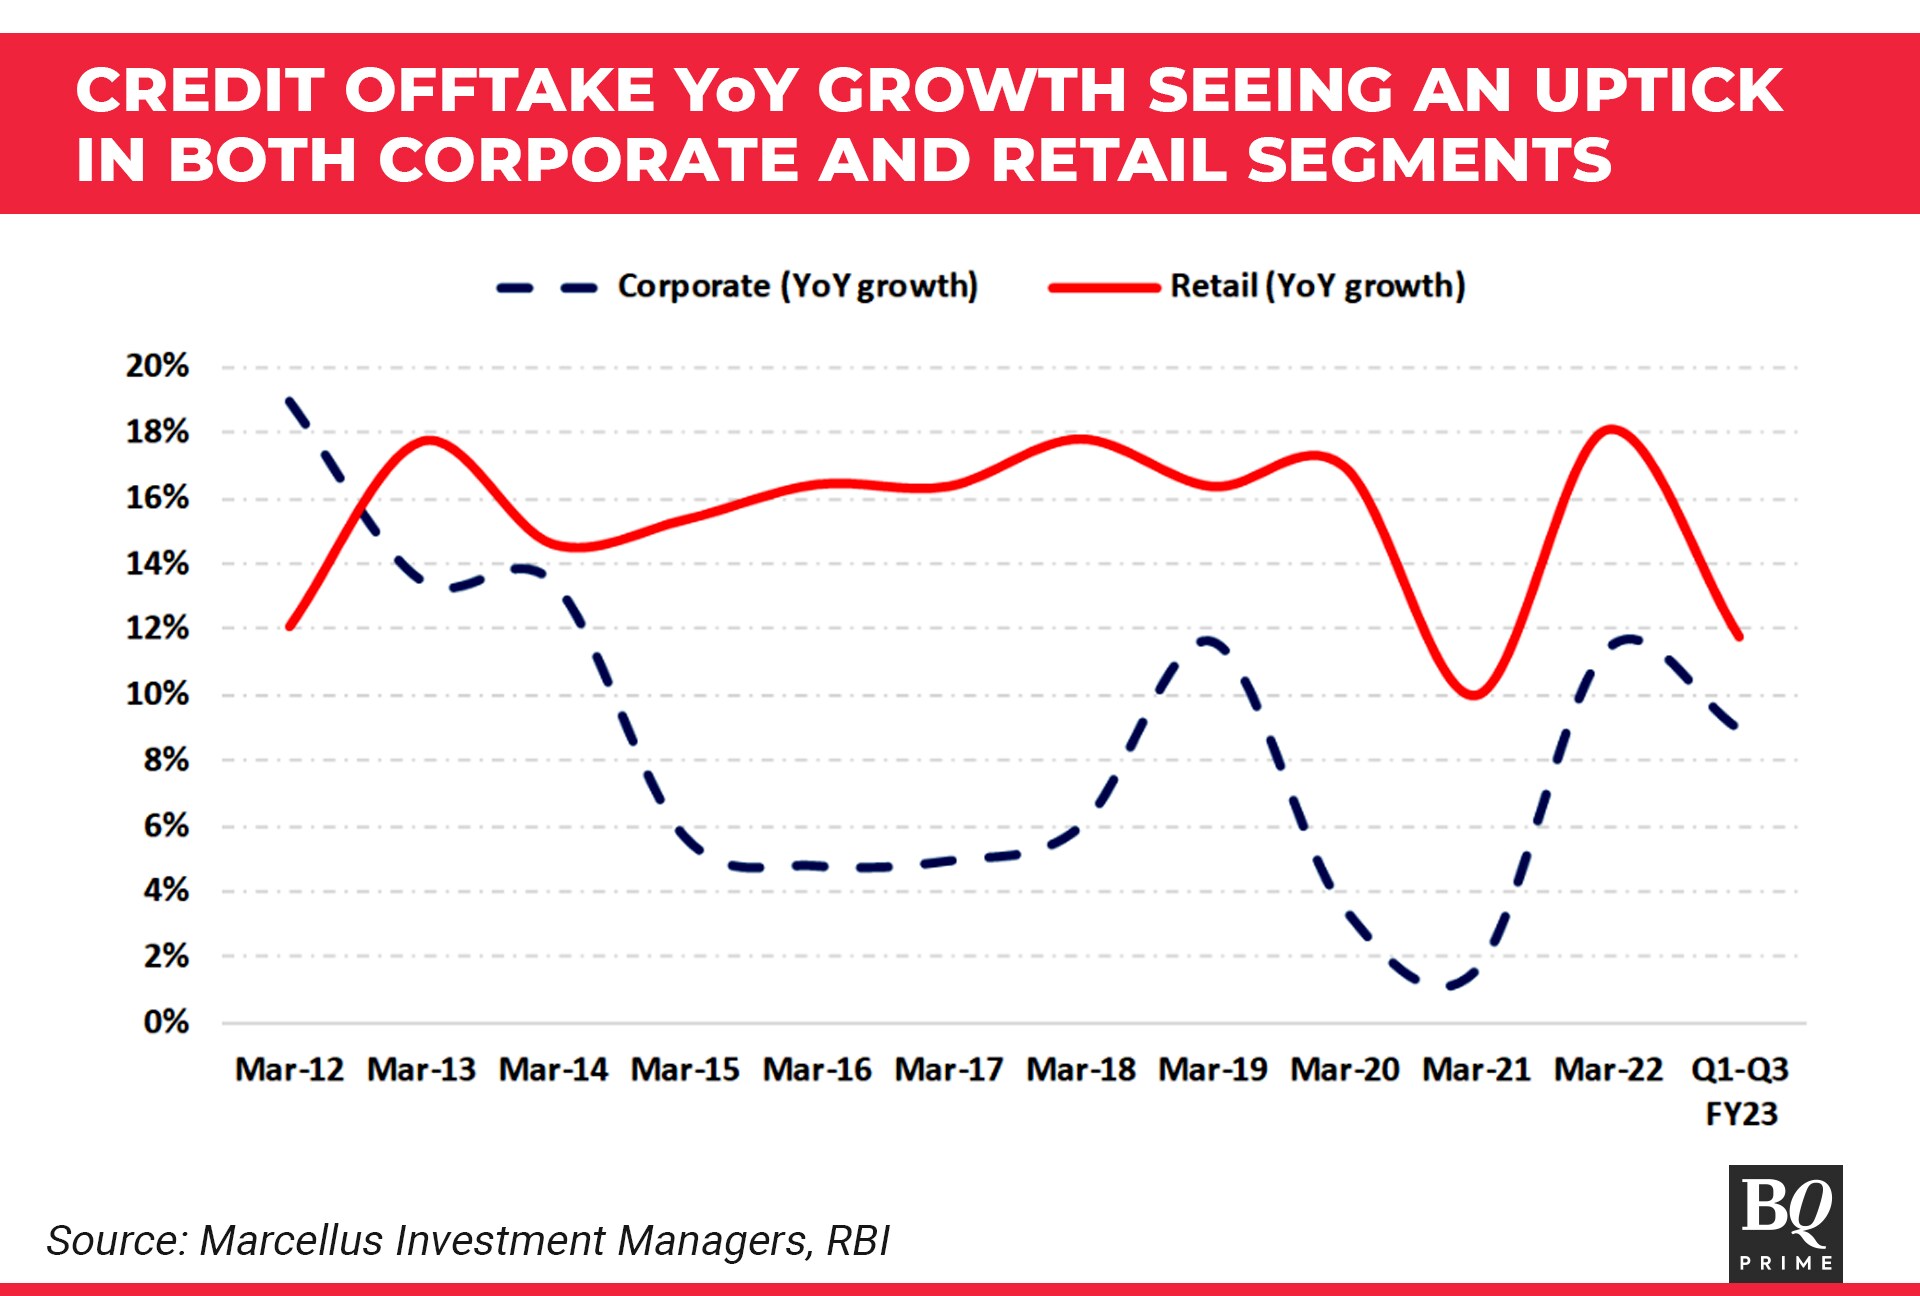
Corporate capital expenditure (or capex) in India has started to show some signs of recovering after nearly a decade of slowing down. This is evidenced by a slew of indicators, including but not limited to corporate credit offtake growth (see the dashed line in the chart below)—in FY22, this figure was in double digits after a gap of three years.
…Underscore A Puzzlingly Weak Capex Recovery
Given that India is still a low income country with a GDP per capita of $2,300 and given that it has been a decade since the previous capex cycle ended, India's post-Covid capex recovery isn't as strong as one would have expected it to be.
The modest nature of the capex recovery is even more puzzling given that a variety of indicators suggest that capacity utilisation in the economy is running at high levels—the RBI's latest indicator of capacity utilisation is 74.3%, inching above the 10-year average of 73%.
In a similar vein:
Power demand for the month of April 2023 (in MwH) was double what it was five years ago.
Cement production has grown 28% YOY, driven by strong demand from both the real estate sector and the civil construction sector.
The largest construction company in the country, L&T Ltd., reported an order book of Rs 3,865 billion at the end of Q3 FY23 (30% higher than the figure that it reported before Covid-19 in March 2020).
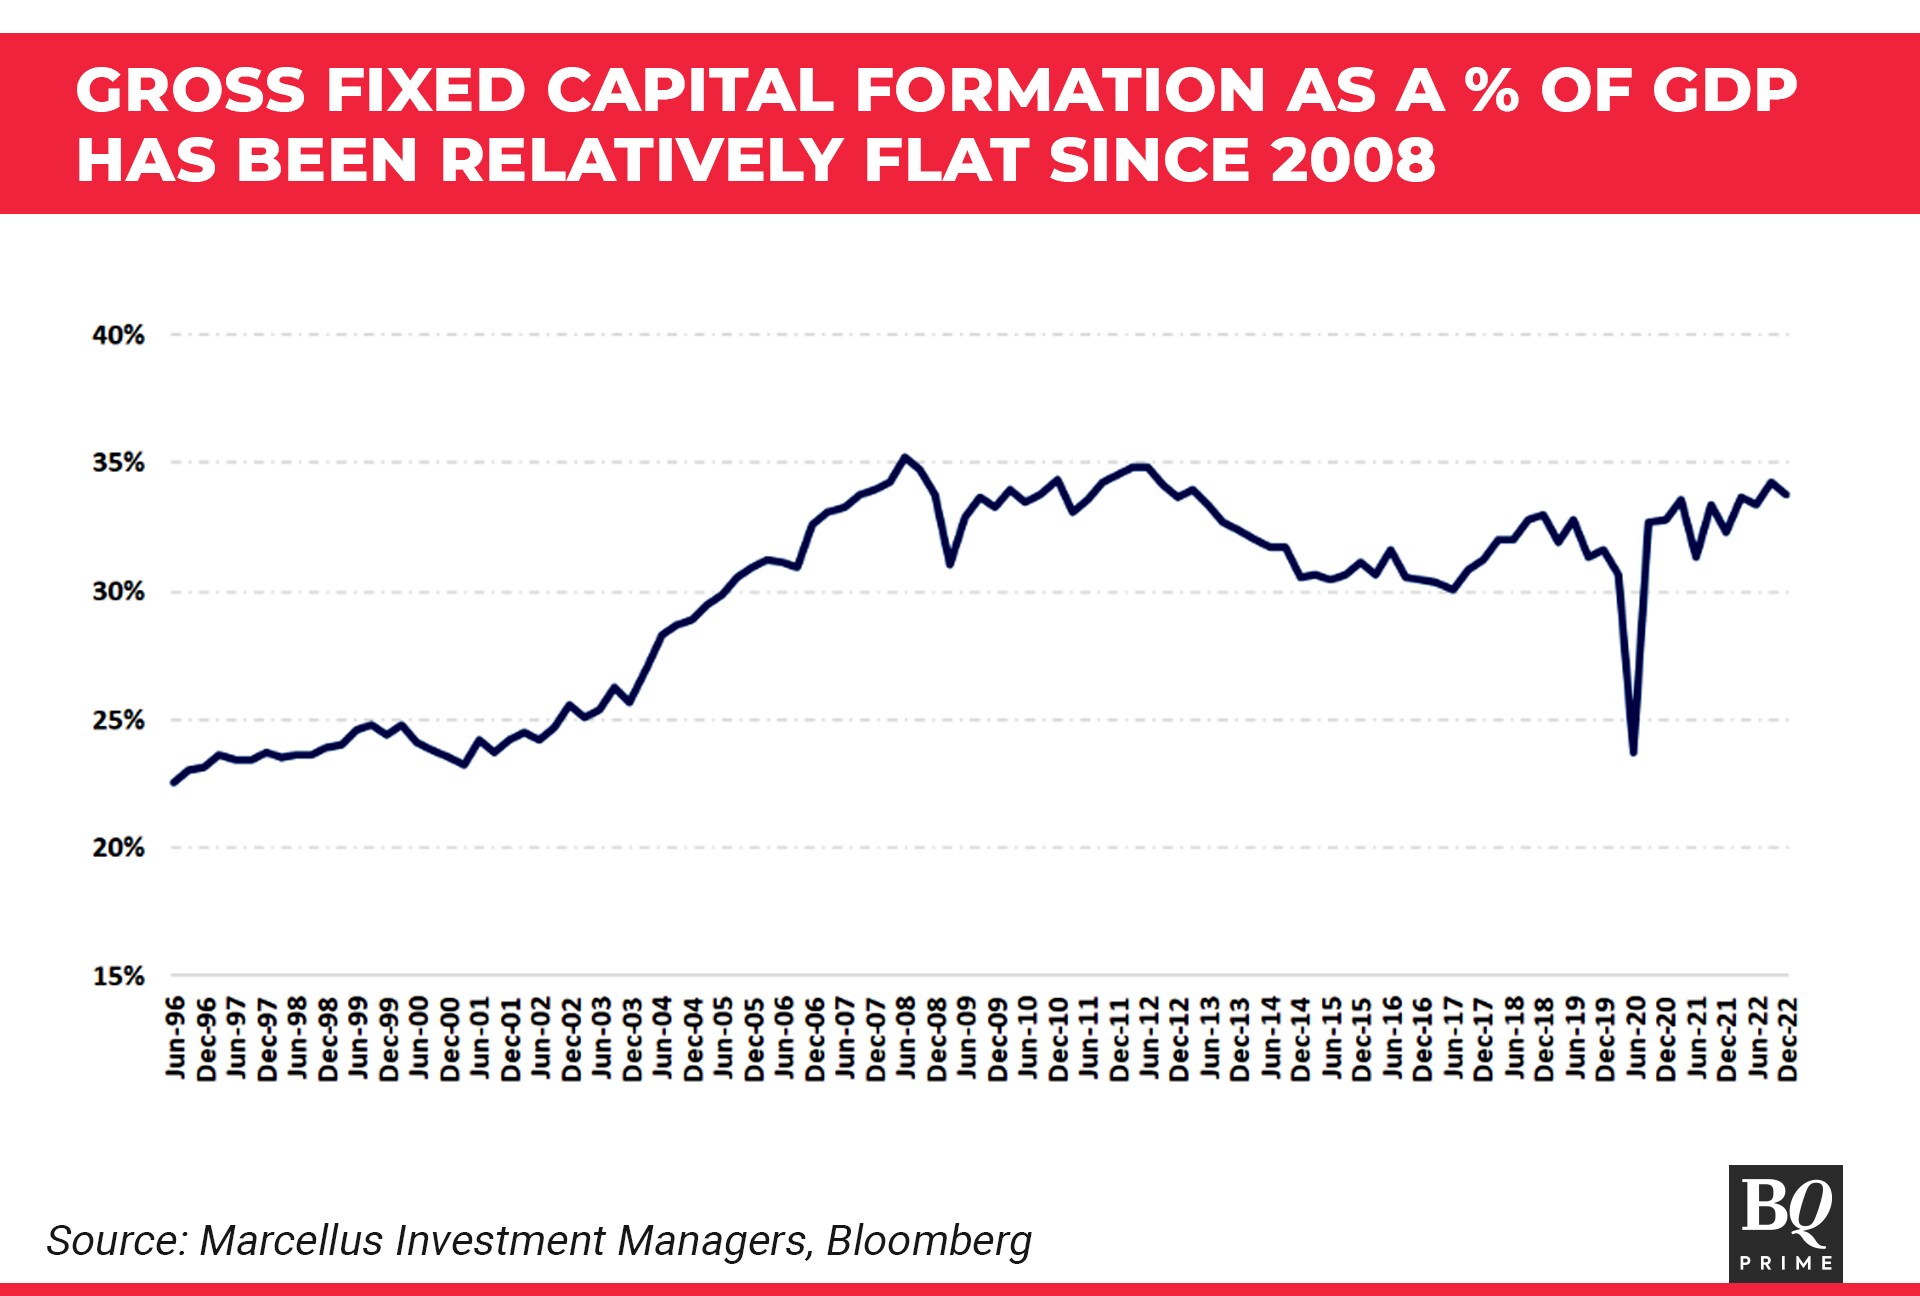
As the exhibit below suggests, GFCF (Gross Fixed Capital Formation is the investment in fixed assets of producers residing in India, net of any disposals, during the year; this is the technical term for capex) as a percentage of India's GDP has hovered around the 30-33% mark for over 15 years now. China's growth take-off post 2003 was underpinned by GFCF: GDP ratios of 40%+. So, what can India do to stimulate capex growth further and take its 30-33% GFCF: GDP ratio to 40%?
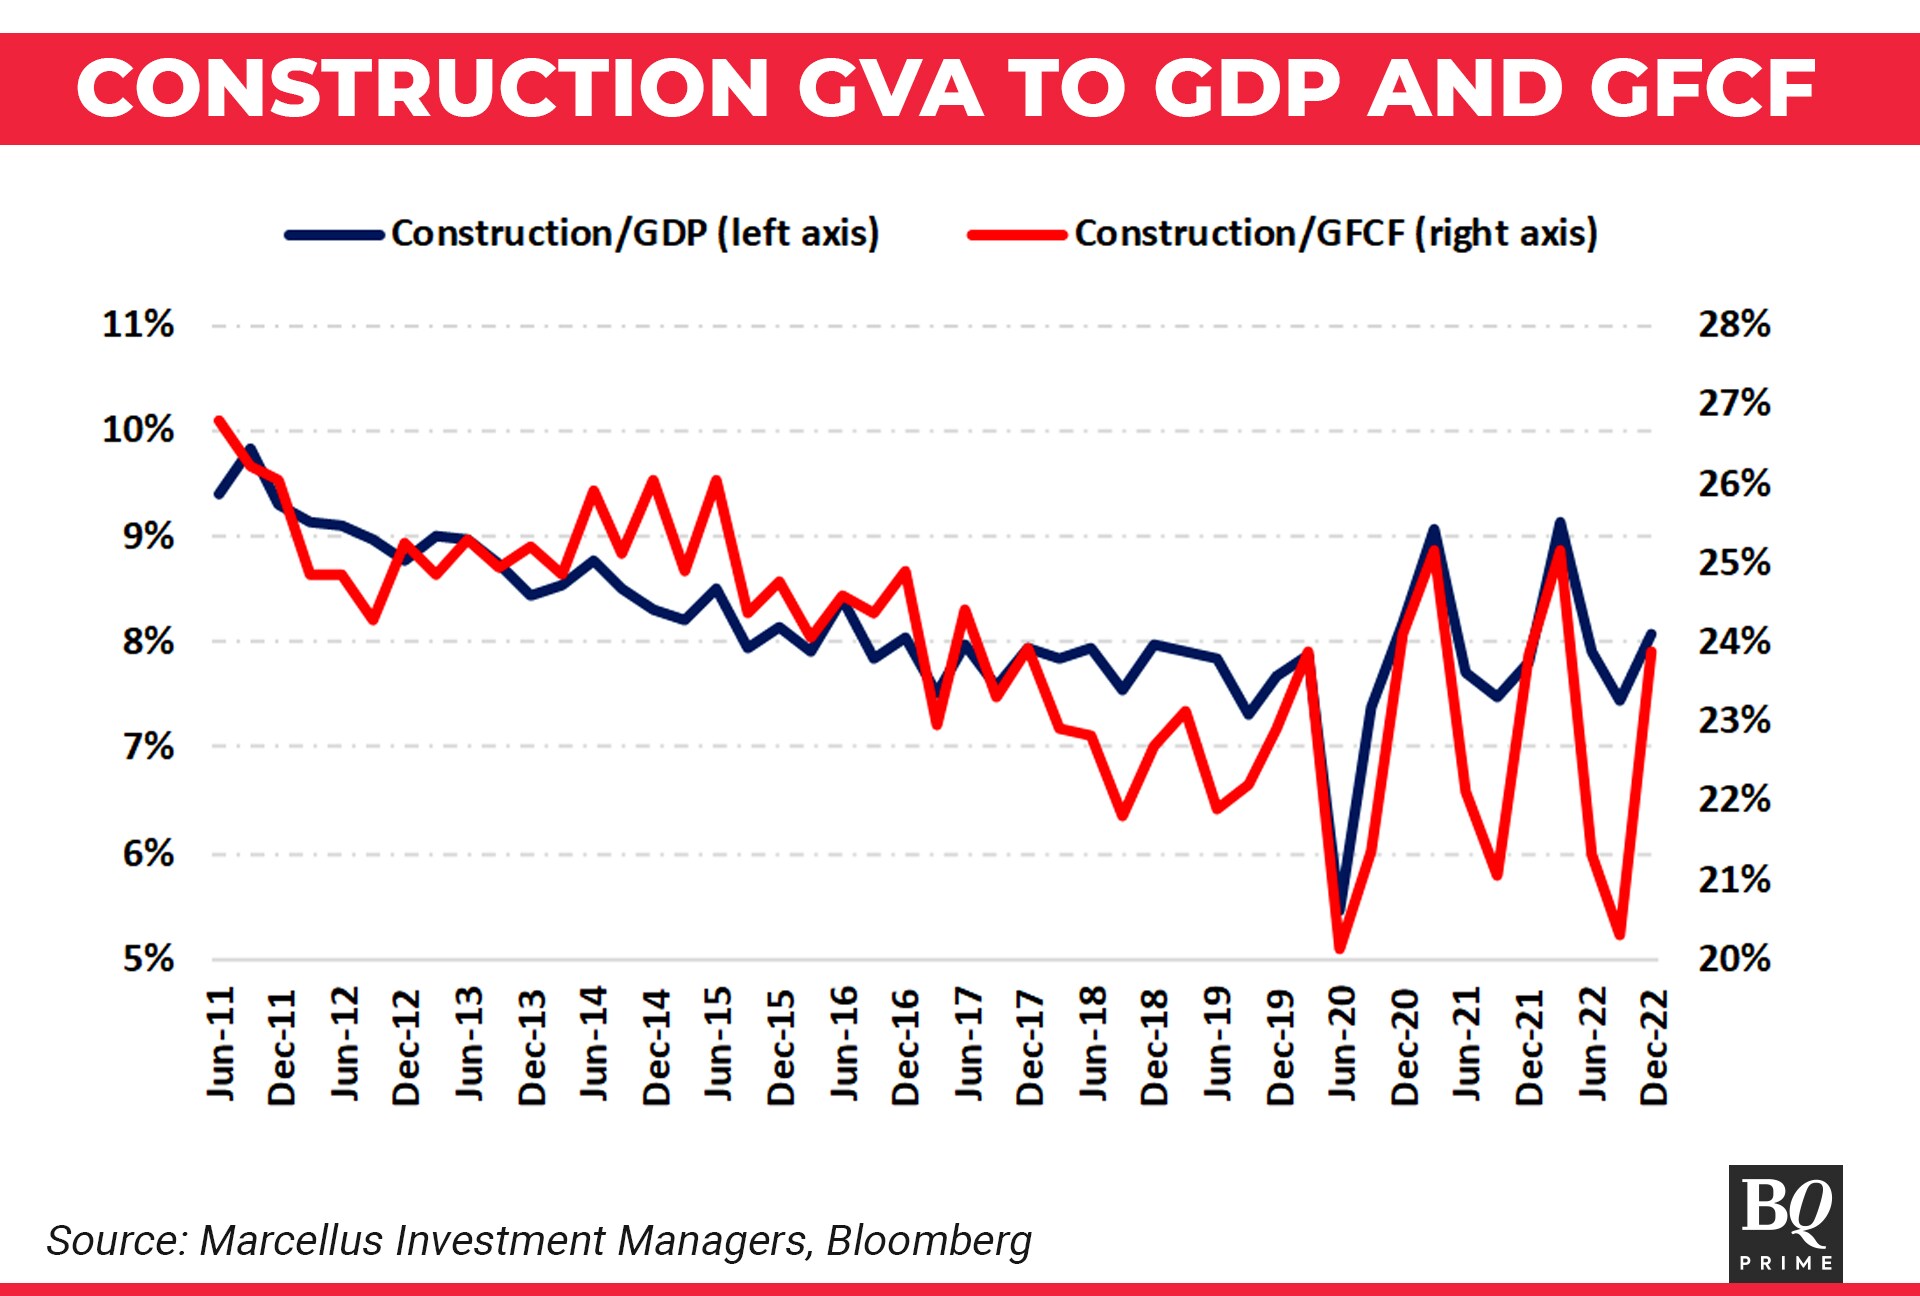
Delving deeper into corporate capex, we find that construction capex (which typically accounts for a quarter of the overall capex pie) is the area where the lack of dynamism is most worrisome.
As shown by the exhibit below, construction capex has now been trending down over a decade now (both as a percentage of GDP and as a percentage of overall capex).
To be fair to the Government of India, it is trying through its own spending to juice up capex. In FY21, FY22, FY23, and FY24 (estimate), government capex has grown at 21%, 44%, 24%, and 37% respectively, significantly faster than both broader economic growth and faster than private sector capex (see here and here).
However, given the modest tax receipts of the Indian Exchequer (central government tax: GDP is a mere 12% compared to 25% for a developed country like, say, the U.K.), government capex is bound to be a small part of the overall capex pie in India (around 14%) and therefore, cannot be expected to be the critical driver of capex growth in India. Corporate capex from the private sector has to be revved up to drive a sustainable economic recovery in India.
So, What Can India Do To Get Private Sector Capex Revved Up?
Economic theory suggests that the higher the corporate tax rate, the lower the incentive for a company to expedite capex. This theory is best understood by comparing the steel industry in the United States and India.
As is well known, steel is a commodity and the price of steel is set by global supply-demand dynamics; no one company, regardless of how competitive it might be, is able to influence the global price of steel. The pre-tax profit margin of a well-managed integrated steel manufacturer tends to be around 18-20%. Furthermore, a $1 billion capex for setting up a steel plant results in 1.3-1.4 million tonnes per annum of production capacity. Taking the current price per ton of steel ($750 per ton), implies annual revenue generation of $1 billion. Applying the pre-tax profit margin of 20% yields an annual PBT of $200 million.
In America, this PBT becomes a PAT of $164 million (applying an effective corporate tax rate of 18%). In India, on the other hand, this PBT becomes a PAT of $150 million (applying an effective corporate tax rate of 22%). The steel plant owner therefore recovers his capex in America in five years versus six years in India (assuming a 10% growth rate and assuming that PBT margins remain stable at 20%).
In fact, there is a significant body of empirical work done by economists, which shows that lower tax rates lead to accelerated corporate capex.
For example:
One of the most comprehensive cross-sectional studies on the subject was collectively conducted by the World Bank, PwC, and Harvard University. The team consisting of S. Djankov, T. Ganser, C. McLiesh, R. Ramalho, and A. Schleifer in 2004 established a significant and negative relationship between effective tax rates for companies and investments by them. To be specific, they found that a 10-percentage point increase in effective corporate tax rate results in roughly a 2-percentage point fall in aggregate investment to GDP ratio.
According to a research paper published by L. Dobbins and M. Jacob in 2016 in Germany, corporate tax cuts do indeed increase corporate investment and that domestic firms (more than foreign firms) benefit from such a change to quite some extent.
R.E. Hall and D.W. Jorgenson found that tax policy has a significant impact on the level of investments by firms and also their timing.
The Government of India has shown that it understands both the above theory and its practical implications. In 2019, the Ministry of Finance, Government of India, slashed the corporate tax rate to 25% from 35%. However, even after this slashing, India's corporate tax rate is higher than that for the world's two largest economies—the U.S. and China (see exhibit below).
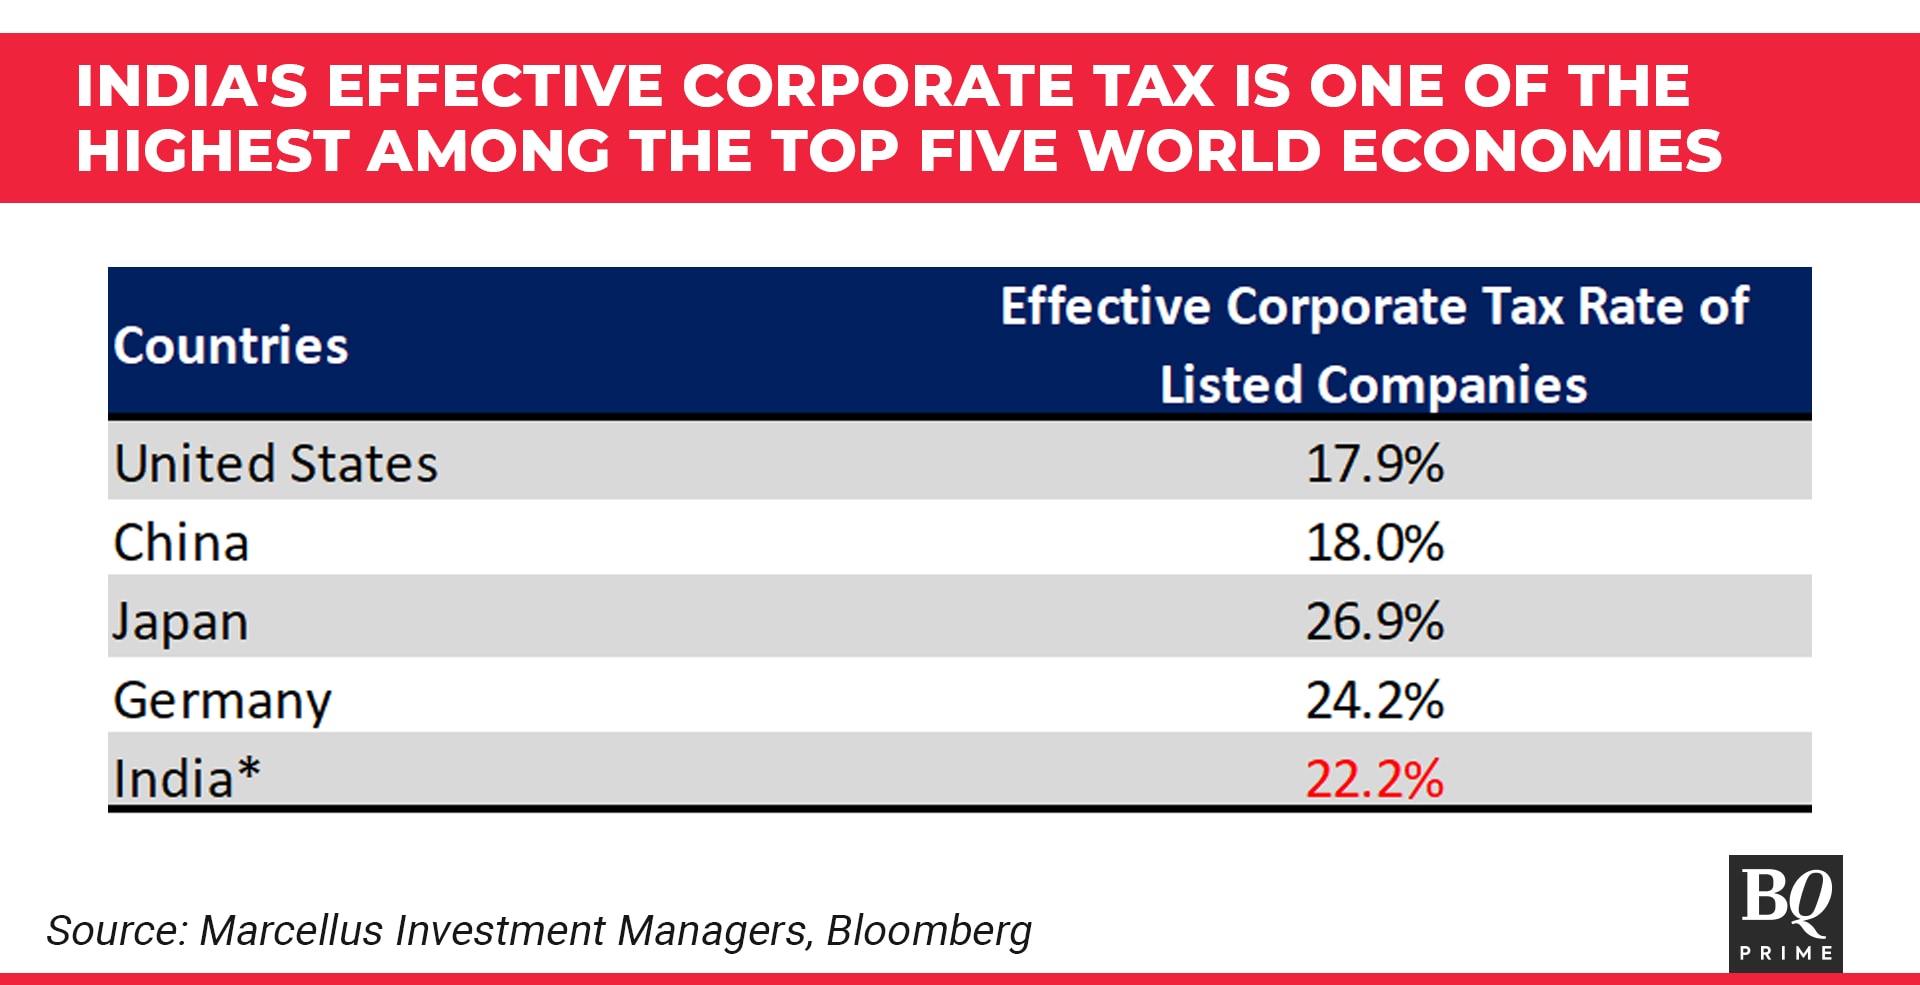
Not only does India's high corporate tax disincentivise capex (as explained by the steel case study outlined above), but it also puts India at a competitive disadvantage to China. To be specific, in several critical sectors where India is emerging as a credible competitor, e.g. electronics manufacturing, specialty chemicals (see our November 2022 note on this subject: China's unravelling creates a $300 billion opportunity for India), the substantial corporate tax rate differential between the economies, possibly makes Indian manufacturers' price points ~2-5% higher than those of their Chinese counterparts. As is evident from the comparison of effective corporate tax rates in Exhibit 4, this entire gap can be more than made up with a 5% point cut in India's corporate tax rate.
Fiscal Implications Of A Corporate Tax Rate Cut
The FY23 Union budget documents show that corporate taxes produced Rs 10 trillion of revenues for the Exchequer. Cutting this number by a fifth (i.e., moving India from a corporate tax rate of 25% to 20%) implies a ~Rs 2 trillion reduction in tax revenues, all other things being equal. This reduction in tax revenues is equivalent to 0.8% of GDP.
Furthermore, cutting the corporate tax rate eliminates the need for expensive and complicated policy interventions like Production-Linked Incentives, which are being gamed by a variety of unscrupulous agents and are costing the Exchequer Rs 0.55 trillion per annum (~0.2% of GDP per year). Therefore, net of the cost of PLIs, the cost of 5% cut in India's corporate tax rate is likely to be close to Rs 1.5 trillion p.a. (0.6% of GDP).
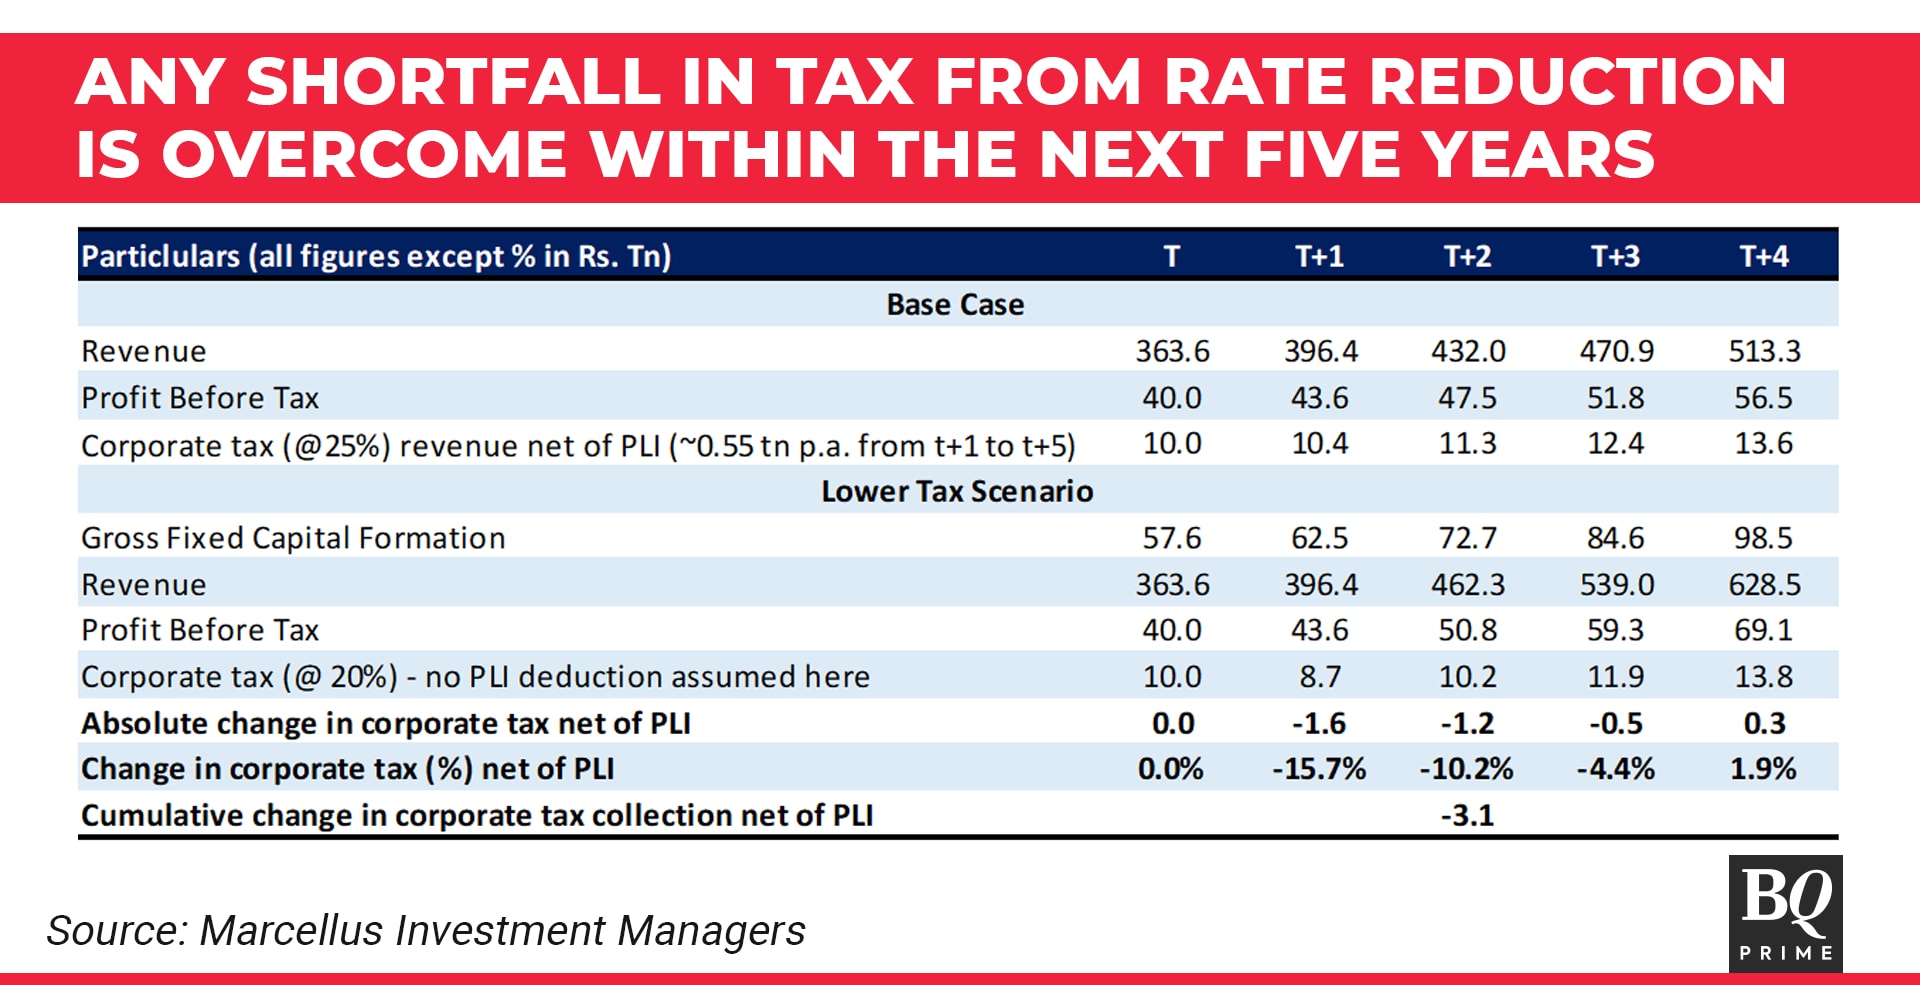
Assuming that the corporate tax rate cuts trigger a recovery in corporate capex, tax revenues should pick up from fiscal years t+2, t+3 and t+4 onwards (‘t' being the year in which the corporate tax rate is cut). Even if we assume a very modest pick-up in corporate tax revenues in year t+1, our modelling suggests (see Exhibit below) that by year t+4 (i.e., within one full General Election cycle), the Exchequer will be better off than it would have been without the corporate tax rate cut. Indeed, the fact that just three years after the 2019 corporate tax rate cut, the Government's direct tax collections are hitting all-time highs (as a percentage of GDP) points to the effectiveness of tax cuts as a method of boosting tax collections.
Courtesy the face-off between China and the United States, India has a once-in-a-generation opportunity to become the factory of the world for knowledge intensive light industrial manufacturing in sectors such as electronics, pharmaceuticals and specialty chemicals. However, India's competitiveness is hindered by an effective corporate tax rate that is 4% points higher than America's or China's. This higher tax rate makes India uncompetitive in key export-oriented sectors and creates the need for expensive policy interventions like PLIs. For India to decisively capture the China+1 opportunity and transform the employment prospects of tens of millions of Indians, a corporate tax rate cut, rather than PLIs, is a necessary and a sufficient pre-condition for take-off.
Nandita Rajhansa and Saurabh Mukherjea work for Marcellus Investment Managers (www.marcellus.in). Disclaimer: Read here.
The views expressed here are those of the author, and do not necessarily represent the views of BQ Prime or its editorial team.
Note for Chart 2: Source: Marcellus Investment Managers, Bloomberg - Organization for Economic Development (OECD); both the metrics are in constant 2015 prices terms.
Note for Chart 3: Source: Marcellus Investment Managers, Bloomberg - Central Statistical Office (CSO); all underlying data reported in 2011-12 constant rs. Bn terms.
Note for Chart 4: Source: Marcellus Investment Managers, Bloomberg, Ace Equity; effective tax rate calculated as income tax expense/profit before tax for S&P 500 companies for the US, CSI 300 for China, TOPIX for Japan, and CDAX for Germany; for India, BSE 500 has been used; Except for BSE 500, all the underlying figures were in USD bn on which tax rate has been calculated, for BSE 500, it was Rs bn; Aall the percentages are for CY22; * - for India, the FY23 number has been used which has been imputed using 9 months FY22- FY22 growth applied to 9 month FY23 numbers.
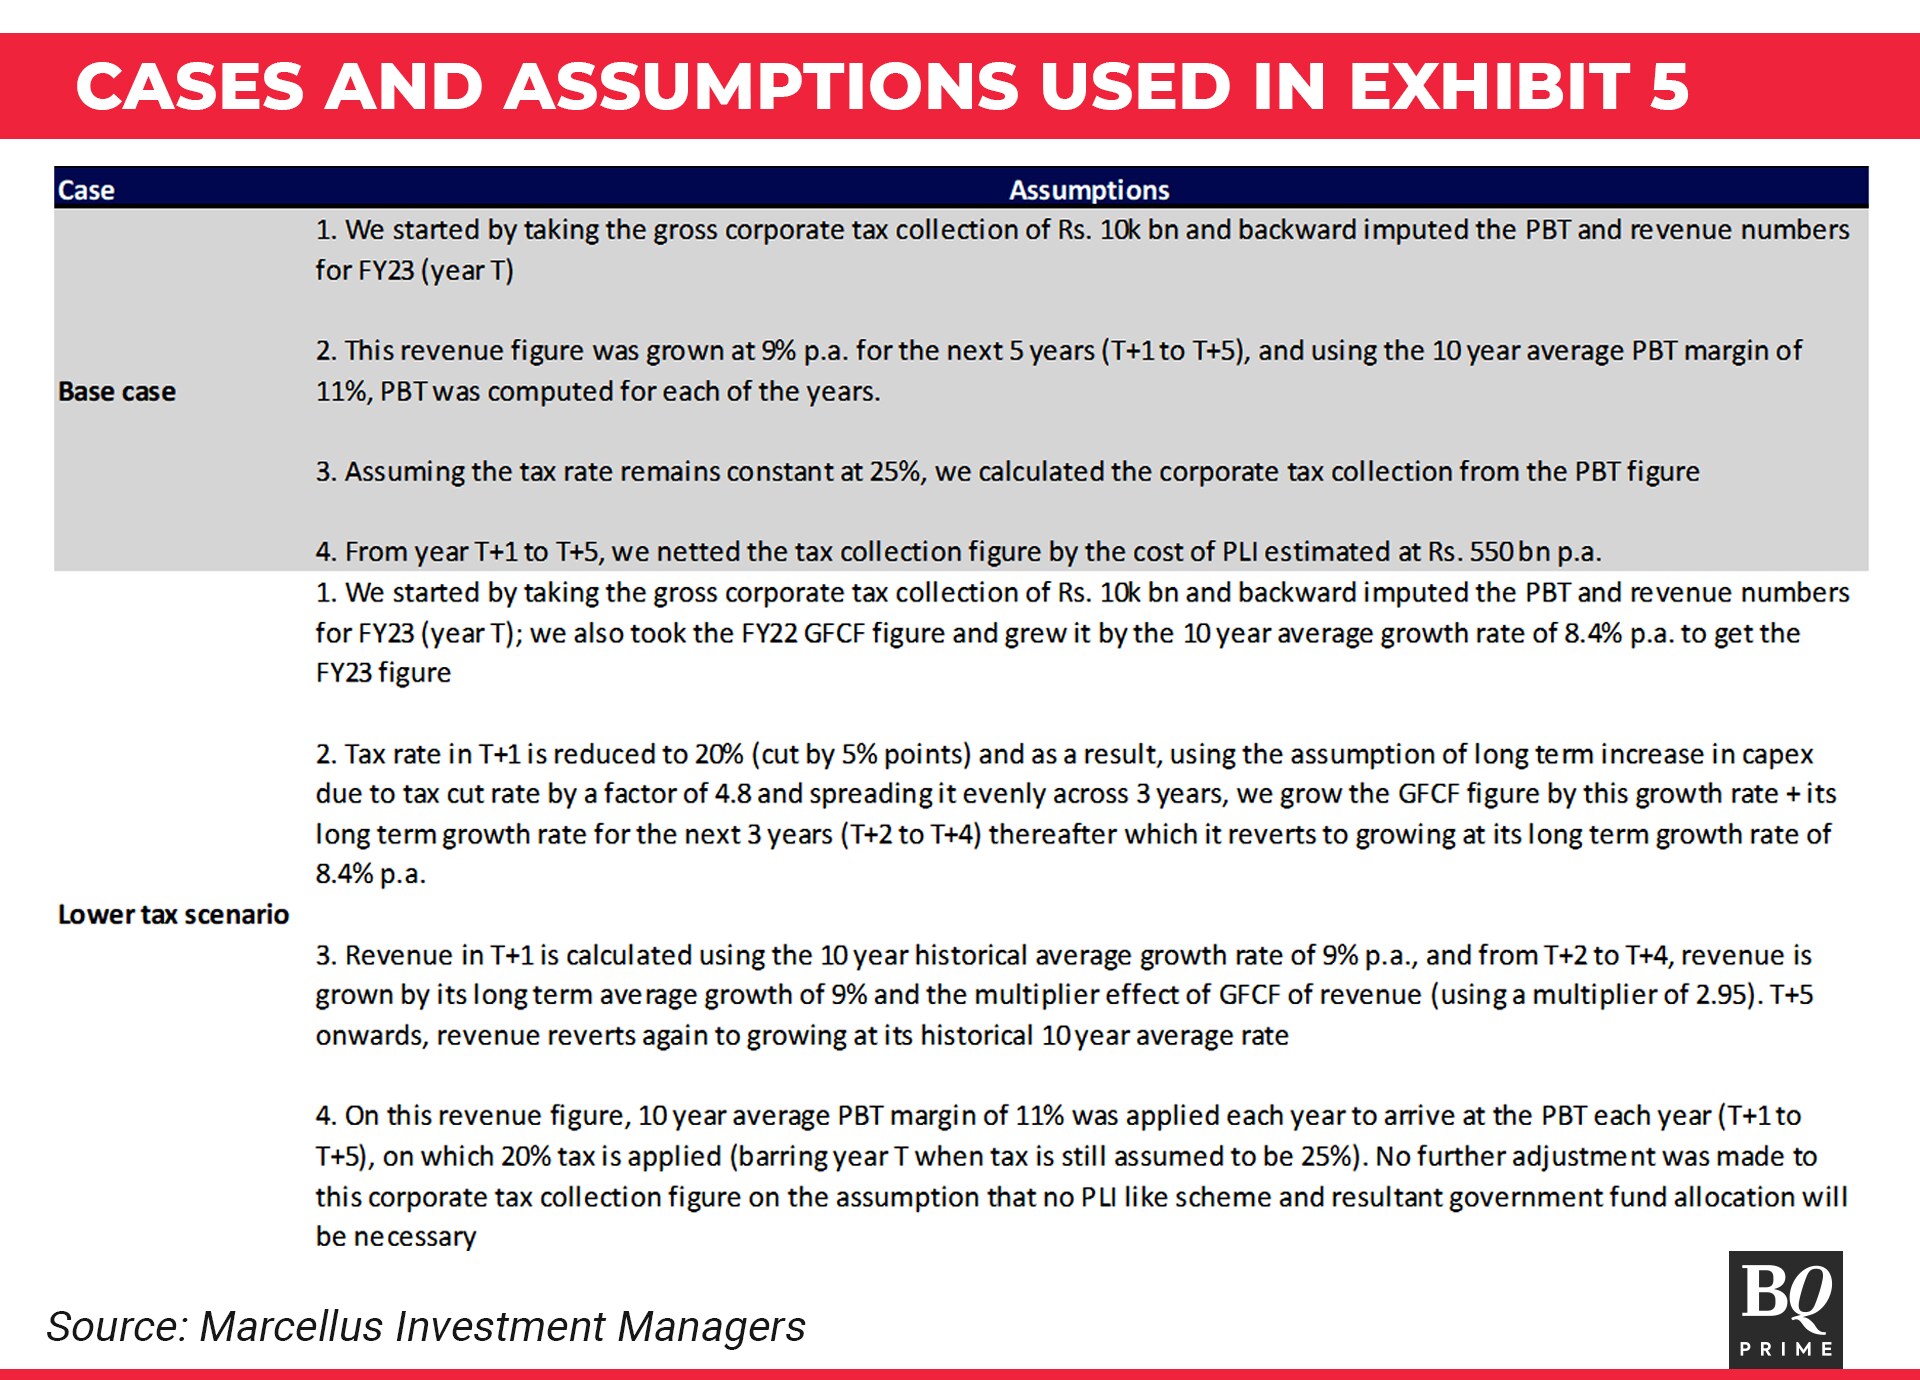
Note for Chart 5: Source: Marcellus Investment Managers, Ace Equity, Tax Foundation.org, MoneyControl; analysis done using backward imputation using the revised estimate of the gross corporate tax collections in India for the latest year (FY23); GFCF for FY23 computed by applying the 10 year average growth rate to FY22 figure; refer to exhibit 6 to understand the key assumptions used to do all the calculation shown above; all figures are in INR trillion.
Essential Business Intelligence, Sharp Market Insights, Practical Personal Finance Advice, Daily Fuel, Gold and Silver Prices and Latest Stories — On NDTV Profit.