
The Nifty 50 began the first trading session of August on a strong note and spent most of the day consolidating within a narrow range. The index repeatedly faced resistance near the horizontal trendline of an ascending triangle pattern. However, the final minutes of trade changed the picture sharply.
Closing Action Session
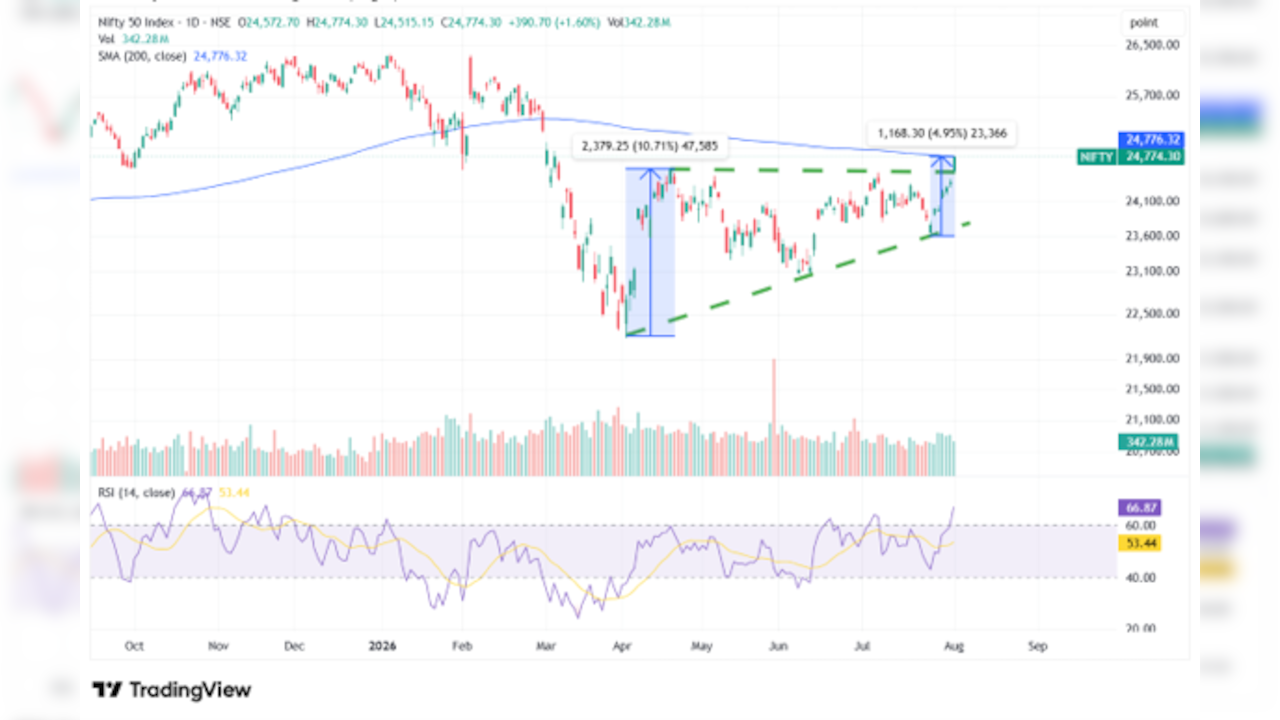
On the debut of the Closing Auction Session (CAS), the Nifty surged nearly 200 points and finished at the day's high of 24,774.30, gaining 1.6%. The sharp closing move also resulted in a breakout from the ascending triangle pattern, bringing the index within touching distance of its 200-day moving average (DMA).
Unfilled Gaps Reflect Strong Buying Momentum
Another encouraging feature of the recent rally is the presence of a few unfilled upside opening gaps created over the last six to seven sessions. Such gaps generally indicate strong buying interest, particularly when the index continues to hold above them.
Also Read | Layoffs Are Rising In Tech, But These Skills Are Helping People Unlock Better Pay
The Nifty has also moved past the April 21 swing high of 24,602 and registered a fresh swing high. Despite opening with a sizeable gap, the index retained its gains throughout the session rather than witnessing immediate profit booking.
The current upswing has now extended for seven trading sessions, during which the index has gained about 1,168 points, or 4.95%.
Moving Average Structure Remains Positive
The index is trading above its 20, 50 and 100-DMAs, while these key moving averages are also trending higher. This keeps the short and medium term structure favourable.
The 14-period RSI has moved firmly into bullish territory, while the MACD continues to reflect strong upward momentum. However, the Nifty is also trading above the upper Bollinger Band, suggesting that the rally has become stretched in the near term.
200-DMA Becomes the Next Key Hurdle
The immediate hurdle is the 200-DMA, placed around 24,776. Considering that a large part of Monday's advance came during the final few minutes under the CAS mechanism, Tuesday's price action will be important.
If the Nifty opens above the 200-DMA and sustains there, the rally can extend towards 24,850 followed by 24,940.
On the other hand, some consolidation or a mild pullback cannot be ruled out after the sharp seven-session advance. Market swings often tend to mature after roughly eight to thirteen trading sessions, and the current rally is already seven sessions old.
Key Support Zone at 24,530-24,600
The immediate support is placed around the ascending triangle breakout zone of 24,530-24,600. As long as the index holds above this region, a buy-on-dips approach remains favourable.
A deeper decline could bring 24,430 into focus. This level also marks an important gap support area and should be closely monitored.
If the Nifty slips decisively below 24,430, the probability of a deeper retracement towards the 20-DMA, currently placed near 24,148, would increase.
Nifty Outlook: Positive Bias Above 24,430
The broader technical structure remains positive following the breakout above 24,602 and the ascending triangle pattern. However, with the index closing near its 200-DMA and trading above the upper Bollinger Band, some near-term cooling off would be healthy.
As long as the Nifty protects the 24,430-24,530 support region, the bias remains positive. A sustained move above the 200-DMA would strengthen the breakout and open the way towards 24,850-24,940.
Stock to Watch: Siemens
Siemens is trading near the breakout point of a 14-week consolidation and has closed above its previous minor swing high. The recent price action has also been supported by higher volumes over the last two trading sessions, indicating improving buying interest.
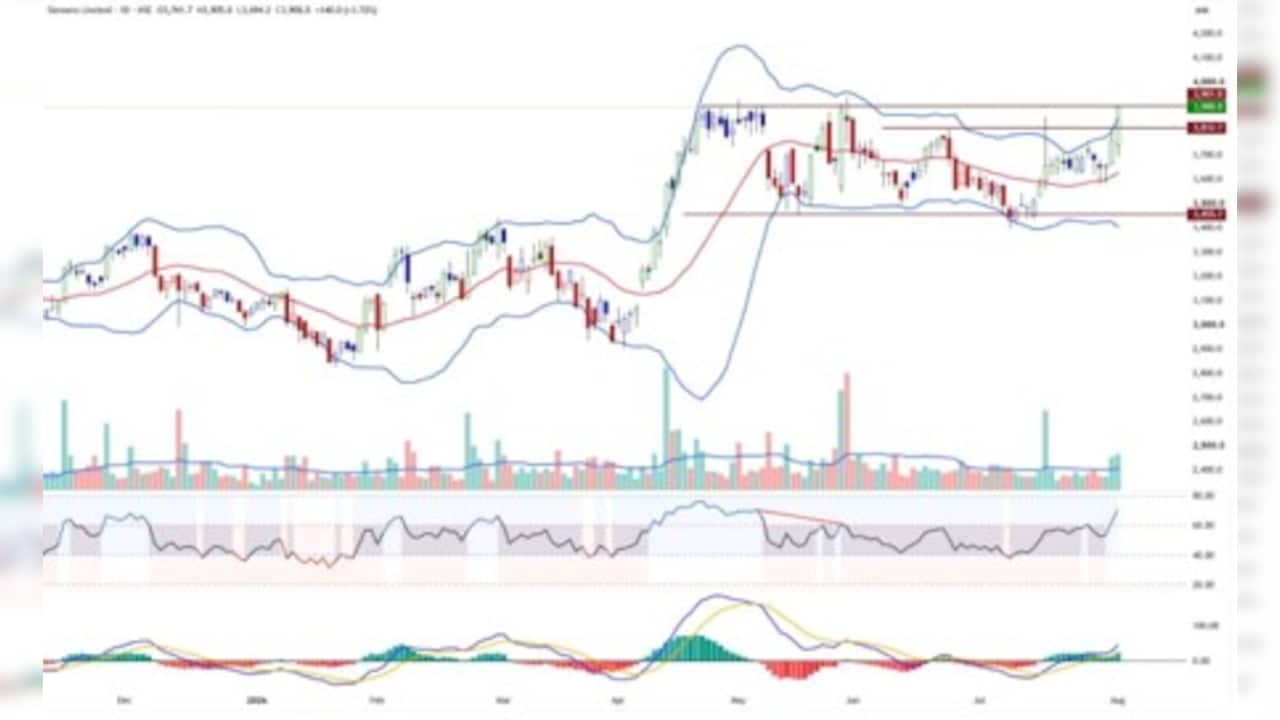
The stock is comfortably placed above all its key moving averages, which continue to trend higher. The moving average ribbon also remains positively aligned, while the Bollinger Bands are expanding on the upside, reflecting strengthening momentum.
Momentum indicators are supporting the bullish setup. The weekly MACD has generated a fresh buy signal, while the RSI has shifted into the bullish zone across multiple time frames. The Stochastic RSI has also triggered a fresh bullish signal. In addition, the KST remains positive and the Elder Impulse System has formed a strong bullish bar.
The rising Relative Strength line further indicates that Siemens is outperforming the broader market.
From a trading perspective, a sustained move above Rs 3,902 can strengthen the breakout and open the way towards Rs 4,015. Traders may maintain a stop loss at Rs 3,810.
If the stock sustains above Rs 4,015, the next upside targets are placed at Rs 4,180 and Rs 4,250.
Essential Business Intelligence, Sharp Market Insights, Practical Personal Finance Advice, Daily Fuel, Gold and Silver Prices and Latest Stories — On NDTV Profit.