
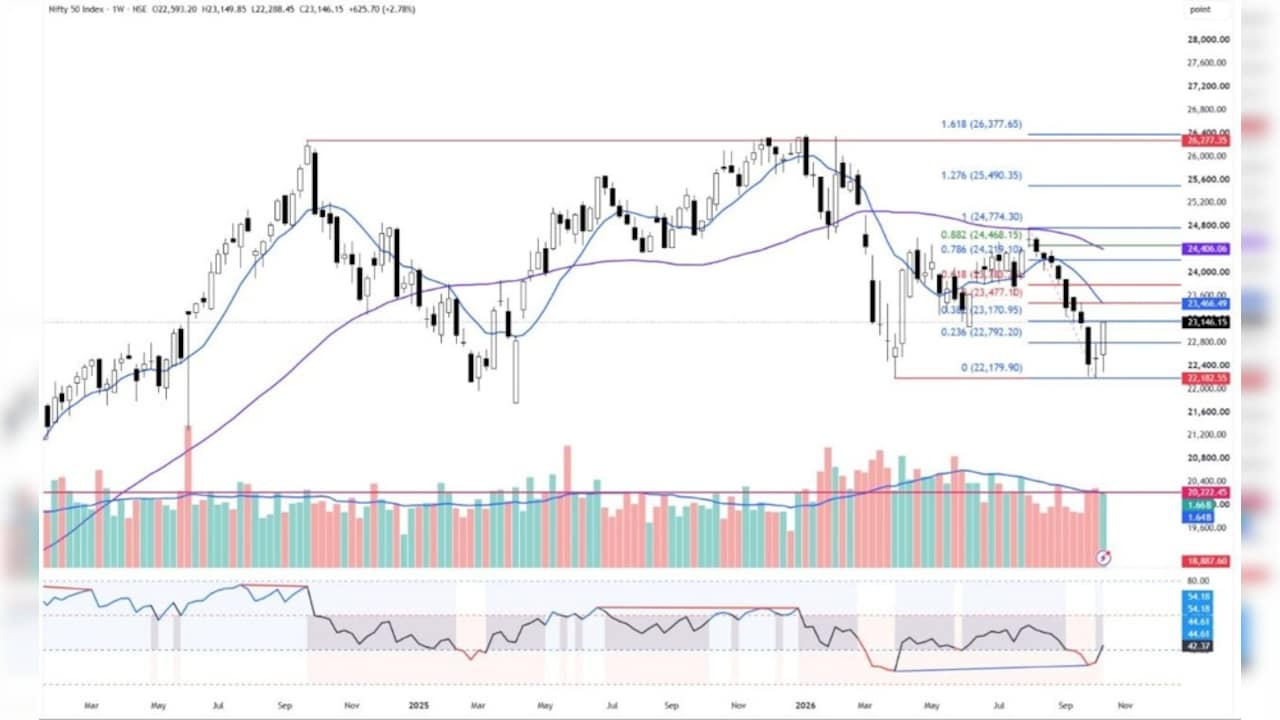
The Nifty extended its recovery for the second consecutive week, gaining 2.64% and recording its sharpest weekly rally in over eight months. The index closed above the previous week's Doji high, confirming the bullish implications of that candle. For the first time in 10 weeks, it also closed above the preceding week's high, marking an improvement in the weekly price structure.
The index formed a higher-high and higher-low candle on the weekly chart, while a series of higher lows on the daily chart reflected sustained buying interest. From the previous week's low of 22,179, the Nifty recovered nearly 970 points, or 4.37%, after successfully defending a crucial support zone.
Reclaiming the 200-Week Average Is a Key Development
One of the most important technical developments was the Nifty reclaiming its 200-week moving average, currently placed at 22,649, after slipping below it in recent weeks. This recovery has eased concerns over a deeper correction and helped the index regain an important long-term trend reference.
Also Read | Layoffs Are Rising In Tech, But These Skills Are Helping People Unlock Better Pay
The Nifty is also trading firmly above its 20-DMA. Meanwhile, the lower Bollinger Band has started to flatten, indicating that downward pressure is easing. The index has nearly retraced 38.2% of its decline from the August 3 high to the October 8 low, with this retracement level placed at 23,171. The recovery towards this level strengthens the case for a counter-trend rally, although a broader trend reversal is yet to be established.
Nifty IT Strongest Weekly Rally Since April 2008
The IT sector was the standout performer, with the Nifty IT index surging 11.72% during the week, its strongest weekly gain since April 2008. The sector index also closed above its previous swing high, supported by sharp gains in leading IT stocks, some of which broke out of their consolidation bases.
The India VIX declined to 14.02. On the momentum front, the 14-period daily RSI has moved back above the neutral 50 mark, while the MACD has displayed bullish momentum over the past three trading sessions. An RSI reading above 60, accompanied by the MACD line crossing above the zero line, would further strengthen the recovery.
Nifty Outlook: 23,171 Is the Immediate Hurdle
The near-term outlook remains positive as long as the Nifty holds above the previous session's low on a closing basis. A decisive close above 23,171, the 38.2% Fibonacci retracement level, could extend the rally towards 23,477, which represents the 50 per cent retracement of the recent decline.
However, the 23,460-23,480 zone could act as a significant resistance area, as the 10-week moving average, currently at 23,466, also lies within this range.
On the downside, immediate support is placed between 23,000 and 23,070. If this zone fails to hold, the index could retest Friday's low of 22,913. A close below this level would weaken the short-term bullish structure and raise the possibility of renewed selling pressure.
For now, the price action favours a continuation of the recovery, but the Nifty must clear the 23,171 hurdle to sustain its upward momentum. The movement around the 23,460-23,480 resistance zone will be important in determining whether the rally can extend further.
Stock to Watch: Indian Hotels Company
Indian Hotels Company has registered a bullish breakout from a 10-week consolidation on above-average volume, indicating strong buying interest. The Relative Strength (RS) line has reached a new high, reflecting the stock's outperformance relative to the broader market.
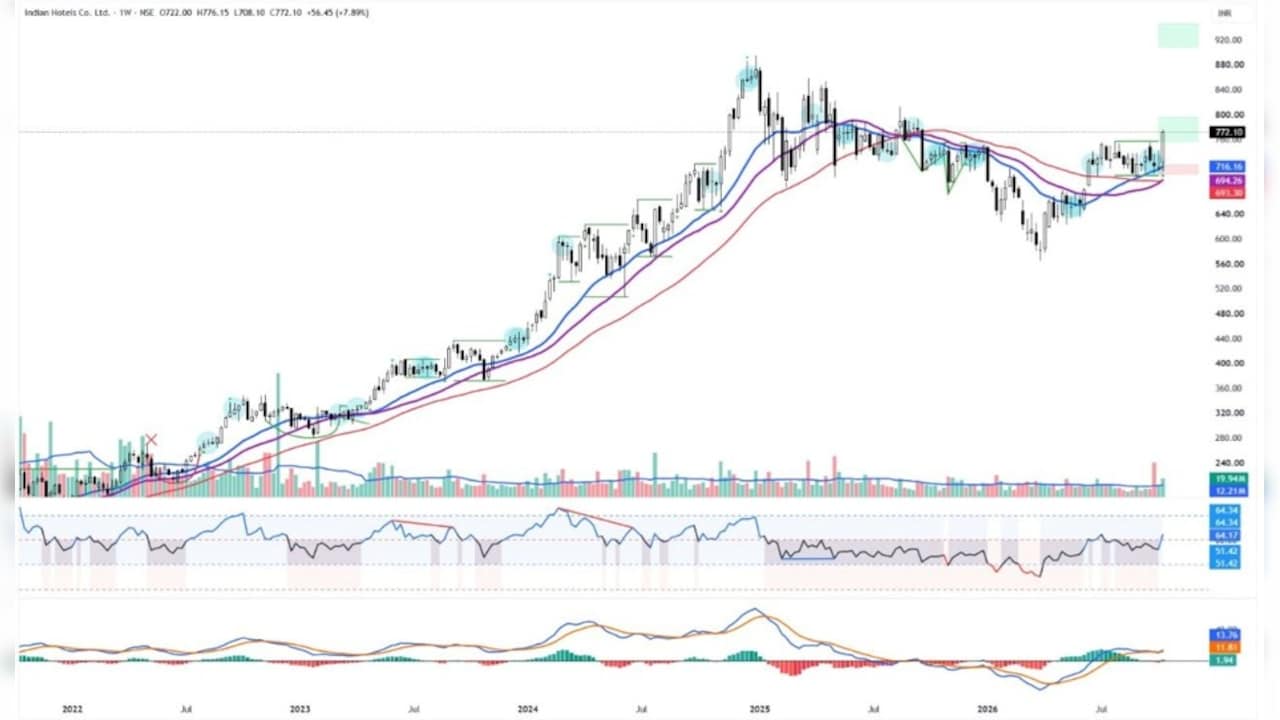
The technical structure remains positive, with all short- and long-term moving averages trending upwards. Notably, the 30-week moving average provided strong support during the recent consolidation. The moving average ribbon also remains in an uptrend, reinforcing the bullish outlook.
Momentum indicators further support the positive setup. The MACD has generated a fresh bullish signal, while the 14-period daily RSI has shifted into the bullish range. Additionally, the Elder Impulse System has formed a strong bullish bar, confirming improving momentum.
Overall, the breakout, supported by volume and multiple technical indicators, suggests the potential for further upside. A sustained move above Rs 774 could pave the way for an initial target of Rs 800, with a further upside target of Rs 833 if the stock decisively crosses Rs 800. A stop-loss should be maintained at Rs 748.
Essential Business Intelligence, Sharp Market Insights, Practical Personal Finance Advice, Daily Fuel, Gold and Silver Prices and Latest Stories — On NDTV Profit.