Tuesday's session began on a subdued note, with the Nifty 50 opening almost unchanged and briefly slipping below the 22,300 mark. However, buying interest emerged at lower levels, helping the index recover steadily through the session and eventually close at the day's high, above 22,700.
The sharp recovery resulted in the formation of a sizeable bullish candle resembling a Closing Marubozu, characterised by a long real body and a close at the session's high. The price action reflected sustained buying interest, particularly as the session progressed.
More importantly, the index closed above the previous session's high and registered its highest closing level in five trading sessions. It also reclaimed its 8-EMA, which had repeatedly restricted recovery attempts during the recent decline. A move back above the 200-week moving average was another encouraging development, suggesting an improvement in the technical structure.
Also Read | Layoffs Are Rising In Tech, But These Skills Are Helping People Unlock Better Pay
Double-Bottom Breakout Could Open Further Upside
The hourly chart offers further evidence of improving price action. Nifty has broken out of a pennant-like consolidation and is now approaching the neckline of a potential double-bottom formation, with the two lows established on October 1 and October 8.
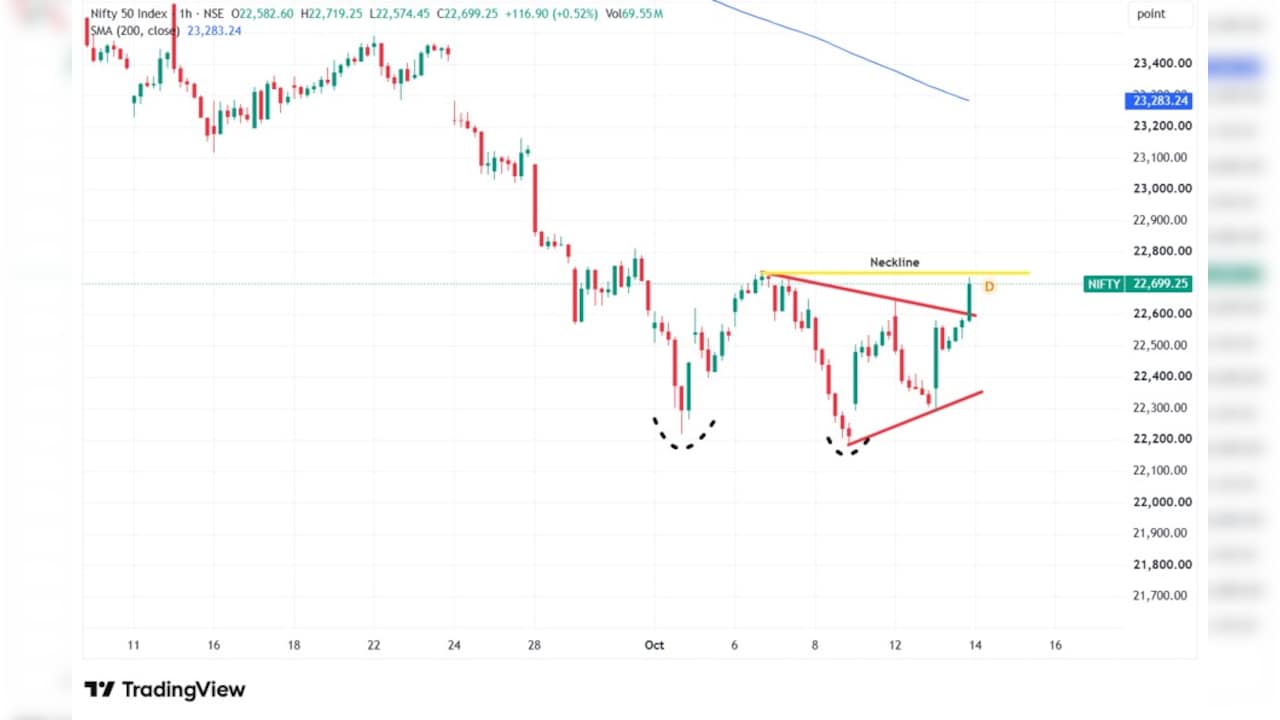
The neckline is placed near 22,732, making it an important level to watch. A sustained move above this resistance could extend the recovery towards the 20-DMA, currently placed around 22,883. The index is now just 0.70% below this average, and a decisive close above it would strengthen the bullish case.
Such a move could subsequently open the way towards the 23,000-23,070 zone, an important area where earlier support could now act as resistance under the principle of change in polarity.
Momentum Improves, But Follow-Through Remains Important
Momentum indicators have also started supporting the recovery. The 14-period daily RSI has crossed above 40 for the first time since early September, indicating that selling pressure is beginning to ease. Meanwhile, MACD indicator has generated fresh bullish signals on both the daily and hourly charts.
While these developments are encouraging, the RSI needs to sustain its upward movement, supported by further price gains, to establish a more convincing change in momentum.
On the downside, immediate support is placed around 22,500, followed by Tuesday's low of 22,288.45. A breach of this level could bring the recent swing low near 22,180 back into focus.
Overall, Tuesday's price action marks a meaningful improvement in structure after a weakness. However, the next test for the bulls will be to sustain the recovery above 22,732 and reclaim the 20-DMA. Until then, the advance is better viewed as an improving recovery rather than a confirmed trend reversal.
READ | Stock Market Today: All You Need To Know Going Into Trade On Oct 14
Stock to Watch: Persistent Systems
Persistent Systems has registered a bullish breakout from a six-week cup pattern, supported by above-average trading volume. The stock's Relative Strength (RS) line has reached a new high, indicating its outperformance relative to the broader market.
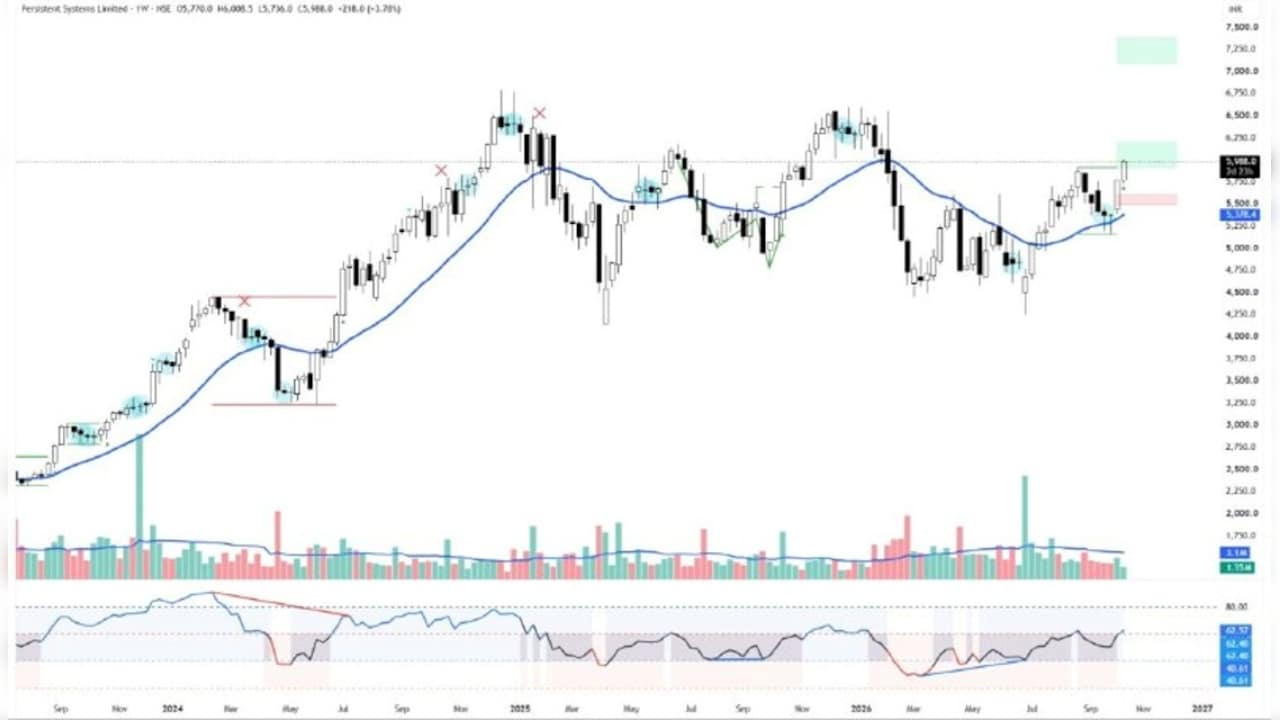
The overall trend remains positive, with both short- and long-term moving averages trending higher. Notably, the 30-week weighted moving average (WMA) provided support during the base formation, reinforcing the strength of the underlying trend. Meanwhile, the Bollinger Bands have started expanding in an upward direction, suggesting a potential increase in bullish momentum.
Momentum indicators also support the positive outlook. The MACD remains bullish on both the daily and weekly charts, while the RSI is trading in the bullish zone across both timeframes. Additionally, the Elder Impulse System has formed a strong bullish bar, reflecting the strength of the current move.
Overall, the breakout, supported by improving momentum and relative strength, suggests scope for further upside. A sustained move above Rs 6,000 could see the stock testing Rs 6,270, followed by Rs 6,350. Traders may maintain a stop-loss at Rs 5,840.
READ | Asian Stock Markets Today: Kospi, Nikkei Advance As Traders Await US Inflation Data
Essential Business Intelligence, Sharp Market Insights, Practical Personal Finance Advice, Daily Fuel, Gold and Silver Prices and Latest Stories — On NDTV Profit.