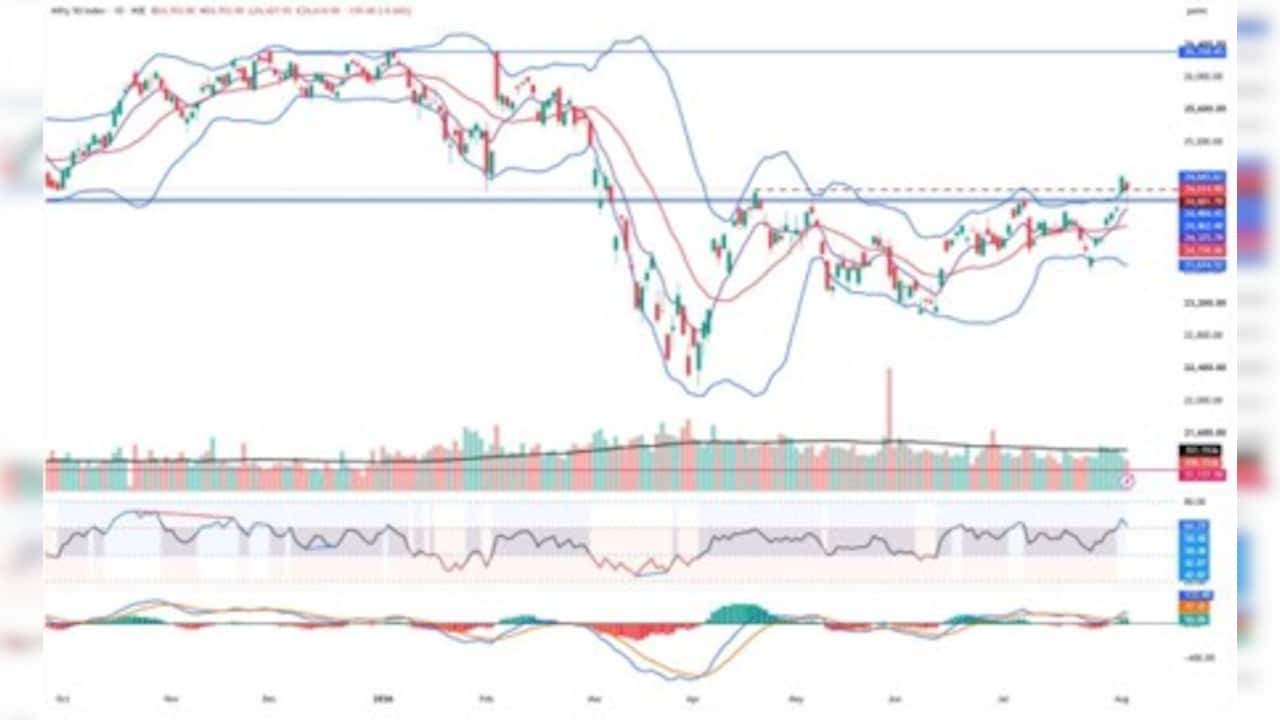
After Monday's sharp rally, the Nifty 50 opened Tuesday's session on a weak note and remained under selling pressure for most of the day. As losses deepened, the index moved below 24,450 level and eventually filled the upside gap created on August 03, 2026. However, some of the losses were recovered towards the close during the Closing Auction Session (CAS).
Tuesday's price action formed an open-equals-high candle with a long lower shadow, indicating buying interest emerging around the gap zone. As highlighted in our previous analysis, the index retraced back within the Bollinger Bands and filled the gap. The decline also brought an end to the eight-session upswing.
Broader Trend Remains Constructive
Despite Tuesday's decline, the broader market structure remains largely intact. The Nifty continues to trade above the April 21 swing high of 24,602 and has effectively retested the recent breakout zone.
Also Read | Layoffs Are Rising In Tech, But These Skills Are Helping People Unlock Better Pay
The index is also holding above its key short- and medium-term moving averages, including the 20-DMA, 50-DMA and 100-DMA. However, it is yet to reclaim the crucial long-term 200-DMA.
Momentum indicators continue to remain supportive. The 14-period RSI is holding in bullish territory, while the MACD indicates that underlying momentum remains positive. Relative Strength is also showing signs of improvement.
24,773 Remains the Key Hurdle
As long as the Nifty holds above 24,602, the broader structure remains constructive. However, a close below Tuesday's low of 24,427 would weaken the near-term setup and could invite further selling pressure.
On the upside, the immediate resistance is placed at the 200-DMA near 24,773. For the next leg of the rally to gain momentum, the index needs to decisively move above and sustain over this level. Such a breakout could open the way for an advance towards the 24,880-24,940 zone.
On the downside, immediate support is placed around 24,520, followed by Tuesday's low of 24,427.
Stock to Watch: Hindalco Industries
Hindalco Industries has broken out of a 24-day flat base and closed above a key resistance zone, strengthening the near-term technical setup. Before entering this consolidation phase, the stock had corrected by more than 20% and retraced nearly 61.8% of its March-to-June rally.
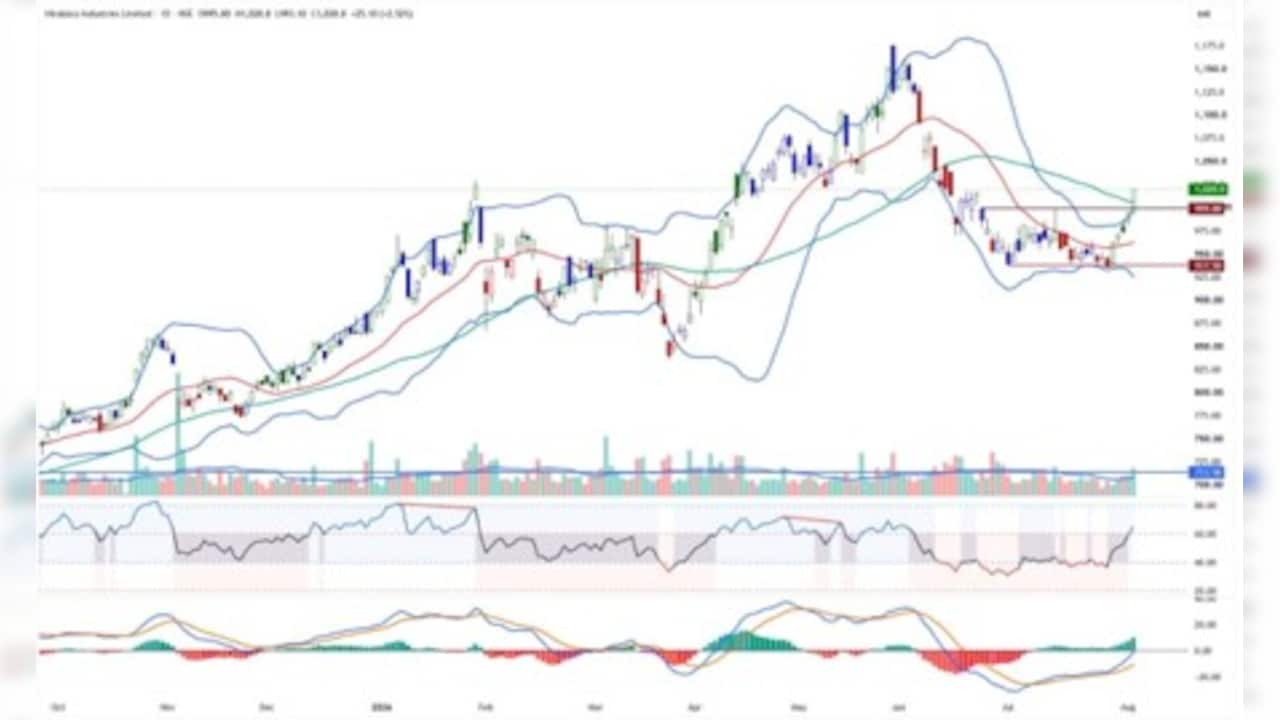
The breakout is supported by improving participation. Trading volumes have remained above average for the past three sessions, indicating sustained buying interest. Relative Strength has also improved, with the stock outperforming the Nifty 500.
Hindalco is now trading above all major short- and long-term moving averages and has moved decisively above its 30-week and 40-week averages. The Bollinger Bands have started expanding, while the stock has also closed above the moving average ribbon, suggesting a pickup in trend momentum.
Momentum indicators remain supportive. The MACD continues to stay bullish, while the 14-period daily RSI has moved into the bullish zone. The KST and Stochastic RSI are also positive, and the Elder Impulse System has formed a strong bullish bar.
Overall, the stock has registered a bullish breakout from its recent consolidation. A move above Rs 1,013 could strengthen the momentum and open the way towards Rs 1,067. A stop-loss can be maintained at Rs 981. If the stock sustains above Rs 1,067, the next upside level to watch is Rs 1,108.
Essential Business Intelligence, Sharp Market Insights, Practical Personal Finance Advice, Daily Fuel, Gold and Silver Prices and Latest Stories — On NDTV Profit.