The Nifty 50 could see a technical rebound if it holds the 23,960-24,137 support zone after falling for seven straight sessions, but a decisive break below this range could extend the correction towards 23,800-23,750. The index closed below its 50-day moving average on Wednesday and remains in a pattern of lower highs and lower lows.
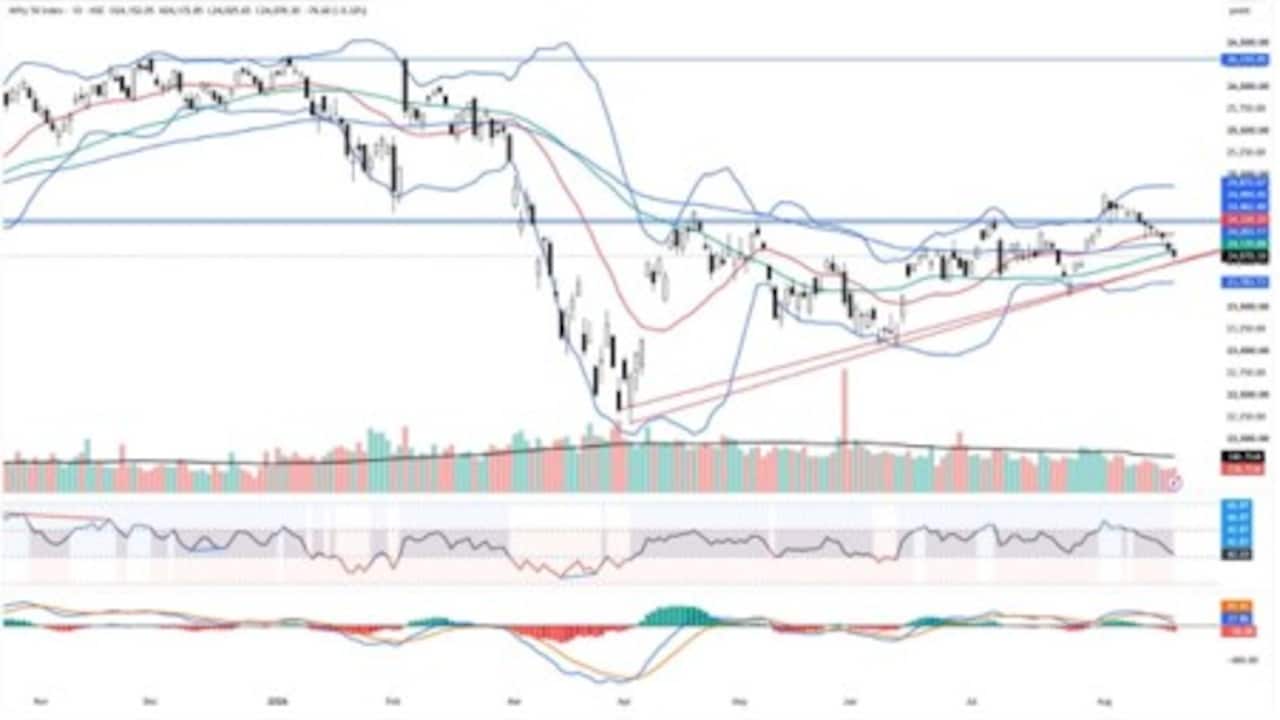
The Nifty slipped below its 61.8% retracement level during Wednesday's session before recovering to close above it. It also came close to its rising trendline support, leaving the index at a key technical level.
At the close, the Nifty settled at 24,078.30, down 76.60 points, or 0.32%, extending its losing streak to seven sessions. The index opened flat, came under selling pressure during the first two hours and then traded in a narrow range for the rest of the session.
Also Read | Layoffs Are Rising In Tech, But These Skills Are Helping People Unlock Better Pay
Nifty Support And Resistance Levels
The 23,960-24,137 range is the key support area, with several technical levels converging around it. The technical note said “the possibility of a technical rebound remains open if this support zone holds”.
A sustained move above the support zone could allow the index to recover. But a decisive break below it could take the Nifty towards 23,800-23,750, according to the technical setup.
On the upside, 24,173 is the immediate hurdle. The index needs to sustain above Wednesday's high and close beyond it to break the recent pattern of lower highs and lower lows. A move above that level could open the way towards 24,300-24,328.
The broader market also remained weak, while momentum indicators continued to show pressure. The Relative Strength Index has fallen below its previous low and is near a key support level. The MACD line has moved close to zero, indicating a loss of upward momentum.
Elgi Equipments Breaks Out
Elgi Equipments is the stock to watch in the technical setup after breaking out of a 12-week flat base on stronger trading activity. Its volumes remained above average over the past two weeks, while its Relative Strength line was close to a fresh high, pointing to outperformance against the broader market.
The stock's short- and long-term moving averages are trending higher, while its 30-week moving average supported the base formation. The note also said the expansion in Bollinger Bands pointed to stronger price momentum following the breakout.
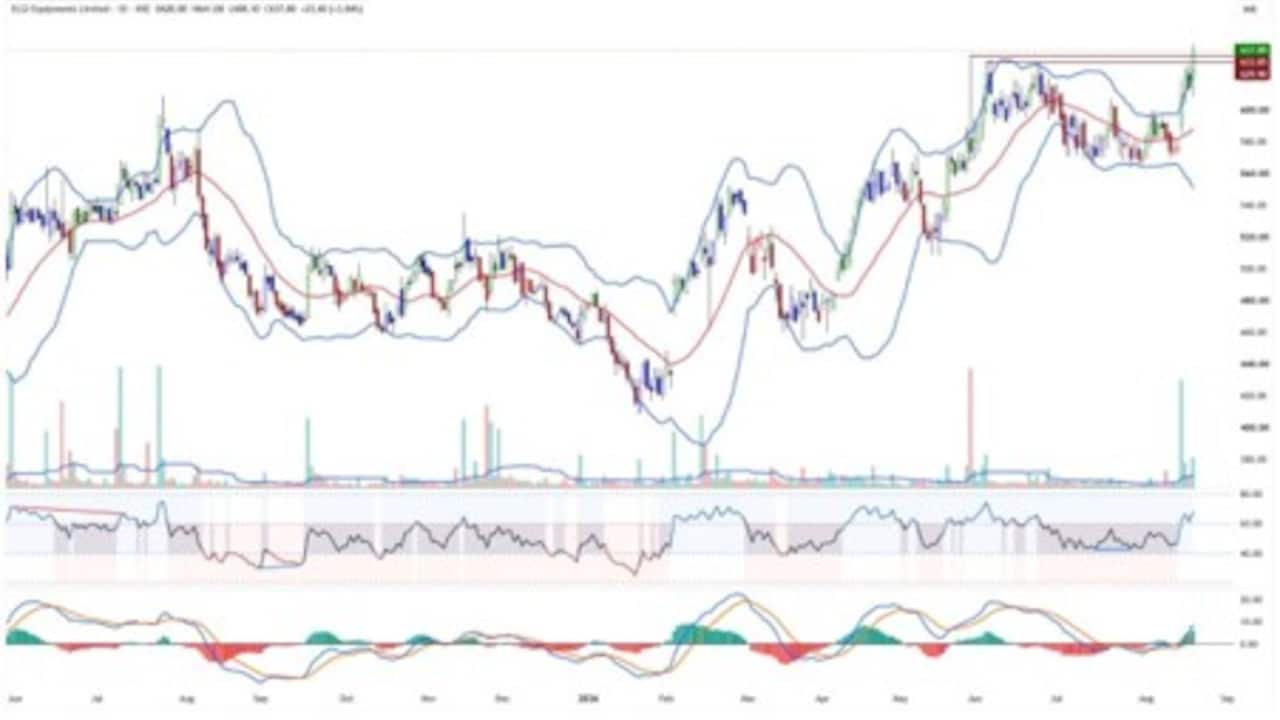
The 14-period RSI has moved into the super-bullish zone and remains bullish across multiple time frames. The daily MACD is also trending higher and has diverged positively from its nine-period average.
A sustained move above Rs 640-642 could take Elgi Equipments towards Rs 690, with a stop loss at Rs 587. A decisive move above Rs 690 could extend the upside towards Rs 750.
Catch all the live updates on stock markets here.
Essential Business Intelligence, Sharp Market Insights, Practical Personal Finance Advice, Daily Fuel, Gold and Silver Prices and Latest Stories — On NDTV Profit.