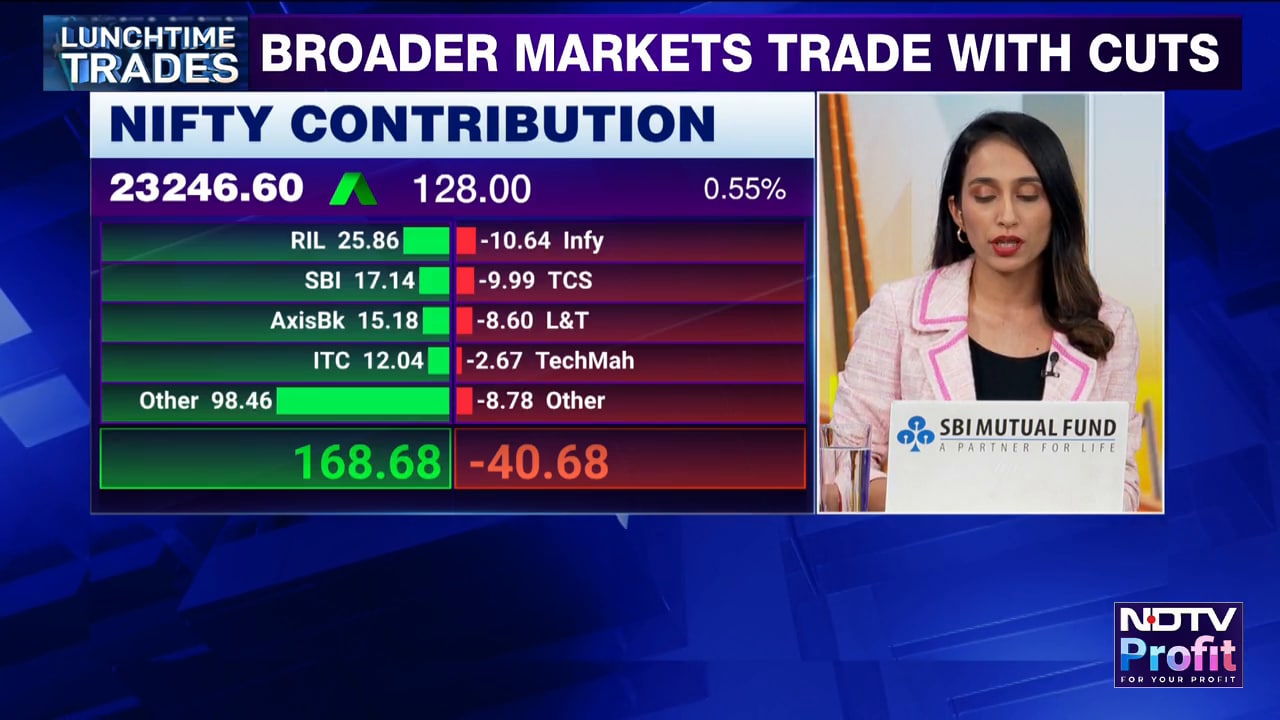
After the extended weekend, the Nifty 50 started Tuesday's session on a firm note, opening 178 points higher on September 15. The early optimism, however, did not last long. Selling pressure returned soon after the open and intensified through the session, pulling the index sharply lower.
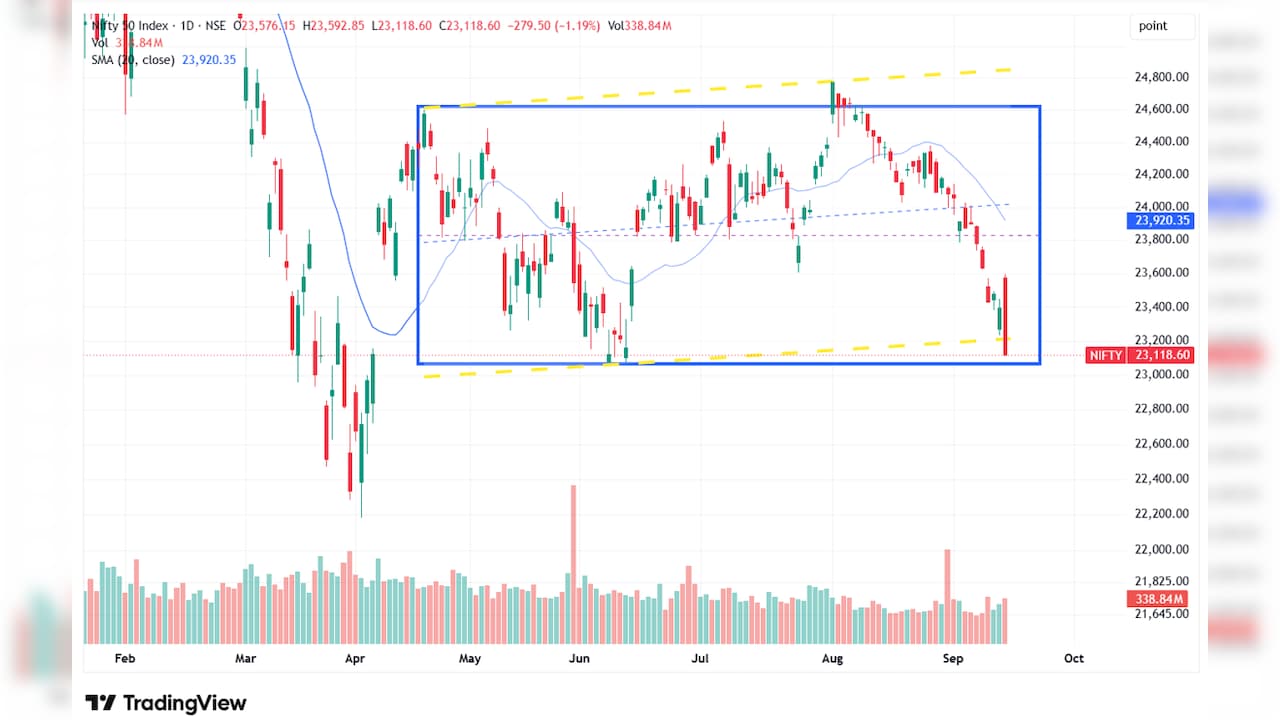
Nifty ended the day 279.50 points down at 23,118.60, its lowest closing level since April 6, 2026. From the intraday high of 23,592, the benchmark gave up nearly 474 points, underlining the extent of the reversal from higher levels.
Weakness persisted even during the Closing Auction Session, where the index slipped another 54 points as sellers remained dominant into the close.
Also Read | Layoffs Are Rising In Tech, But These Skills Are Helping People Unlock Better Pay
Nifty Nears the Lower End of Its Five-Month Trading Range
Tuesday's decline resulted in a large bearish candle on the daily chart and pushed Nifty to a fresh five-month low. The index is now moving closer to the lower end of the broad consolidation range that has been in place for much of the past five months.
stock market today
Photo Credit: NDTV Profit/AI Generated
The 23,070 mark has therefore become a key level to track. It represents the lower end of this broader range, and a decisive close below it could weaken the structure further and increase the risk of an extended decline.
Momentum Remains Firmly Negative
The technical picture continues to remain weak. Nifty is trading around 4.18% below its 50-DMA and 3.25% below its 20-DMA, indicating sustained pressure below important short-term moving averages.
During the session, the index tested its 8-EMA but failed to sustain above it and subsequently slipped below its channel support.
The 14-period daily RSI has fallen to 22.23, placing the index deep in oversold territory. On the weekly timeframe, the RSI has moved below 40, showing that the loss of momentum is also visible on a broader chart structure. The MACD histogram continues to stay in negative territory and reflects strong bearish momentum. From its August 3 high, the Nifty has now corrected by nearly 1,655 points, or around 6.68%.
Critical Zones for September 16
On the upside, the immediate resistance zone is placed between 23,267 and 23,380. Nifty will need to move back above this range and sustain there before any meaningful improvement in the short-term structure can be considered. The next major resistance lies between 23,572 and 23,623. This zone coincides with the downside gap created on September 9 and is likely to remain an important supply area during any pullback.
On the downside, 23,070 remains the key support. A closing break below this level could trigger another leg of weakness.
In such a scenario, the April 2 low of 22,182.55 would become the next important technical reference point. For now, the broader setup remains tilted towards the bears, with the index trading below major moving averages and momentum indicators continuing to stay weak. Any recovery attempt will first need to overcome the immediate resistance band before the short-term structure begins to stabilise.
Essential Business Intelligence, Sharp Market Insights, Practical Personal Finance Advice, Daily Fuel, Gold and Silver Prices and Latest Stories — On NDTV Profit.