


One of the constant debates in Indian economic circles over the last few years has been the inability to compare GDP data over a long period of time.
India's statistical office shifted to a new GDP series, with a base year of 2011-12, in 2015. Since then, a niggling question has been whether data points under the old series and new series are comparable. And what the long term growth trajectory of the Indian economy has been.
A recent study on real sector statistics constituted by the National Statistical Commission has some answers. The report dated July 15 was released on July 25.
The study provided GDP data as per the new series going all the way back to 1994-95, allowing a comparison of trends between the two series until 2013-14.
One takeaway from the data is that the two series show similar growth trends directionally. However, there is a divergence of about 40 basis points on average between the growth rates thrown up by the two series.
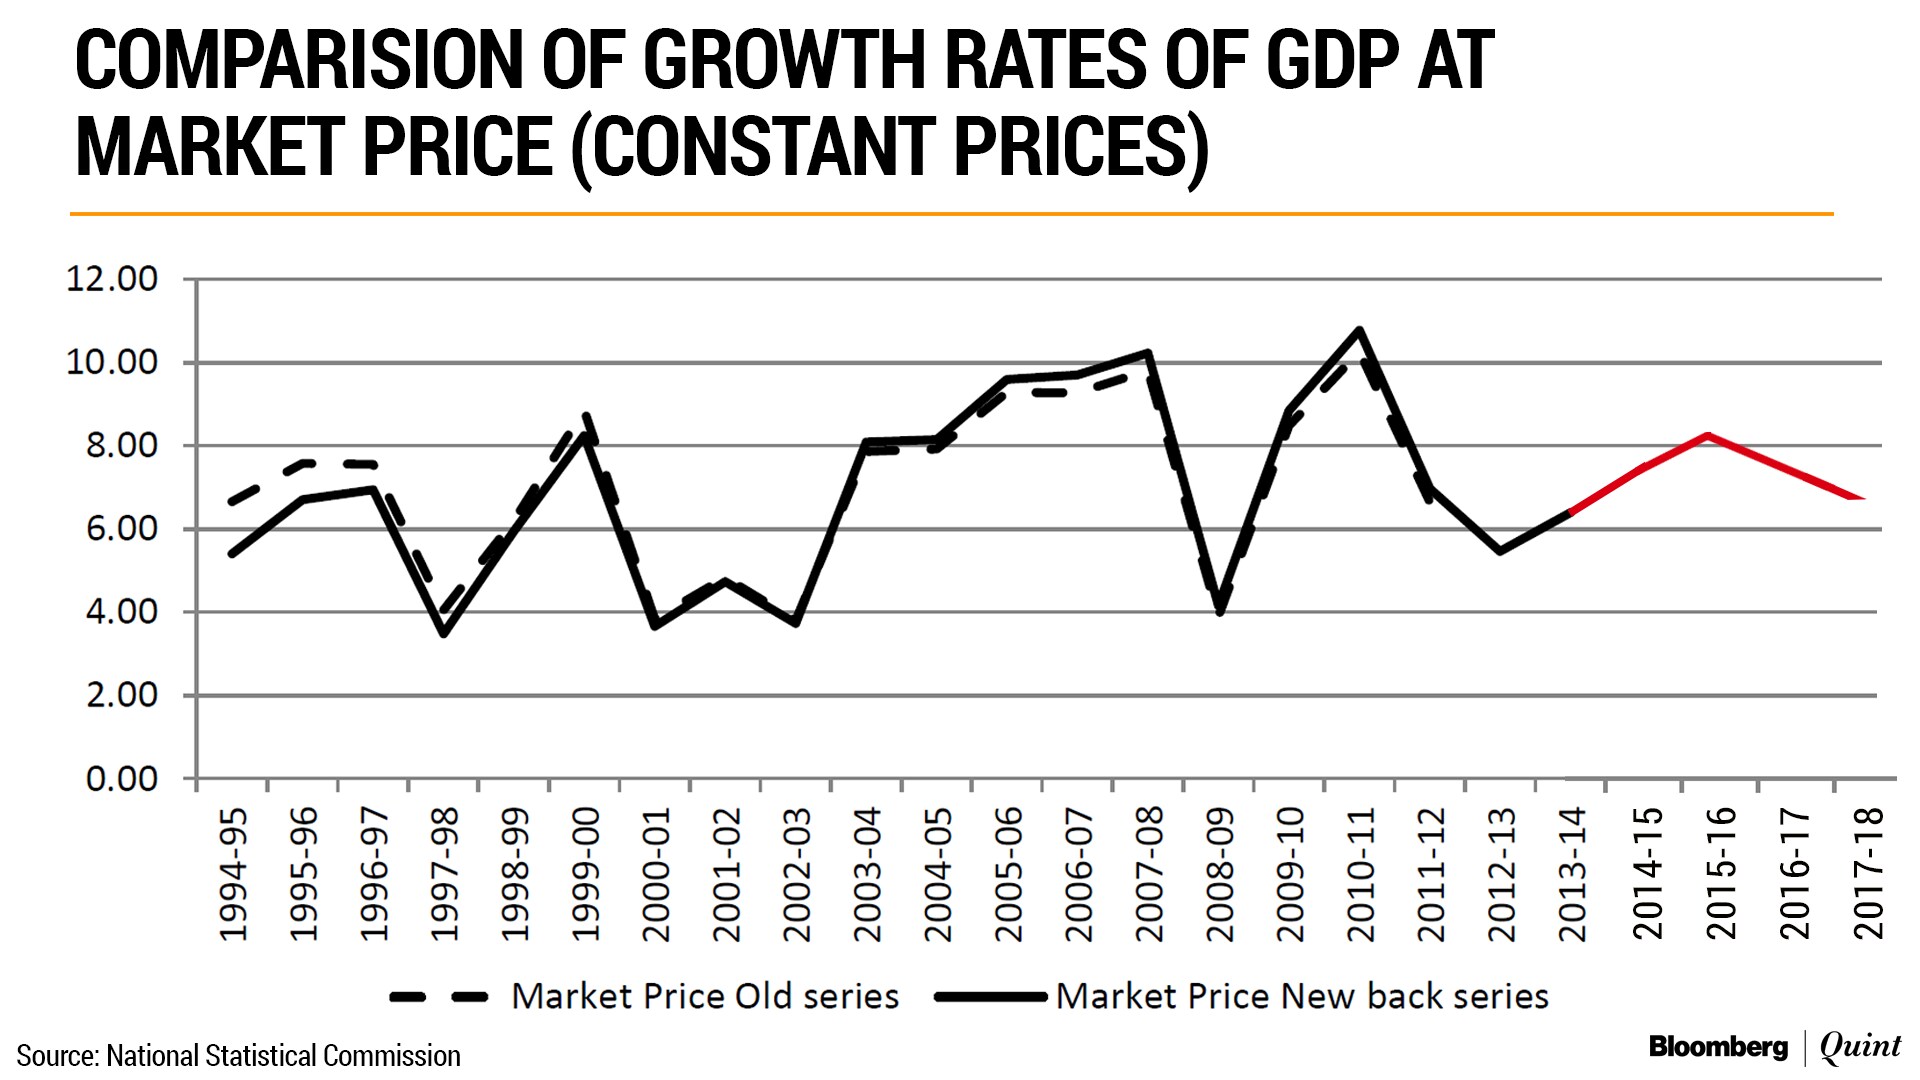
“The difference between growth rates in the old series with 2004-05 as base year, and the new back series, with 2011-12 as base year, had minimal differences, largely because of the discrepancy variable, found to be highly volatile,” said the report.
GDP can be computed either by adding expenditure or by finding production and adjusting for taxes and subsidies. The reconciliation between both is the discrepancy variable.
While the two series showed similar trends, the new series has been throwing up higher growth rates consistently since 2003-04, said Aditi Nayar, prinicpal economist at rating agency ICRA.
Devendra Pant of India Ratings shared that view.
Frequent revisions in base year will help narrow the difference between growth rates since divergence is lesser when measured closer to the base year. That said, the difference is not too alarming and directionally the same.Devendra Pant, Chief Economist, India Ratings and Research Pvt. Ltd.
Peak & Trough Of Growth
The back-data for GDP growth under the new series also gives some insights into the peaks and troughs of growth in India.
The highest GDP growth reported under the new series was in 2010-11 at 10.78 percent, shows the data. After that the deceleration was sharp, with growth slipping to 6.96 percent in 2011-12 and further to 5.46 percent in 2012-13.
Prior to that period, GDP growth had hit double digits the year before the global financial crisis. Under the new series, GDP growth in 2007-08 was at 10.23 percent, which fell to 4.15 percent in 2008-09.
The lowest GDP growth rate reported by India under the new series was in 2000-01 at 3.66 percent, shows the data.
The data quickly took on a political hue. In a tweet from its official handle, the Congress party noted that economic growth rates as measured by the new GDP series were higher during its rule, when compared to the Bharatiya Janata Party.
The GDP backseries data is finally out.
It proves that like-for-like, the economy under BOTH UPA terms (10 year avg: 8.1%) outperformed the Modi Govt (Avg 7.3%) .
The UPA also delivered the ONLY instance of double digit annual growth in modern Indian history. pic.twitter.com/33Qt9x8YZSDK Joshi, chief economist at CRISIL, explained that various factors go into determining GDP growth. For instance, growth-supportive policies in the years following the global financial crisis would have pushed GDP growth.
You must take into consideration that after the Lehman crisis, several good monetary and fiscal policies were implemented. At other times, growth has benefited from favorable macro-economic factors. The effect of demonetisation and GST are also factored into later figures. All of these have a significant bearing on the trend.DK Joshi, Chief Economist, CRISILCommenting on the broader trend of differences between the old series and the new series of GDP data, Joshi said that the divergence wasn't as wide as feared.
“Yes, the new base has led to about 40 odd basis points upswing in GDP. However, there was criticism that the new methodology was responsible for growth having gone up by 2 percent or so, which is clearly not the case,” he said.
Essential Business Intelligence, Continuous LIVE TV, Sharp Market Insights, Practical Personal Finance Advice and Latest Stories — On NDTV Profit.


