Diversified FMCG • Large Cap
Hindustan Unilever Ltd.
₹1,864.60▲ 6.40 (0.34%)
Data is being fetched with a 2 min delay
Prev. Close₹1,858.20▲ 0.34%
Open₹1,858.00▲ 0.36%
Performance
LowHigh
1,840.401,865.50
52W Low52W High
1,758.202,488.00
Turnover₹297.85 Cr
Volume Traded15.97L
P/E Ratio42.17
Market Cap₹6.06 Lakh Cr
Avg. Volume15.51L
Stories & Reports
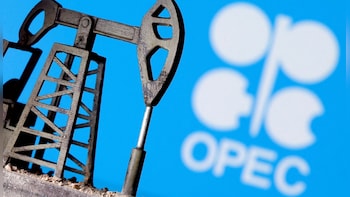
Q2 Results Today: Full List Of Companies Declaring Quarterly Results On Nov. 2 OPEC+ Retains December Oil Output Target Amid Iran War Disruptions: Why 2027 Quota Matters
 Trade Setup For Nov. 2: Nifty Eyes Resistance At 23,200; Can Bulls Push Index Above 24,000?
 IPO Buzz: BLS Polymers, Four Other Companies To Get Listed On BSE. NSE This Week - Check Dates
 The Week Ahead: Q2 Earnings, PMI Data, US Jobs Report, IPO Listings In Focus
 FPIs Pull Out Rs 34,843 Crore From Equities In October; Turn Net Buyers Last Week

V/S
Hindustan Unilever Ltd.+6.40 (0.34%)NIFTY 50+116.35 (0.51%)
Announcements
Copy of Newspaper Publication regarding notice of declaration of interim dividend and payment date.
View Full DocHindustan Unilever Ltd. Share Price
As of 2 November 2026, Hindustan Unilever Ltd. share price is ₹1,864.60. The stock opened at ₹1,858.00, compared to its previous close of ₹1,858.20. During today's trading session, Hindustan Unilever Ltd. share price moved in the range of ₹1,840.40 to ₹1,865.50.
Looking at its last 52-week performance, the stock has touched a low of ₹1,758.20 and a high of ₹2,488.00. On the performance front, Hindustan Unilever Ltd. share price is down 24.50% on a year-on-year basis.
The market capitalization of Hindustan Unilever Ltd. is ₹6.06 Lakh Cr, with a P/E ratio of 42.17.
Moving Averages
50 Day(s)
-2.83%1,918.92
100 Day(s)
-8.03%2,027.38
200 Day(s)
-12.98%2,142.76

Join our Official Channels