


One day flat, two days up and then two days down – that is the summation of what happened during the week just ended. What can we do with this information? Just about nothing. But writing in last week's letter, I had stated that, for the short-term guys, the Rubicon was at 25,200 and that proved difficult for them to cross with the mild rally attempts.
And that, set the stage for the Nifty 50's decline below 24,850 level, as it closed at the lowest point for the week. It made for a weak candle for the week and we have now traded down to the lows of the 23rd June candle (which was the upthrust candle) but not broken it yet.
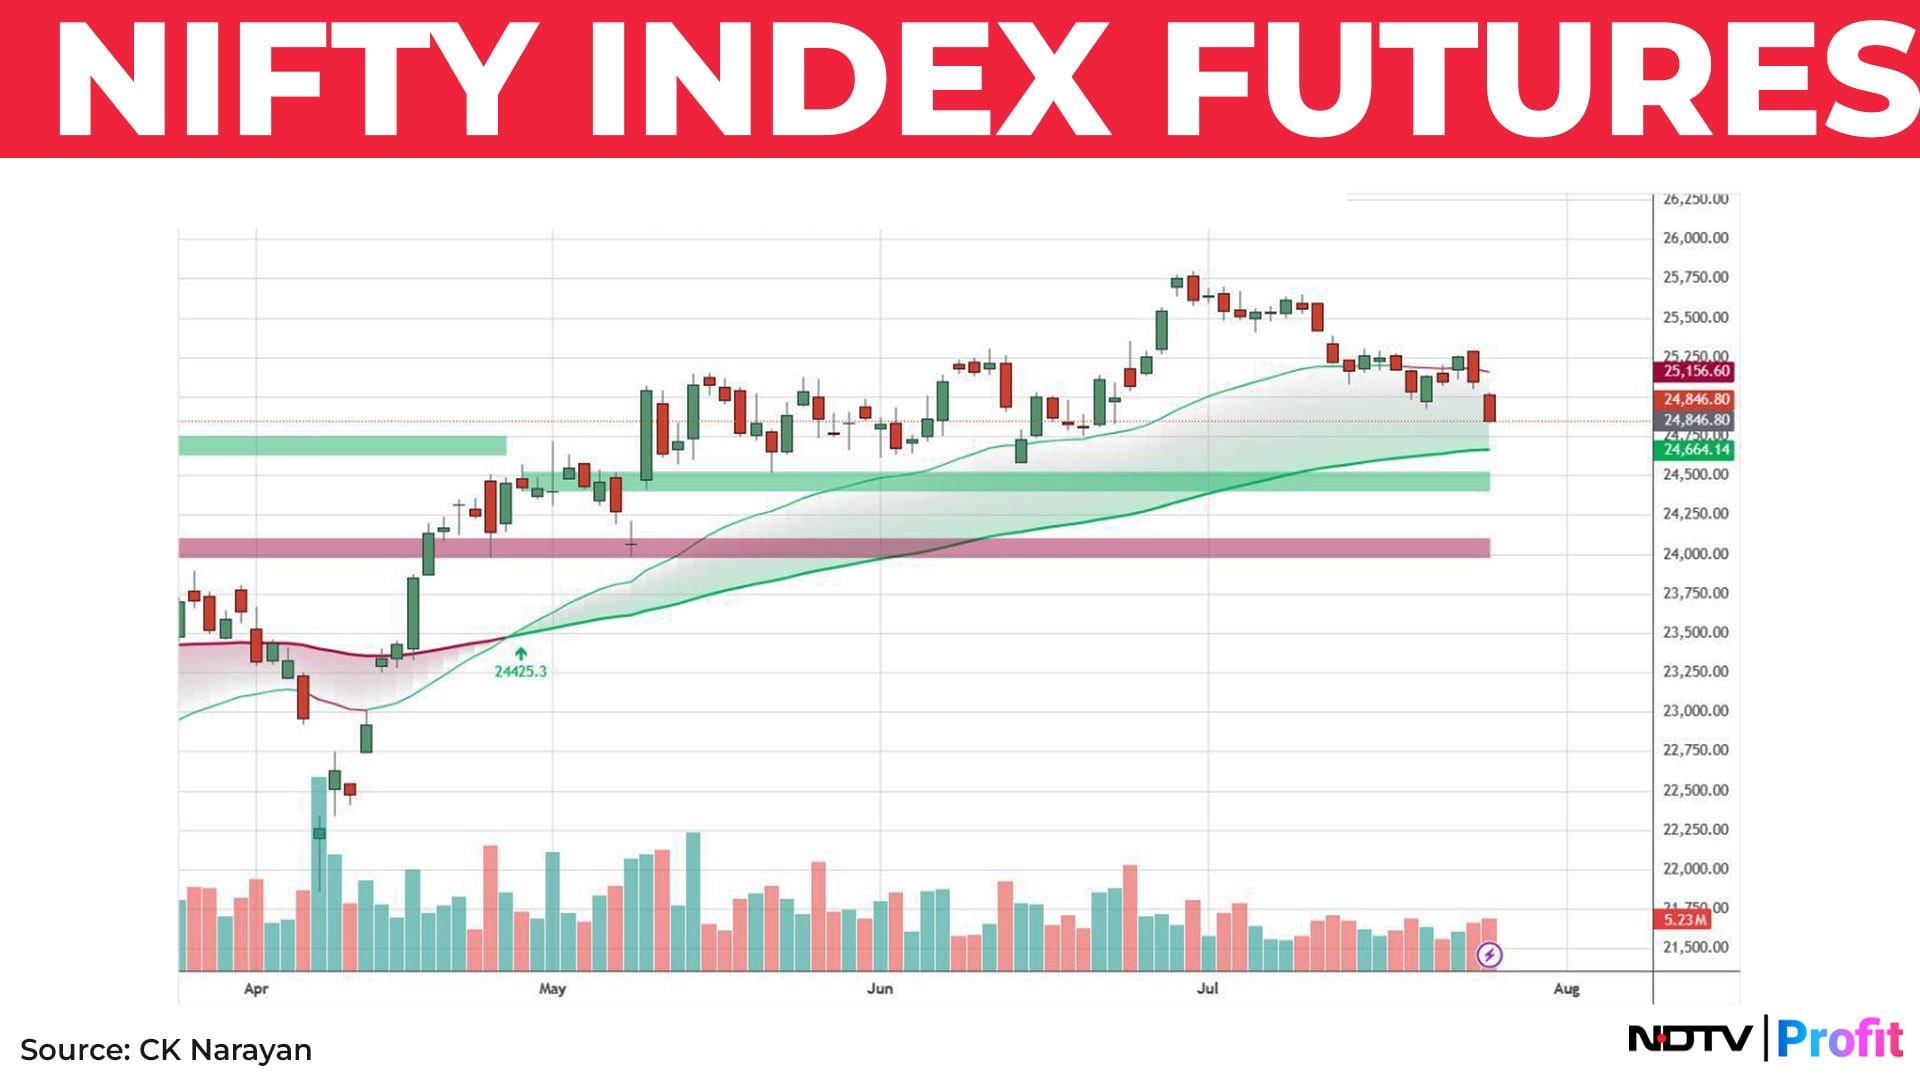
Chart 1 is the continuation of the same one shown last week. As discussed last time, the main trend is still up even as the smaller trend is shedding ground. The only way to play this is to short weak stocks if you are into the short term.
Those trades are the ones that have delivered. For the swing trader or positional player, it has been a waiting game, waiting for the market or some stock to come into the right price area. But that is a patience game. Not the long suit of many.
On one hand, a typical trader will want to know what is the strong support. But when asked to wait for that to come so that he can buy, the trader finds that wait very difficult. But give him a trade on a breakout and he will jump on it right away! Everyone wants immediate gratification, you see. That is at the heart of it.
Speaking of macro-economic factors, US President Donald Trump is really stretching out the trade deal talks with India. Guess both sides are playing a staring game, watching who will blink first? During that period, the market is developing some hives.
Most markets where deals have been done have rallied (Indonesia, Japan, Singapore, UK etc.) and we could do that too. But the deal is still elusive. In the meanwhile, Trump's statement relating to IT hiring and visa issues are really not helping the matters.
Why did the market fell so badly on Friday? I feel it is because of some extrapolations that have happened suddenly. The market has really been held up by banks and financials. We found that many of the bank results we saw this week were all reporting large treasury gains and not from good banking operations.
When Bajaj Finance didn't really carry the day, people took a read that if the main sector is unable to carry the weight of the index, then the markets may be in some trouble. Add to this melee, the poor results from (or rather poor reception to) IT stocks. Together, the stress became a bit much and the prices caved.
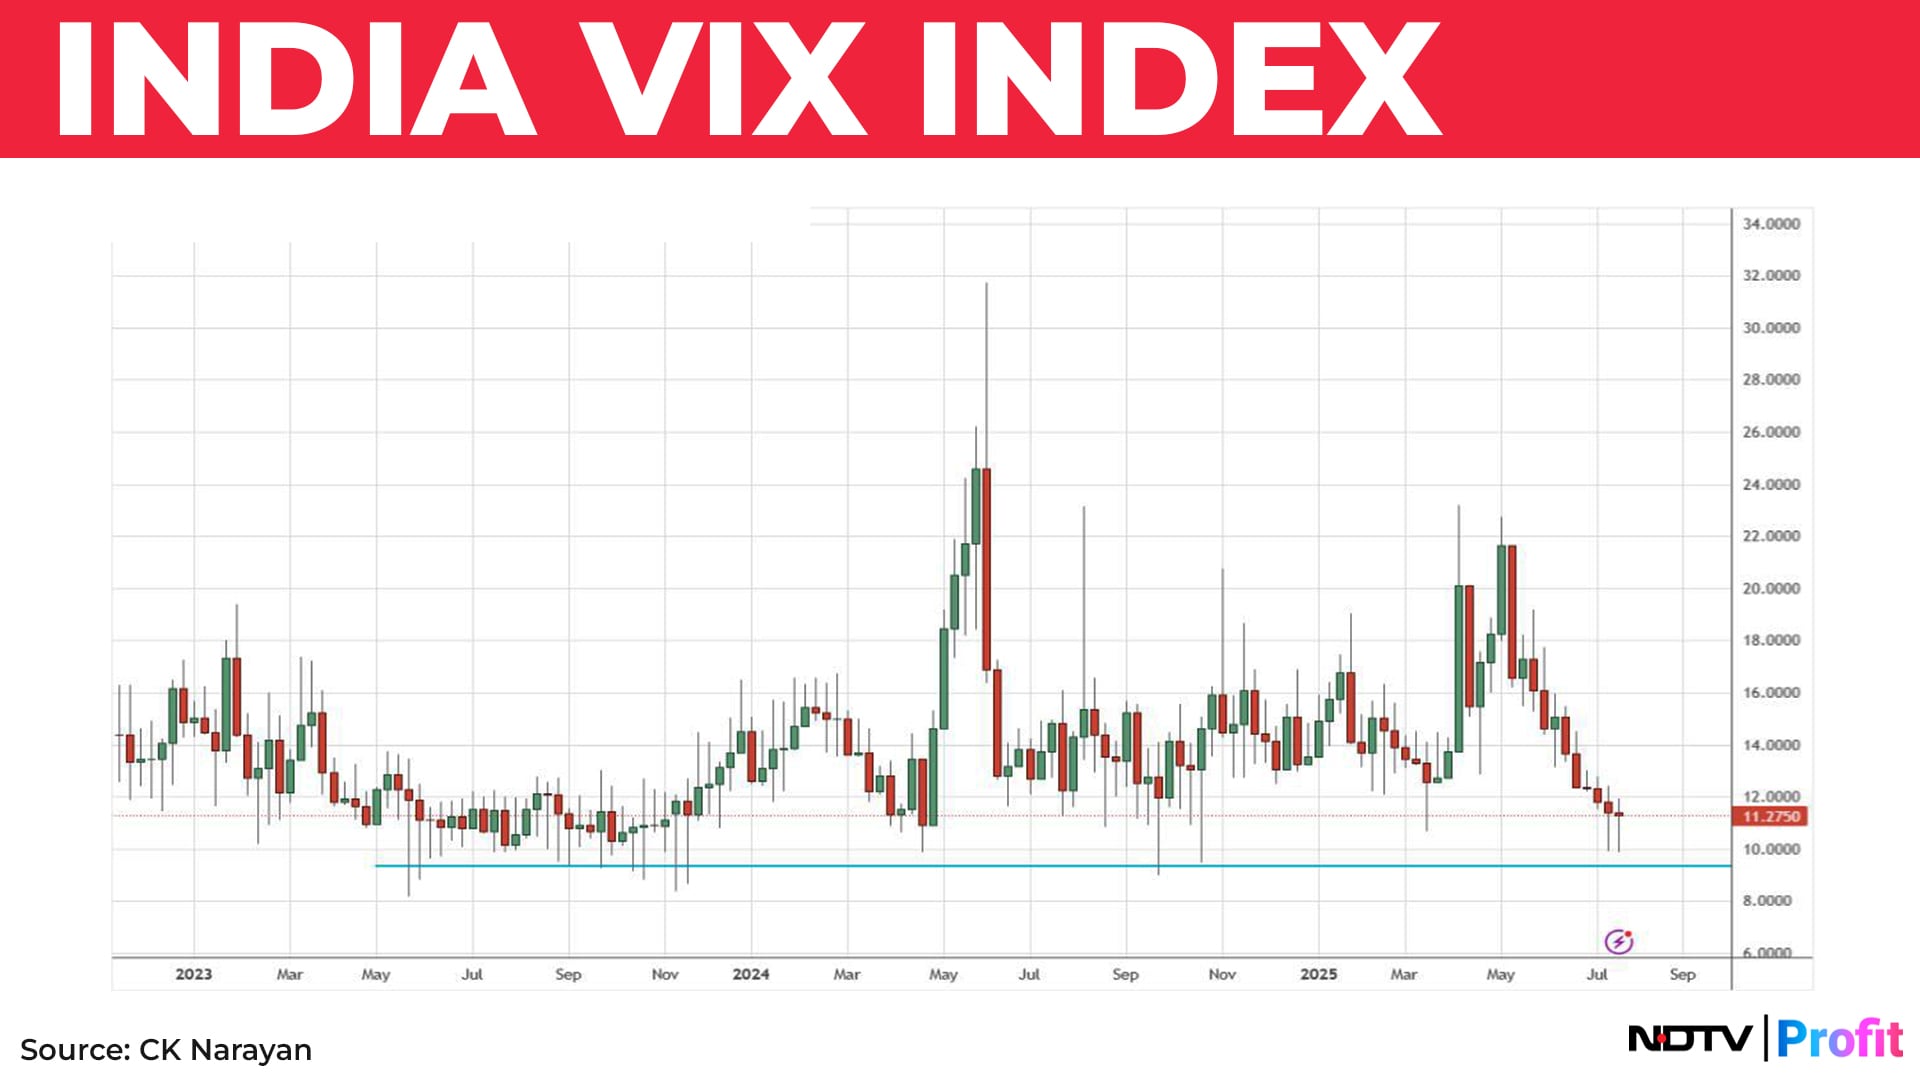
Chart 2 shown is IndiaVix. It has reached lows seen a couple of years ago. On the face of it, this would seem like options players would turn buyers but no, this is not happening. The slow grind of prices is still delivering profits for option sellers.
The absence of, or failure to sustain rallies, is leading to long positions not giving returns so traders are being forced to short. Somewhere, this will blow up on their faces. But until then, enjoy the ride is all that can be said.
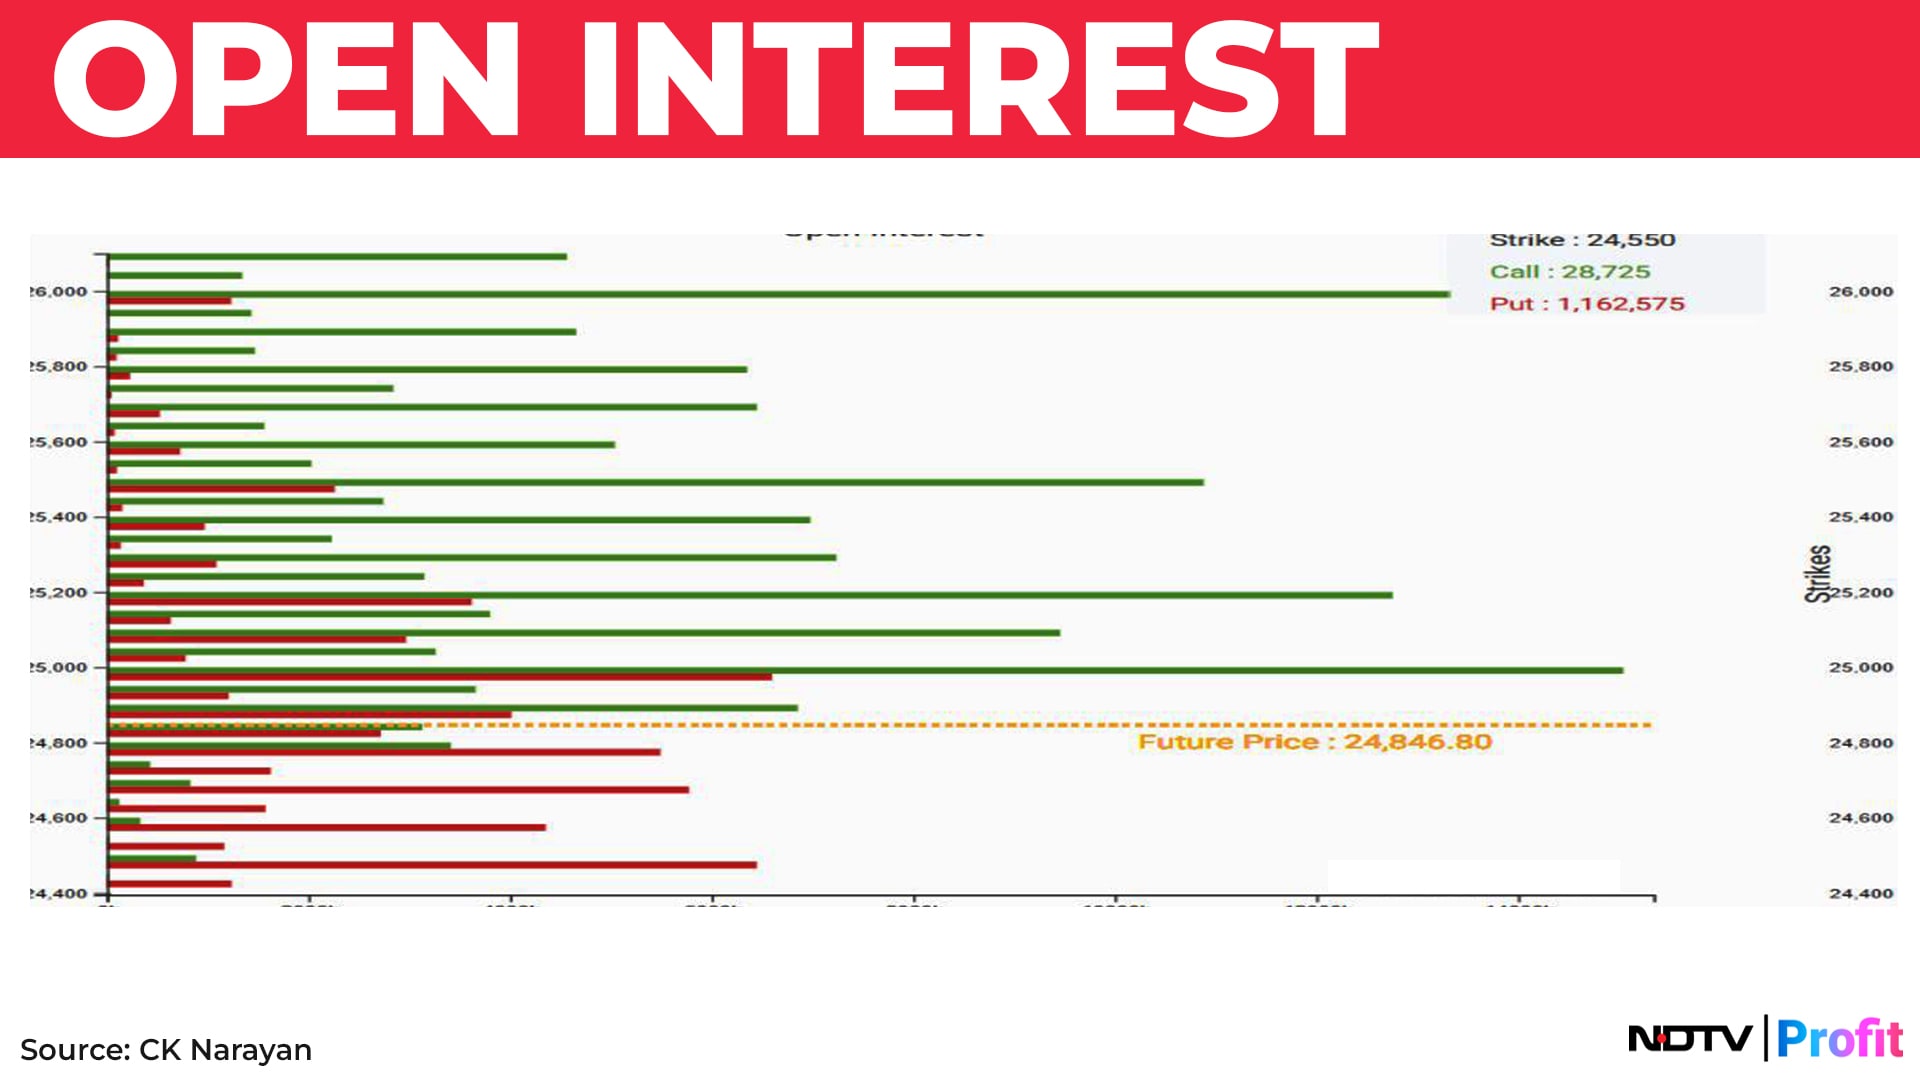
The options positions show a surfeit of call shorts, making upside movements in the next week to be quite an effort. It will really need some big news flow for prices to move through all that resistance. Maybe the Trump deal can do it (if favourable) but barring that I don't see anything else for now. Bank Nifty situation is not dissimilar.
Hence, the default short term setting for the week ahead is for continued bearishness or resistance at higher levels. Chart 3 shows the surfeit of call shorts above the current price levels. Note that we can't really see much of Put shorts beneath the current price to offer supports for declines.
Now that the Nifty is attacking the lower support of recent times, we need to check what is possible if it goes down further.
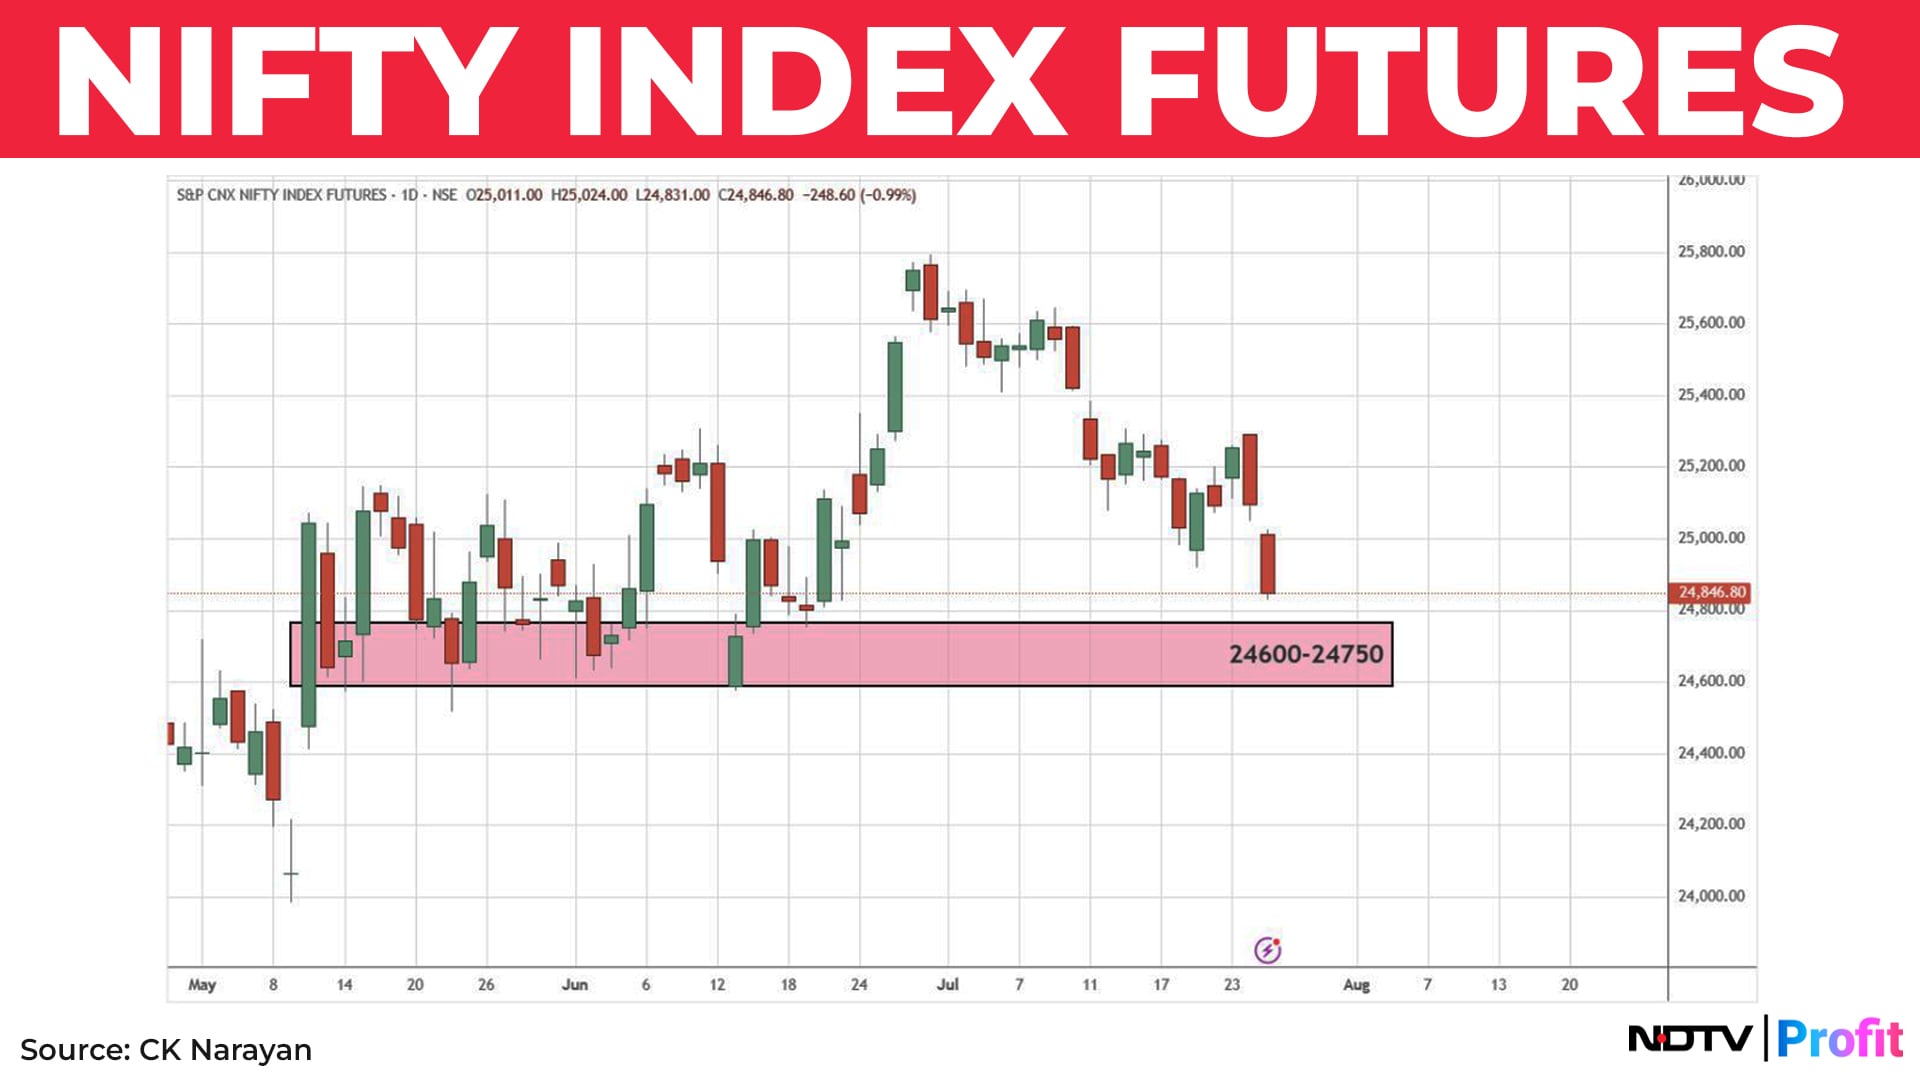
Chart 4 shows the next cluster of prices for the Nifty to negotiate past lying between 24,600-24,750 area. This may not seem like much from where we are currently but note that market is, kind of, in a habit to rally for a couple of days and then go down for a few. If it keeps up with that, then that target is far enough to accommodate a week more!
There is no turn date seen immediately. There is one small one around July 28 but a bigger one is seen around Aug. 7. So, it seems like the market needs to spend time than to seek out price moves. Hence two-way moves are quite likely. The trading action has to continue like before – selling rallies and buying dips.
Results flow so far has been mixed. For sure, nothing has lit up the Street. In the NSE 500, among the results declared, 89 have positive profit growth versus 40 with negative profit growth. Now, that is not a bad number but the leading stocks have not created a big impression.
However, many more are yet to go, so the market may still be on guard, watching the results flow, seeking direction from there or drawing conclusions of which way the wind blows. So, as stated in earlier columns, we have to continue to follow a stock specific action.
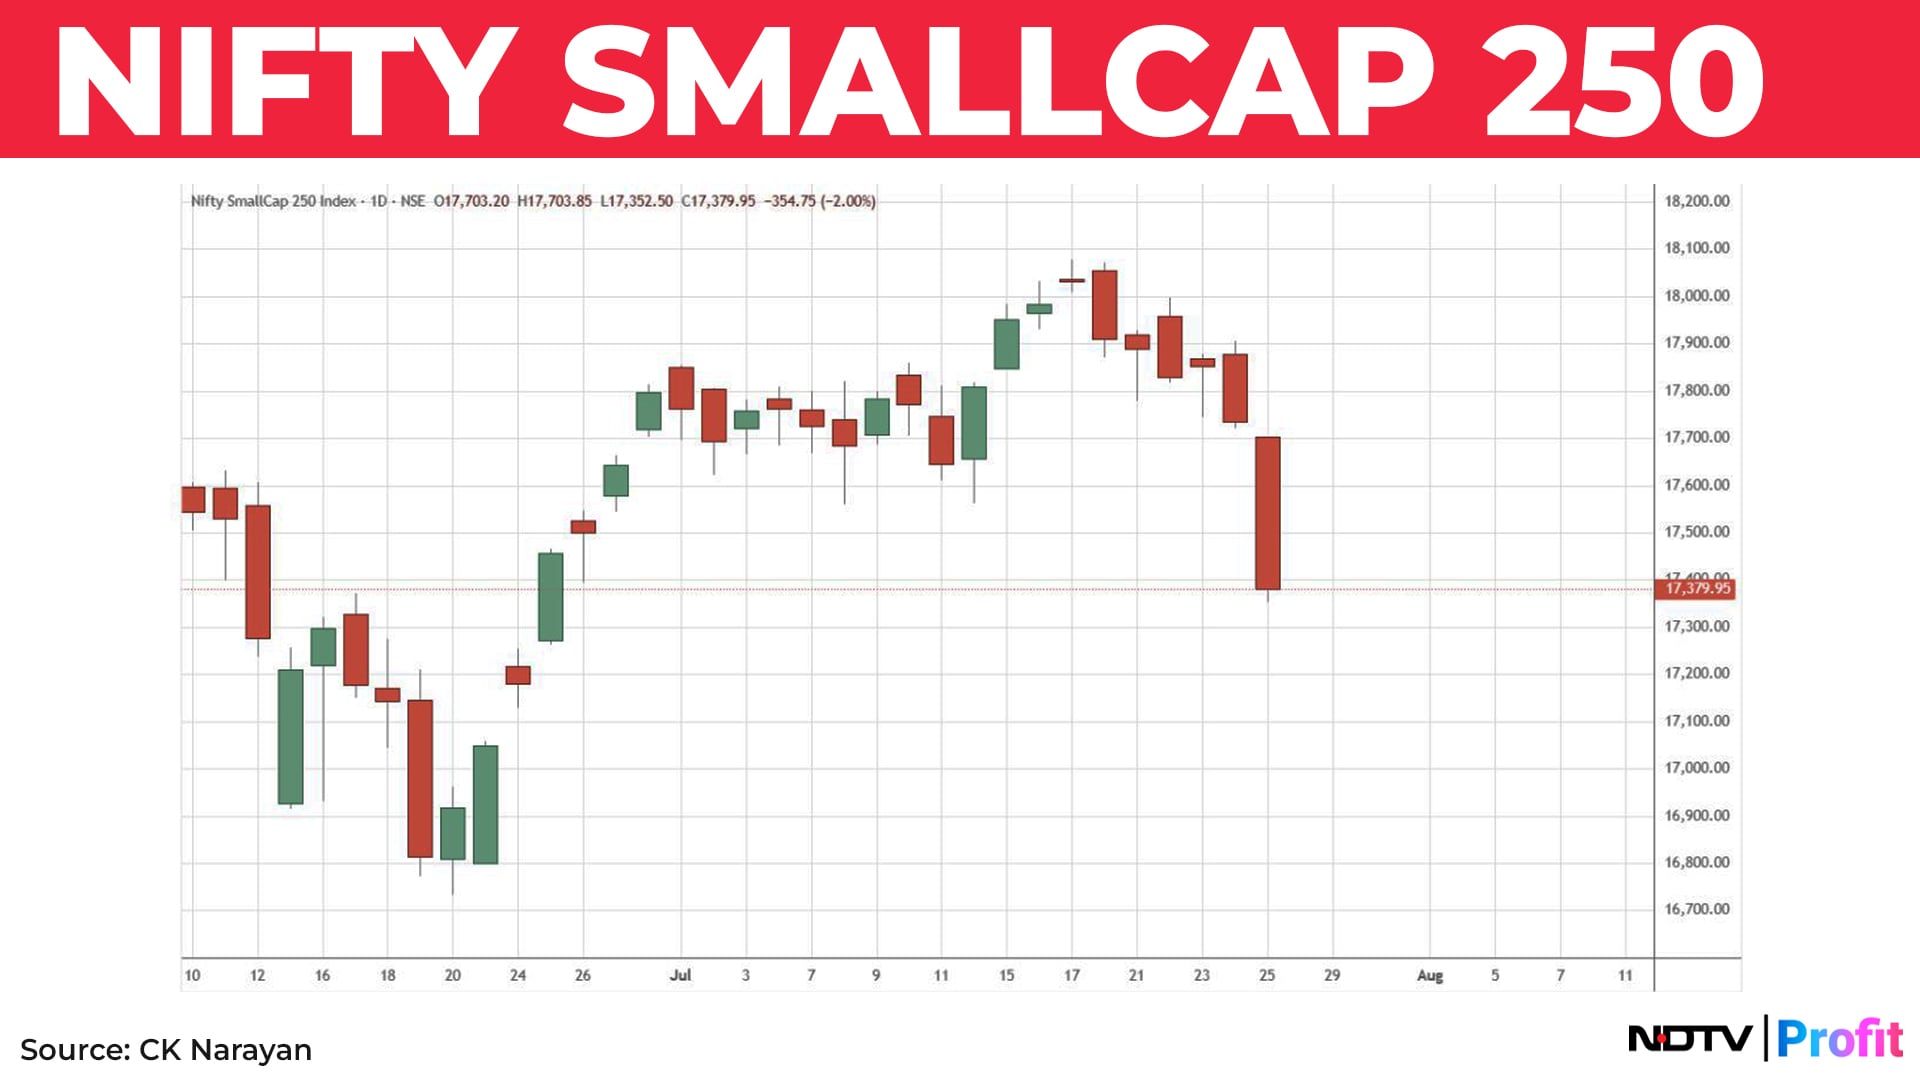
One more reason for some discomfort with the current decline is that the small cap index was sliding. The rally, that began here from June 20, had moved rather nicely, holding its levels even during the periods when the large caps faltered in between.
The rally seems to have peaked finally on July 17 and since then we see a slide, which extended big on Friday. Chart 5 shows the Smallcap 250. It looks like there could be some more room to the downside before it meets up with some supports. But given the wide selection of sectors that fall within this space, playing stock specific moves may still be possible.
Pharma stocks were among the few that held their own. However, I really wouldn't want to run out there to buy them since most of them have an export element, and as long as Trump is aggressive with his trade policy, there is no guarantee that he will not take a swipe at this sector too.
To sum up, the market is still in small moves, with frequent to and fro action, making steady investments or swing trades difficult. Day trading would be best, if it is your cup of tea. Stock-specific action is still the way to go with option trading preferred for index traders.
Essential Business Intelligence, Continuous LIVE TV, Sharp Market Insights, Practical Personal Finance Advice and Latest Stories — On NDTV Profit.


