


India's equity benchmark Nifty 50 index's correction may be coming to an end, according to a technical indicator. The index has declined nearly 3 percent so far this year and over 9 percent from its January 29 peak until yesterday.
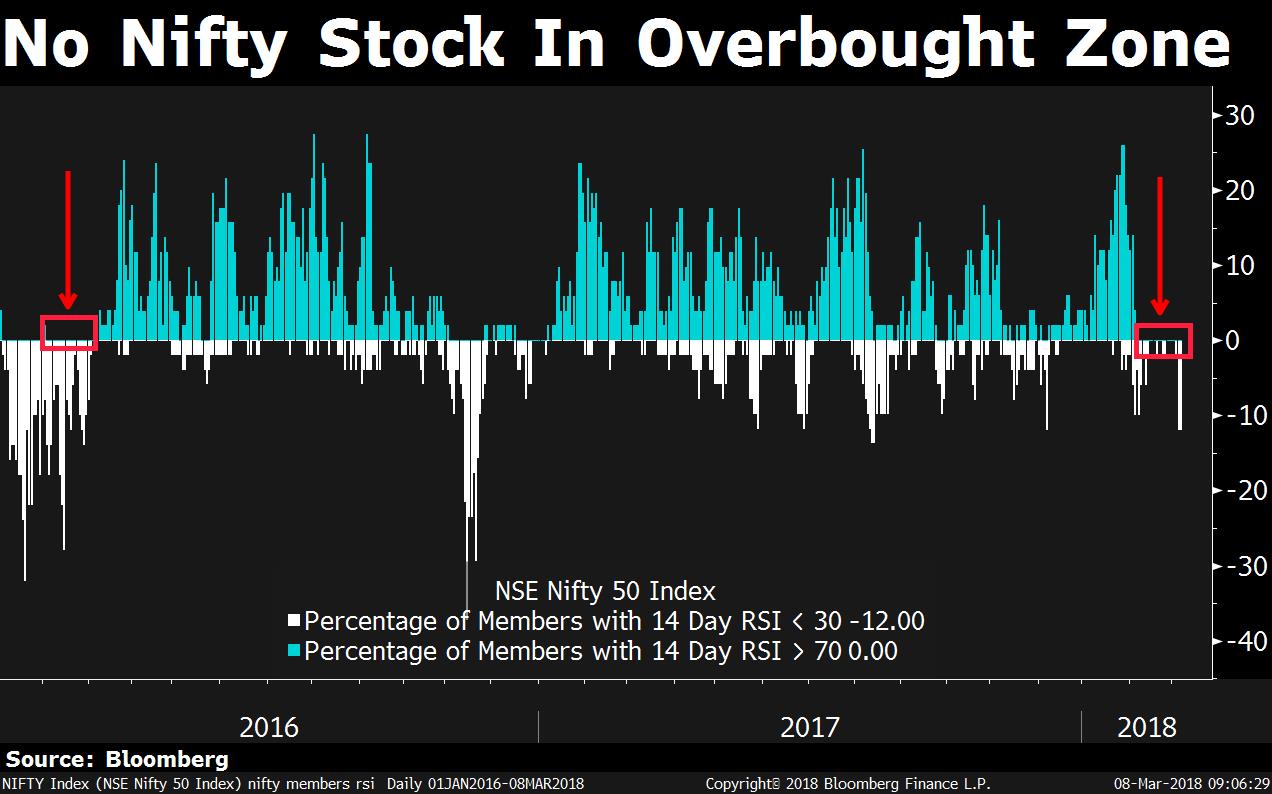
The Relative Strength Index or RSI, which measures the momentum behind price moves and helps in identifying overbought and oversold levels, shows that none of the 50 Nifty stocks have been overbought for 20 sessions in a row till yesterday.
On the other hand, 12 percent of the stocks out of 50 were oversold for two days in a row, which was the highest since December last year.
It is more important to focus on the oversold condition, said Mukesh Singh, head of technical analysis at Nila Financial Services. “Even a three-day consecutive oversold reading in majority of the stocks will be a clincher for a short-term low,” he added.
Also Read: Mid- And Small-Cap Stocks Lead The Fall
Essential Business Intelligence, Continuous LIVE TV, Sharp Market Insights, Practical Personal Finance Advice and Latest Stories — On NDTV Profit.


