


When playing the markets, particularly with trading, it would be wise to remember, always, one of the statements made by Elon Musk. ‘Success is one of the possible outcomes', he said, talking about one of his ventures.
I find that particularly appropriate as one of the aphorisms for the stock market. You see, as an analyst, there is always a tendency to think that you know more, and therefore the danger of becoming needlessly overconfident. One of the biggest enemies of a market participant is overconfidence. Sadly, we are all victims of it but I think analysts, in particular, are more prone to it. For them, unfortunately, their very being is defined by having to be confident about their own forecasts.
The reason I say all this is because March has probably been one of the best months for many a market player. After October 2021, it is probably the month where money-making was not only easy but also plentiful. This, I gather, has been the scenario for most traders and investors are happy as well because their portfolios looked up nicely too. So, it is very easy to have become somewhat overconfident about our own abilities or complacent about the market.
It is at such times that the market devil takes over and yanks the carpet from under your chair. Many may have experienced that already in the latter part of this week.
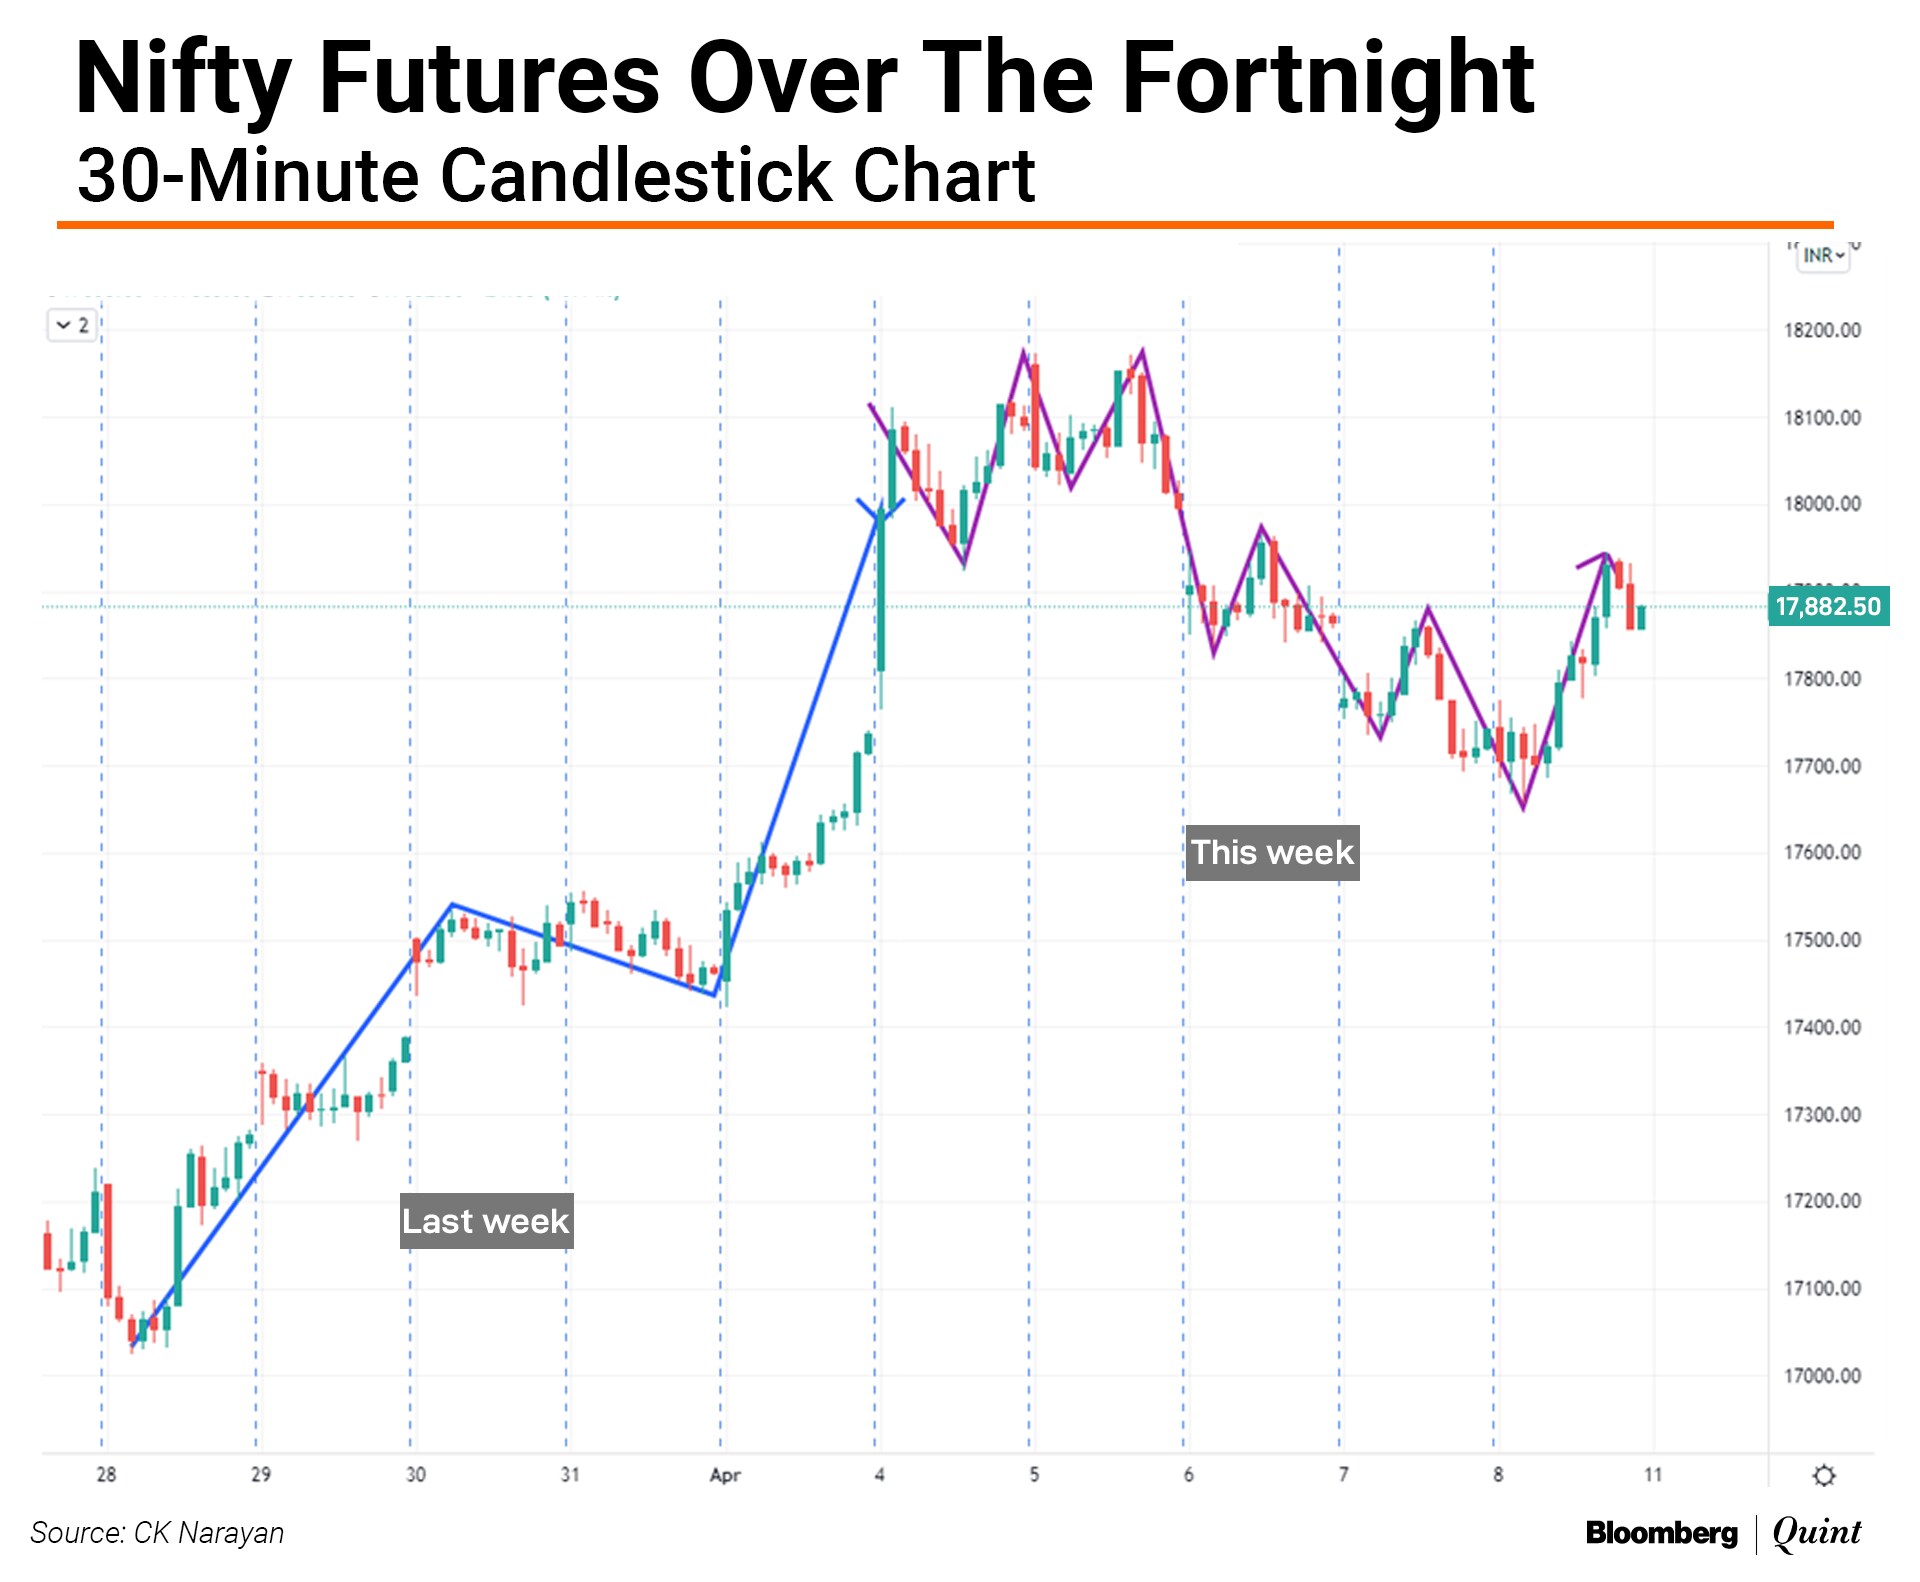
The first chart, as ever, shows the way the market moved in the week just ended. Not exactly a walk in the park, was it?
Contrast this with the smooth movement in the week before and you will know what I mean. When you take such a drunken walk and mix that up with the high confidence of a drunk, it becomes a pretty potent mix. Chances are that you held your longs a bit longer than necessary and didn't really bother to hedge or short. That is because your recent experience has been a satisfying one, deploying a buying strategy. And for all those newbies (who might have been reeling of late), buy the dips started to work again. Mix it in with FIIs turning buyers (gasp, when was the last time that was so, I have almost forgotten), and the confidence just got tipped into the ‘over' territory.
Okay, so what do we do about it?
Best to take a step back and look at the bigger picture. Here it is, in the second chart.
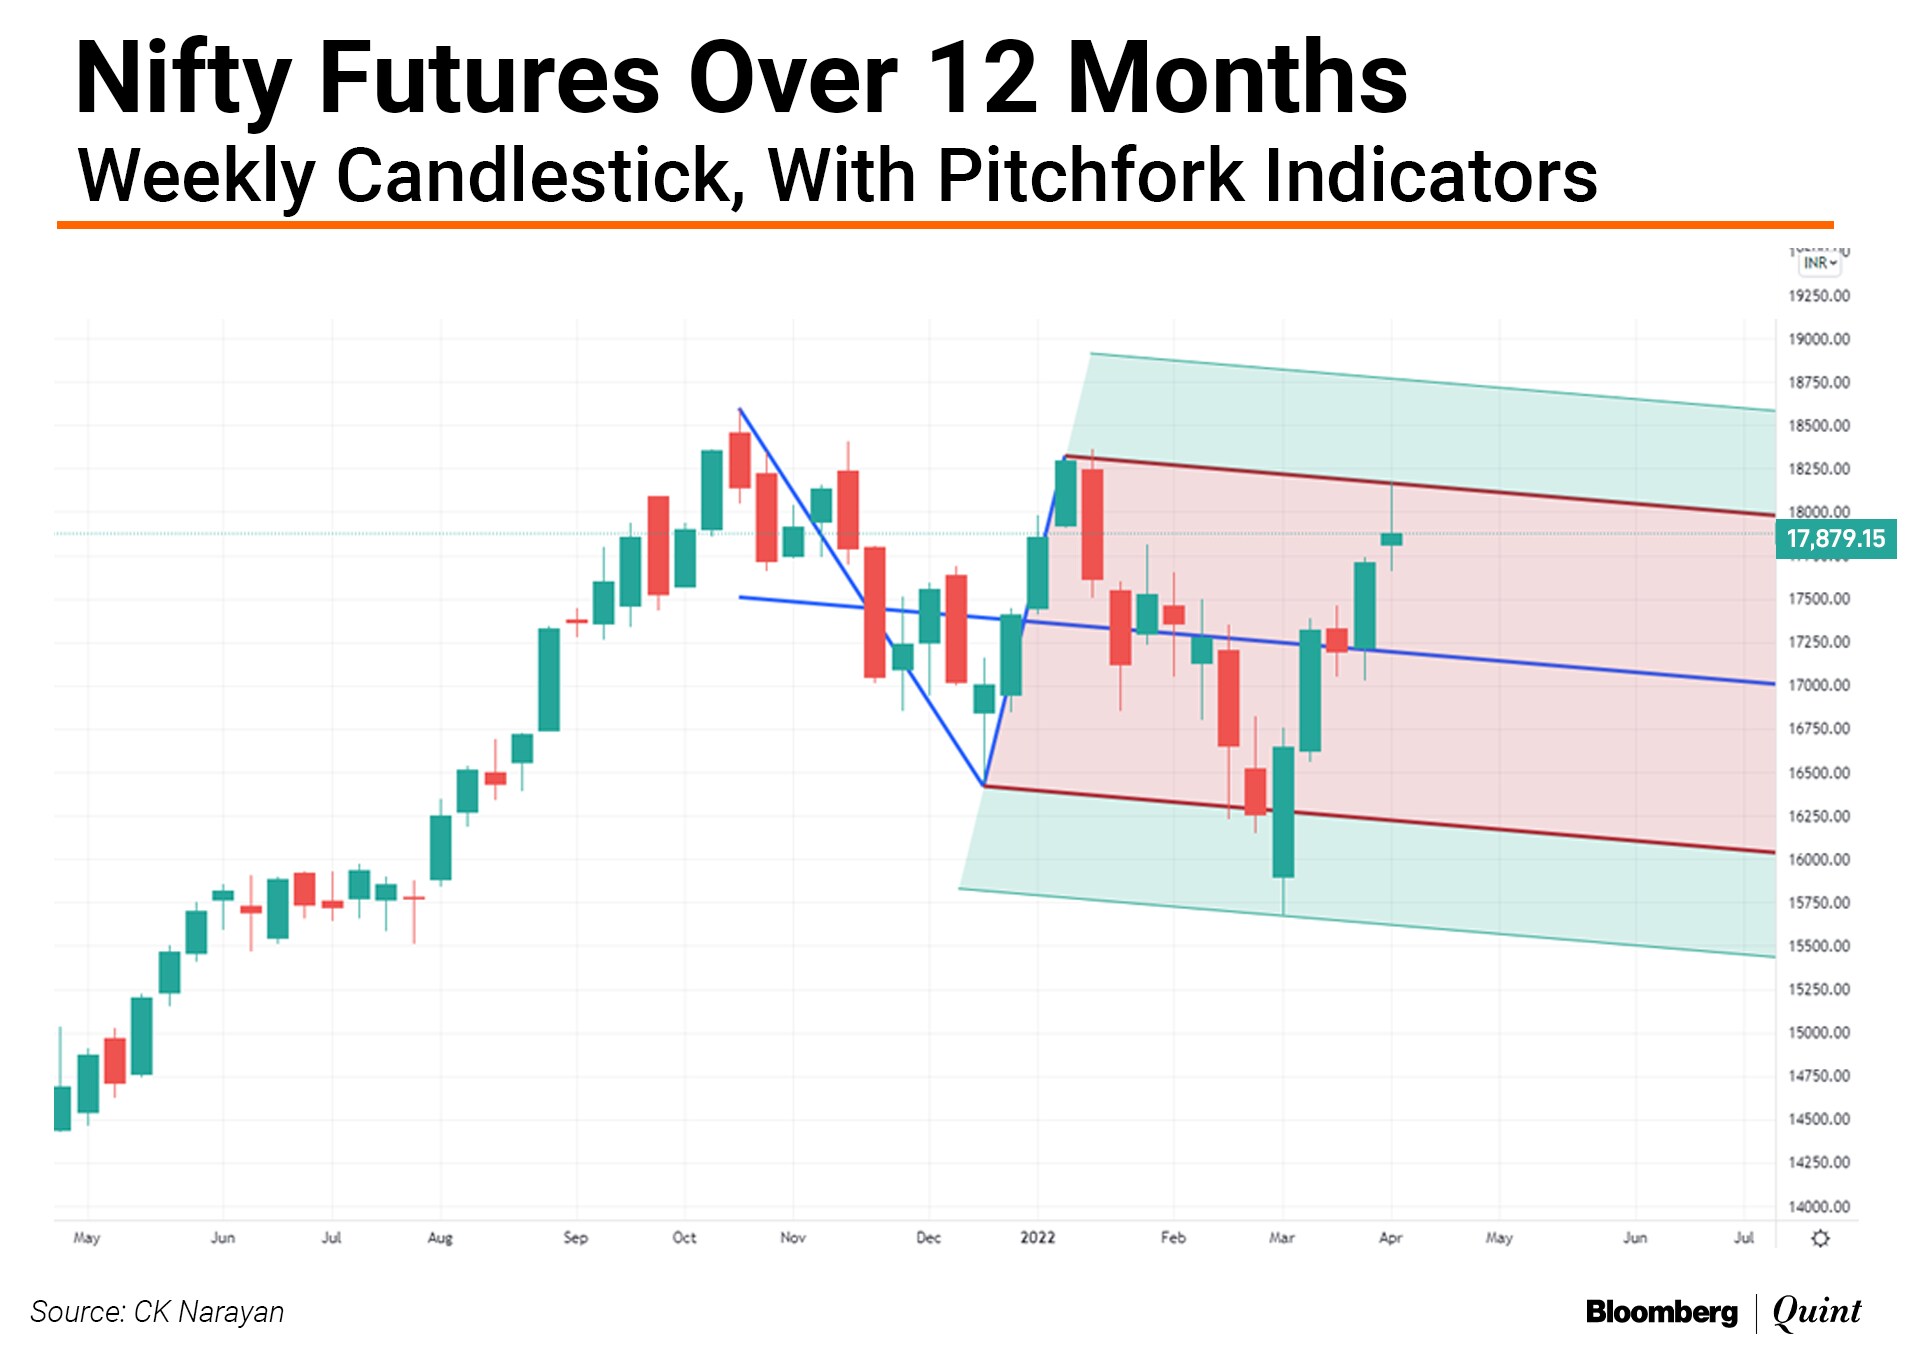
Featured is the weekly chart of the Nifty with a Schiff pitchfork channel that seems to be holding the recent moves together. I have had to expand the boundaries a bit to provide for the extra downward volatility in March. The Schiff variant applied because recent moves have all been overlapping ones.
We note that prices had moved to the top channel and developed a bit of softness.
Now, that is a bit more than what most people are ready to settle for right now. Please note that I am not calling for it, just revealing the market mindset with one of the possibilities.
I want to revisit that Musk comment that I started the article with— success is one of the possibilities. In the same way, resumption of the upside is one of the possibilities. When you say ‘one of the' then you also have to speak about the other possibilities. This is why I mentioned the deeper, lower end that most of us don't expect have (or want?) right now.
Stepping down to the daily chart with some oscillators, as shown in the next chart, we have something to cheer for.
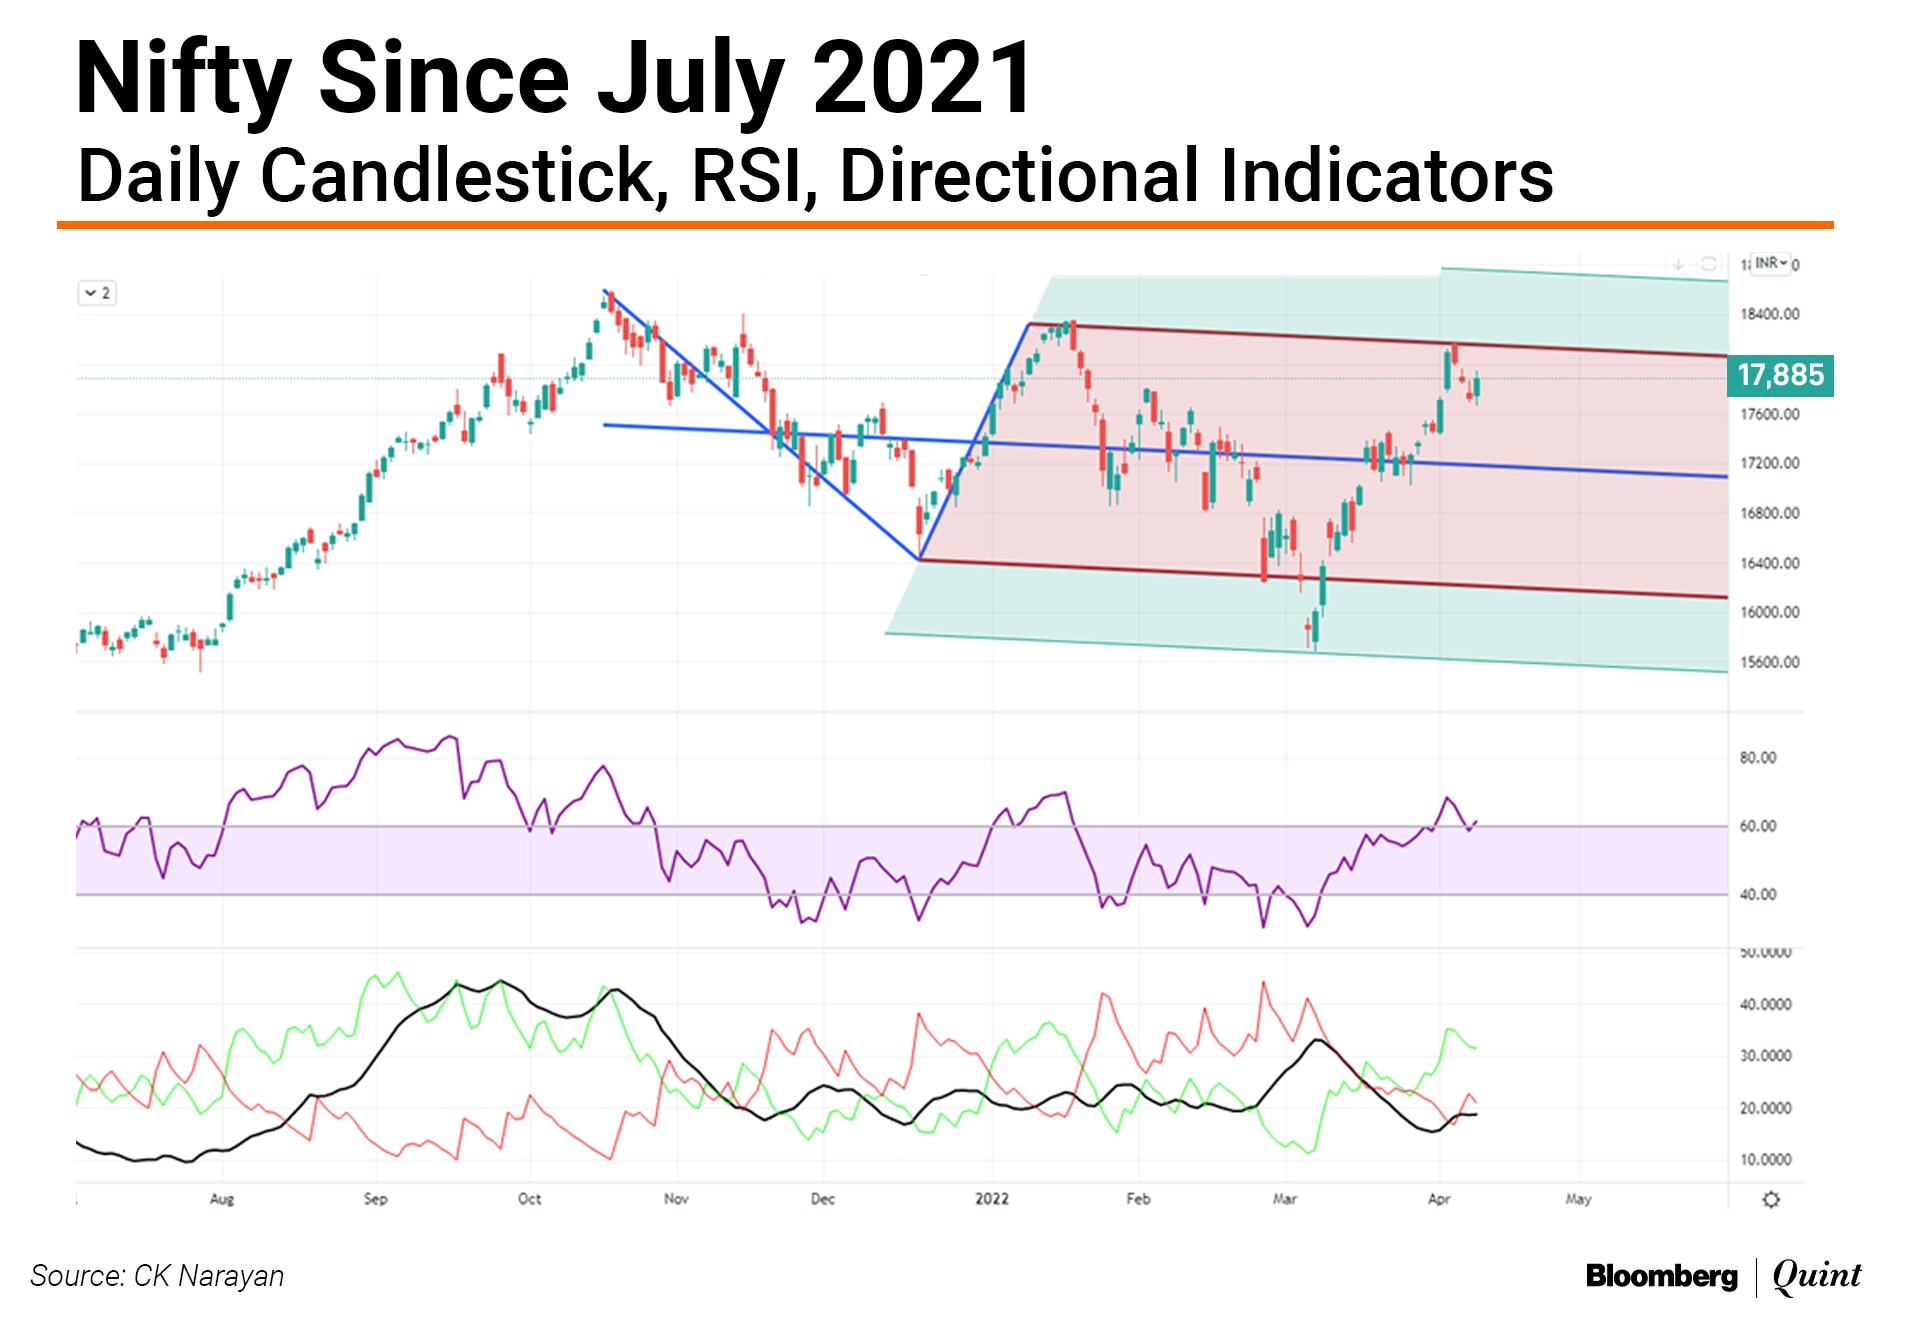
The RSI made it to a nice, swing high with no divergence created. The Directional Indicator lines also turned positive, although dominance was not established. The bullish among us would say, let's not nitpick, and want to concentrate on the bullish signals. If there are many outcomes possible for the market just now, then complacency about the trend direction should not be one of them. We must take in the contra information so as to be prepared if the market does something else.
That the RSI has no divergence at its current end doesn't mean there shall not be a pullback. All it means is that there will be another pullback to the highs ahead.
Ditto with the DI lines set up. So, seen from that angle, the next dip will still be another buying opportunity.
So, if there is to be a pullback, can we define some support areas?
A pitchfork with the more recent pivots would have its median line around 16,800 levels. We also have a gap from the past in that area. The Ichimoku cloud on the weekly chart is placed there too. So, for now, we can assume that the fall if any, can get arrested around the 16,800-17,100 area. If readers recall, the stop given in the last week's column was around this very zone. It is another matter that the market rose substantially to give us good profits (if you bought lower as had been suggested) that could have been locked in. However, if one missed that opportunity and held out for more, then the stop zone continues to be the same area.
Should we expect another such attempt? The market is not famous for rewarding every ambitious view with success. Again, like Musk said, success is one of the possibilities. For it to occur the index needs to hold above the levels mentioned and then make haste to move higher.
Helping matters along could be quarterly earnings that will start flowing from mid-month. There are expectations of strong performance only in select pockets because inflation and other price rise pressures are expected to have a dampening impact on Q4 FY22 earnings. Wherever there shall be a surprise, the rewards may be out of proportion too. Chances, therefore, are that the market may slip into some sideways price action as it awaits the denouement of the results circus.
In this context, the move of the Nifty Alpha 50 Index to new highs is interesting.
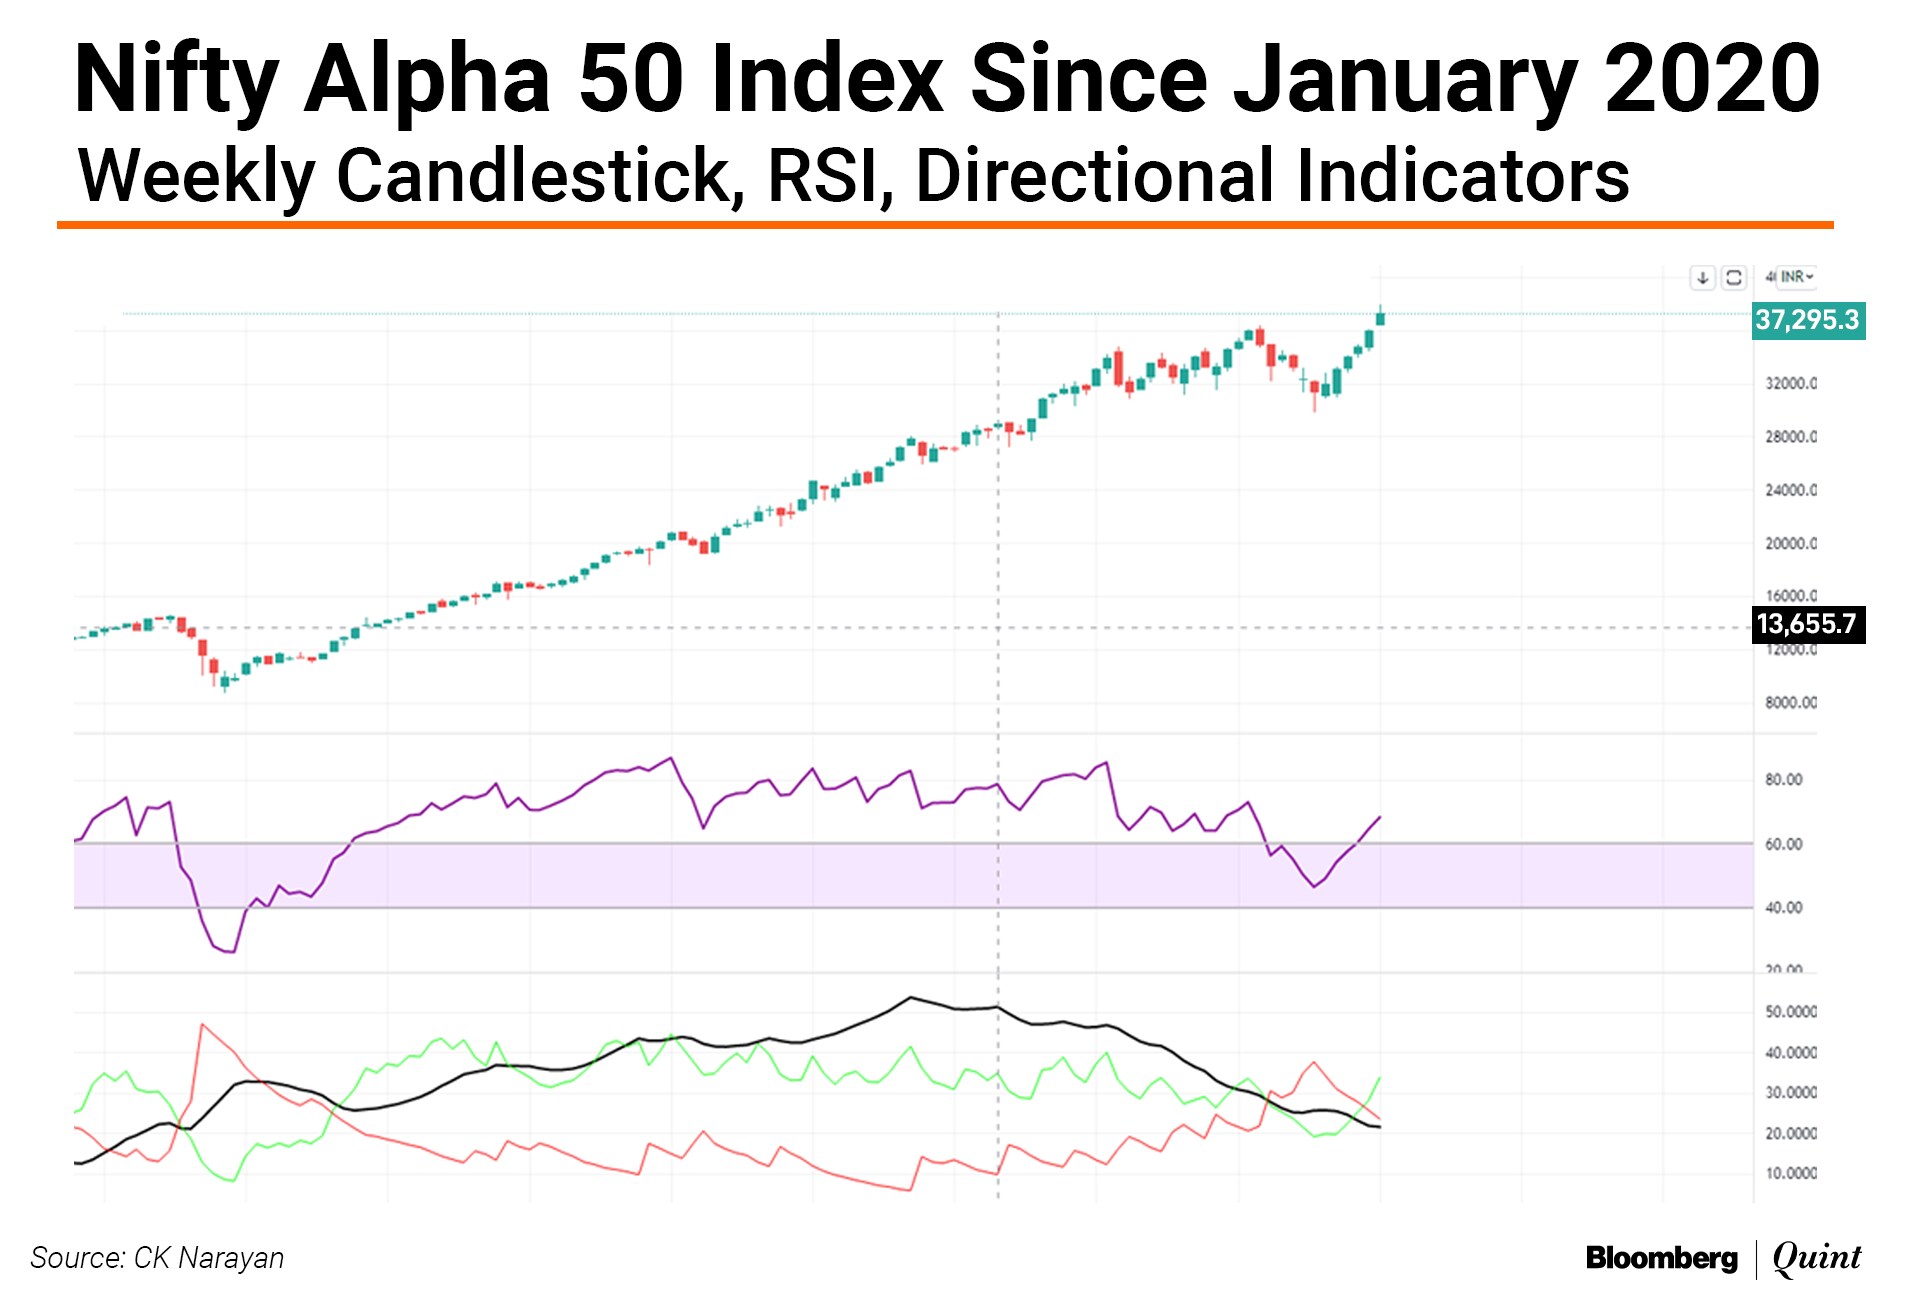
It continues to show that there are a bunch of stocks where money is still pouring in and where the market still seems to have plenty of faith in the future. The midcap and small-cap indices are more or less aligned to the Nifty and do not hold out anything special or additional.
So, we round up this week's commentary with the conclusion that the trends look a bit mixed and there may be a pullback. But this is expected to curtail in the recent support zone defined in the area of 16,800-17,100. Hence, with a stop placed in that zone, one could go long afresh or continue with former longs. Action may shift to the mid and small-cap space as results flow may tip the scales towards a stock-specific market.
CK Narayan is an expert in technical analysis; founder of Growth Avenues, Chartadvise, and NeoTrader; and chief investment officer of Plus Delta Portfolios.
The views expressed here are those of the author, and do not necessarily represent the views of BloombergQuint or its editorial team.
Essential Business Intelligence, Continuous LIVE TV, Sharp Market Insights, Practical Personal Finance Advice and Latest Stories — On NDTV Profit.


