


A couple of weeks ago I had shown this chart with two pitchforks. At the time, it had seemed difficult that the prices would come down to breach the lower channel of the bigger picture. But that is now on the verge of happening (See chart 1 below).
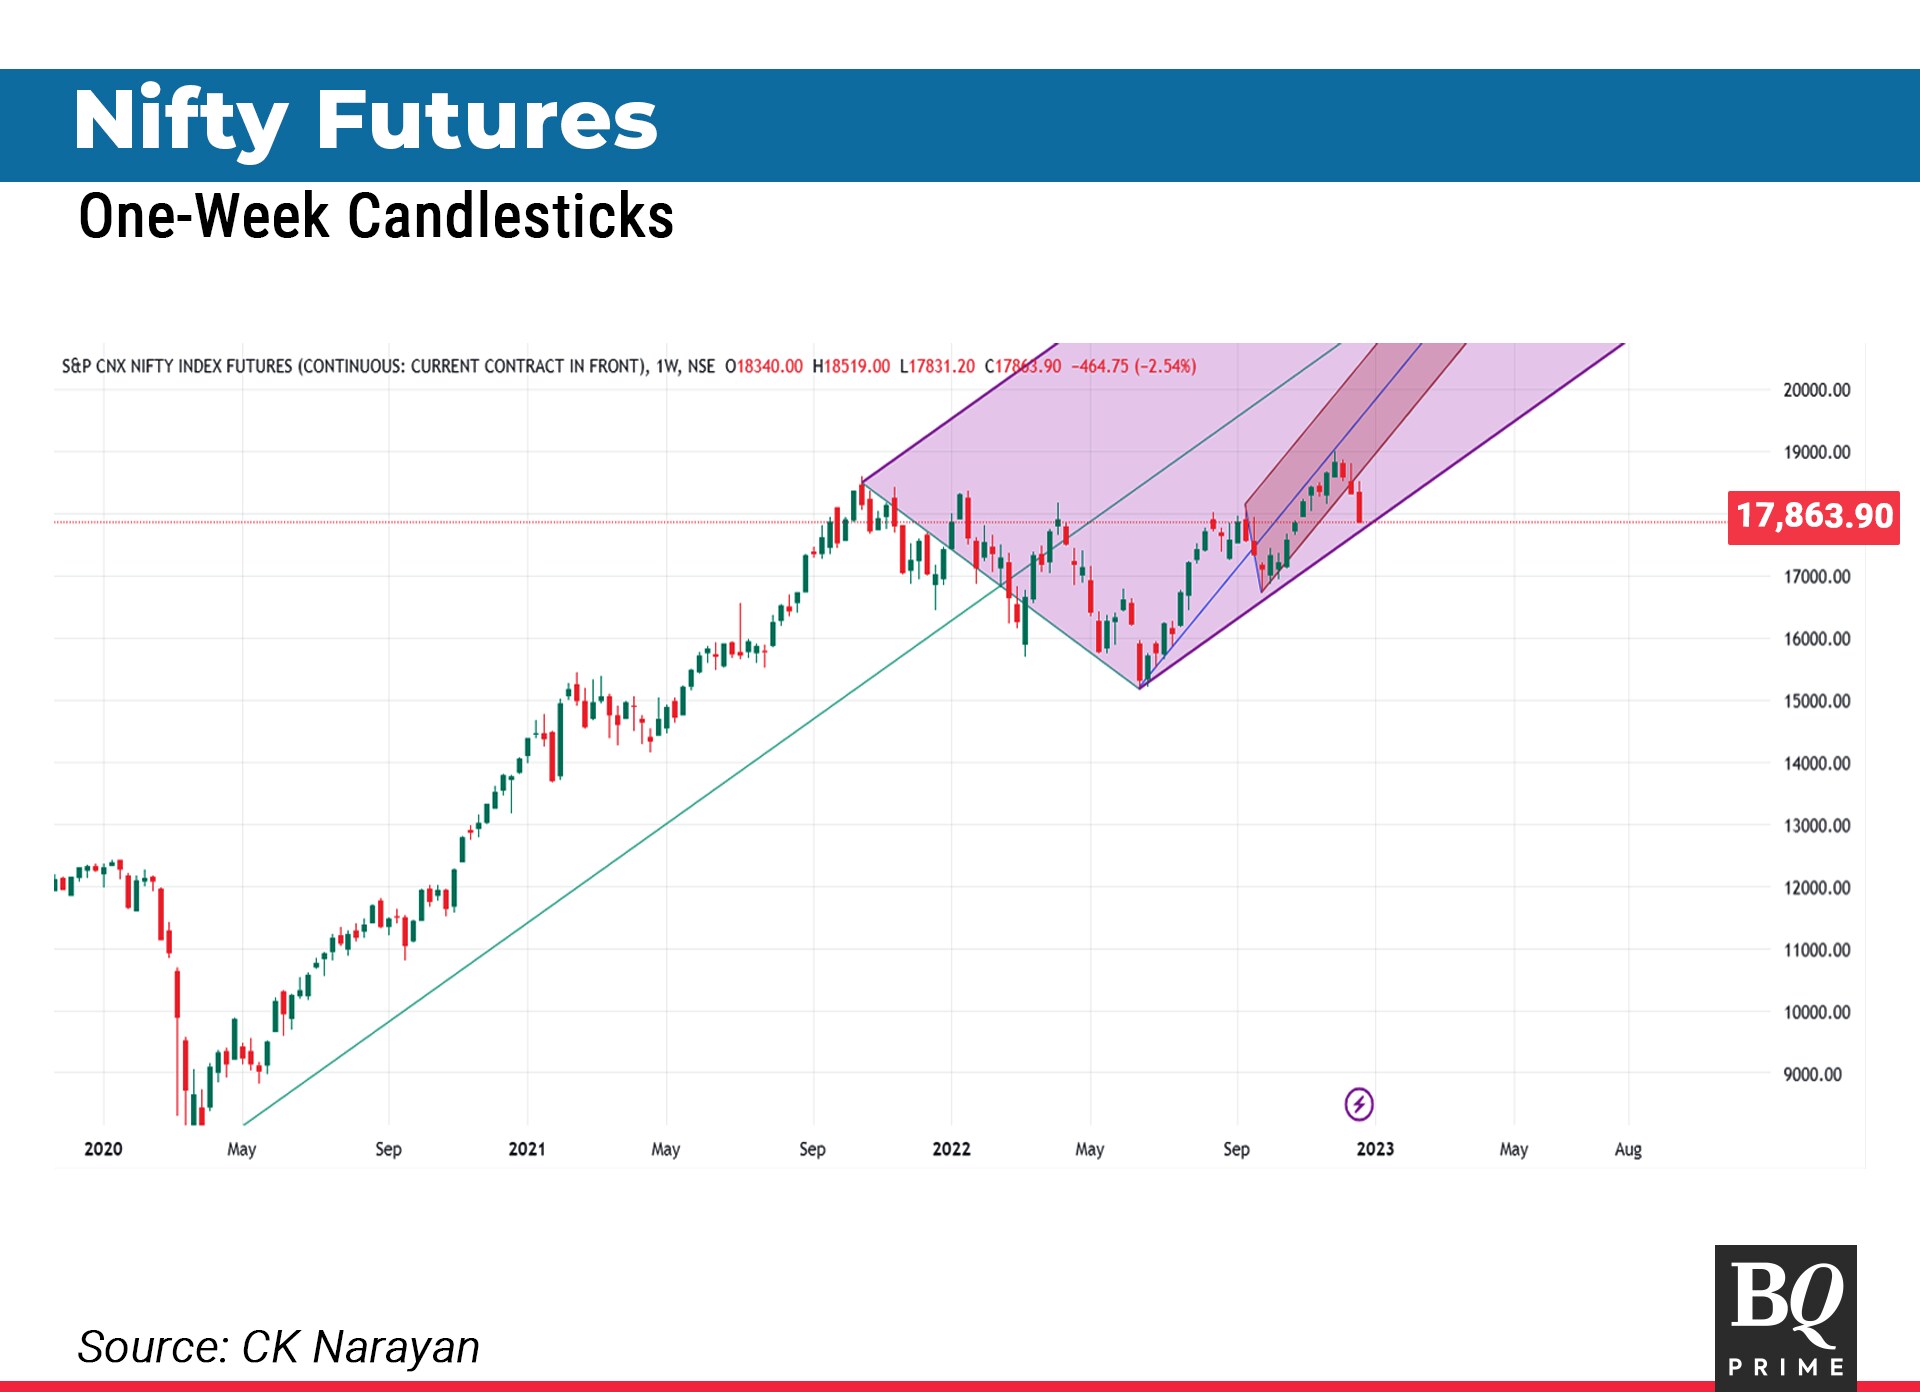
This is a continuation chart from a couple of weeks ago. I had mentioned that it was time be wary for declines. We can now note that a continuation beneath 17,750 on the futures will crack the lower pitchfork channel. We have already been warned of that when the minor pitchfork—the internal one—was broken.
In addition, there were several pointers in last week's letter where many conditions that would signal us of bearish intent were listed—using Ichimoku levels. A fall to 17,870 was signalled as the minimum distance to travel and we ended up near that at the end of the week. The usual intraday chart that I feature every week debuts this time as chart 2, so as to study the intraweek action.
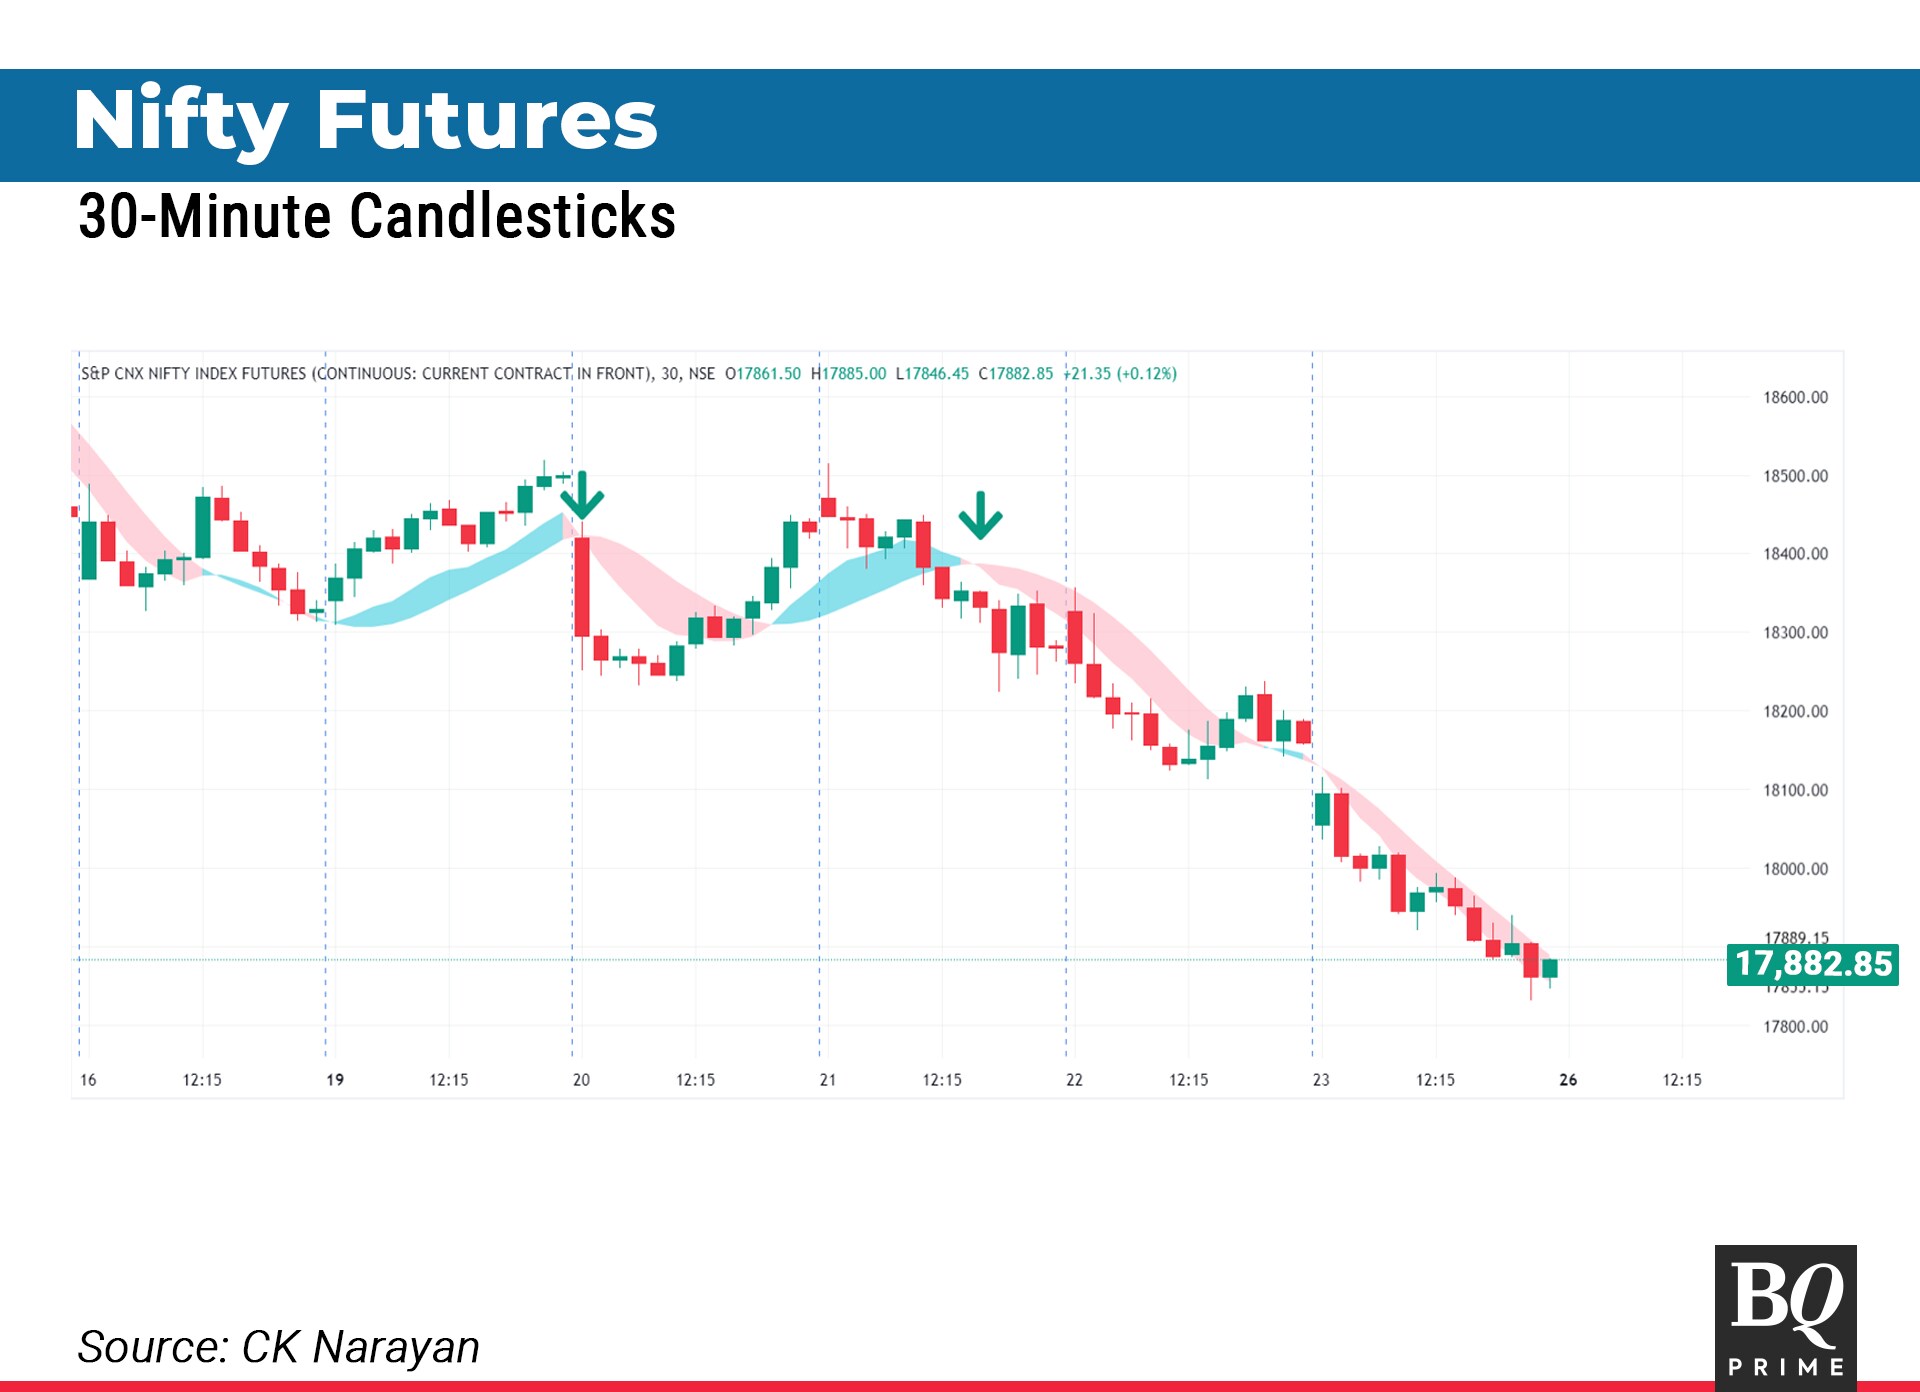
There was a small attempt by the bulls to wrest the advantage on Monday, but the baton was passed quickly back to the bears (first arrow) and reaffirmed on Wednesday (second arrow) and by the end of the week, it became a rout. The impact was felt high in the small- and mid-cap stocks. As can be seen in chart 3 (Nifty SmallCap 250), the fall was severe over the last three sessions—a drop of about 8.5%.
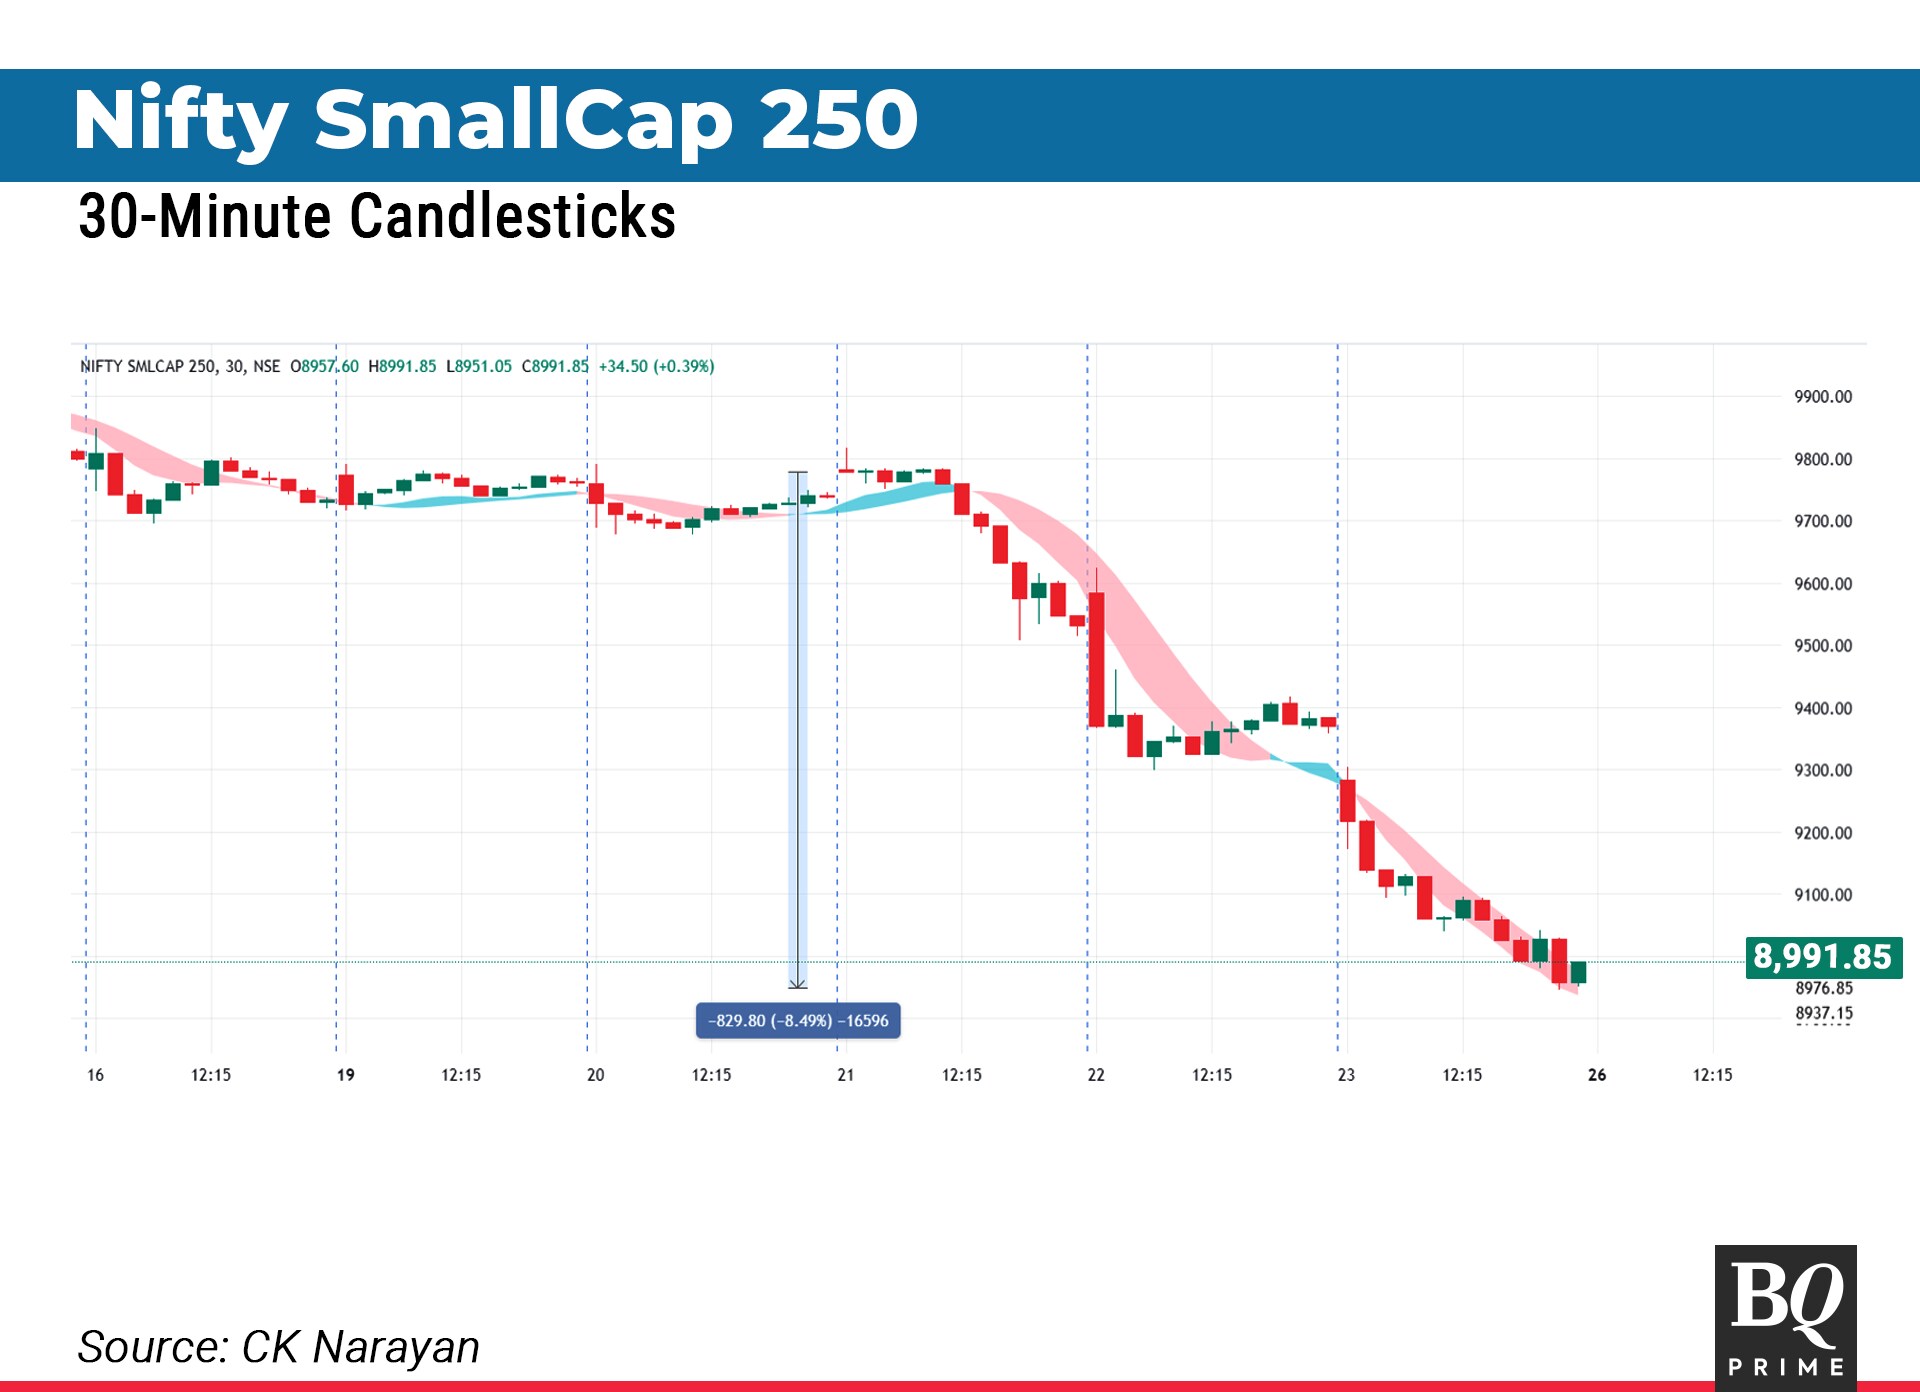
In comparison, the Nifty fell 3.6%, the Bank Nifty about 4.5%, and the Midcap index by about 6.5%. The pain, therefore, was a lot more at the end of the week, despite limited fall from the main index. The slow advance of the small-cap index lasted about 54 days, and that entire gain (almost) was wiped out in just six sessions. Markets can be vicious when the tide turns.
One of the areas I had warned of froth two weeks ago was in the PSU bank space. Last week, I had also written that any weakness in banking space would trip the market and we find that the PSU banks area was one of the hardest hit areas—down 12% from the intraweek high. Since there was very high trading in this space, it is the small traders who may have got hit the hardest with this fall. Private banks, in contrast, fell only around 4.75% and probably saved the Bank Nifty some blushes.
One may be a bit puzzled about the fact that the markets fell so much and the institutional space activity does not denote any such major selling. This may be because the fall has been from the leveraged positions held by operators. Last week, I had mentioned that if the call shorts are from the operator circles, the markets would get squeezed further and this is what happened. Hence, I would proffer that the selling has come from the operator and leveraged section of the market. The leverage has been on the equity as well as the options segments. People with limited capital and no strategy are the victims. Always. The continued inflows from FPIs and the inflows into SIPs, etc. will ensure that the big institutional play is as yet positive. An example is the large buy figure from the DII on Friday (Rs 3,300 crore) could not stem the decline of that day at all. Clearly shows that the traders were in one market while the institutions were in another segment. Hence, those figures from institutional participation cannot be correlated to the daily movement of the markets.
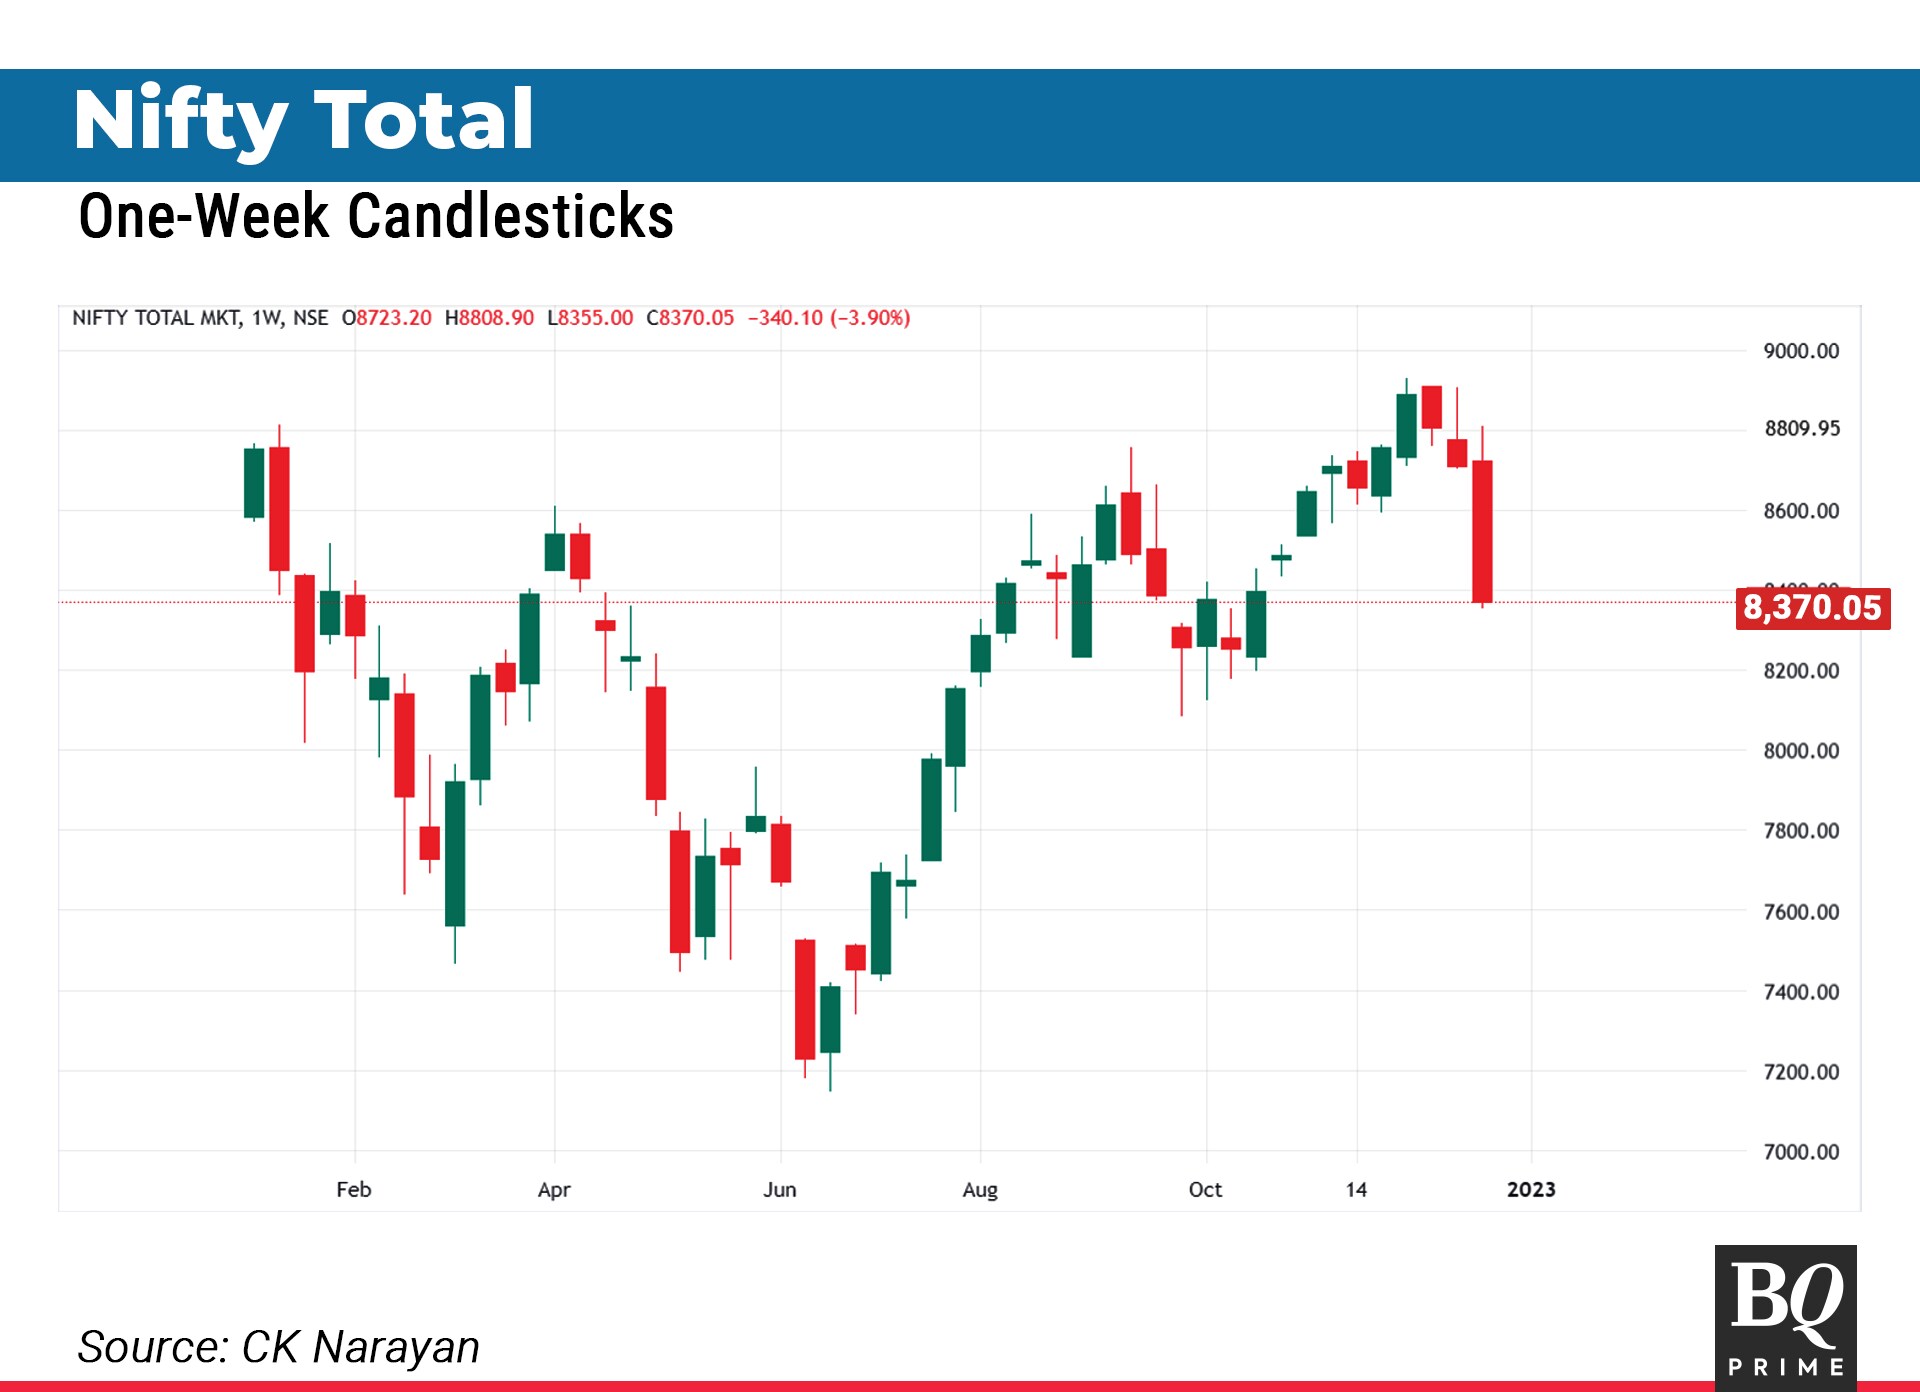
But what is disconcerting in the charts is the long-range candles that one is seeing in almost all the sector indices charts—barring pharma. A long-range red candle bespeaks of more bearish intent ahead especially, when it gets launched after a series of small body candles or after a big rise. For an example see chart 4, weekly Nifty Total Market Index. I am using this index deliberately to take it as a measure of the entire market. Note the large weekly candle that depicts the trading of the last week. Such a candle is to be found on almost every single sector index. Note also how this candle has manifested when the prices are just peeling off from the top. Technically, big trended moves often emerge from the appearance of a long-range candle at the start. Therefore, the presence of such candles in a wide range of charts is alarming.
The market is still loaded with long positions. The fall was sudden and consistent over three sessions. Those that didn't have money have been forced to square up. But there are plenty of those with money to fund their M2M losses. Those are still around. The options positions continue to show that the call shorting is dominant (PCR around 0.6 for both indices). The India VIX is rising. See chart 5.
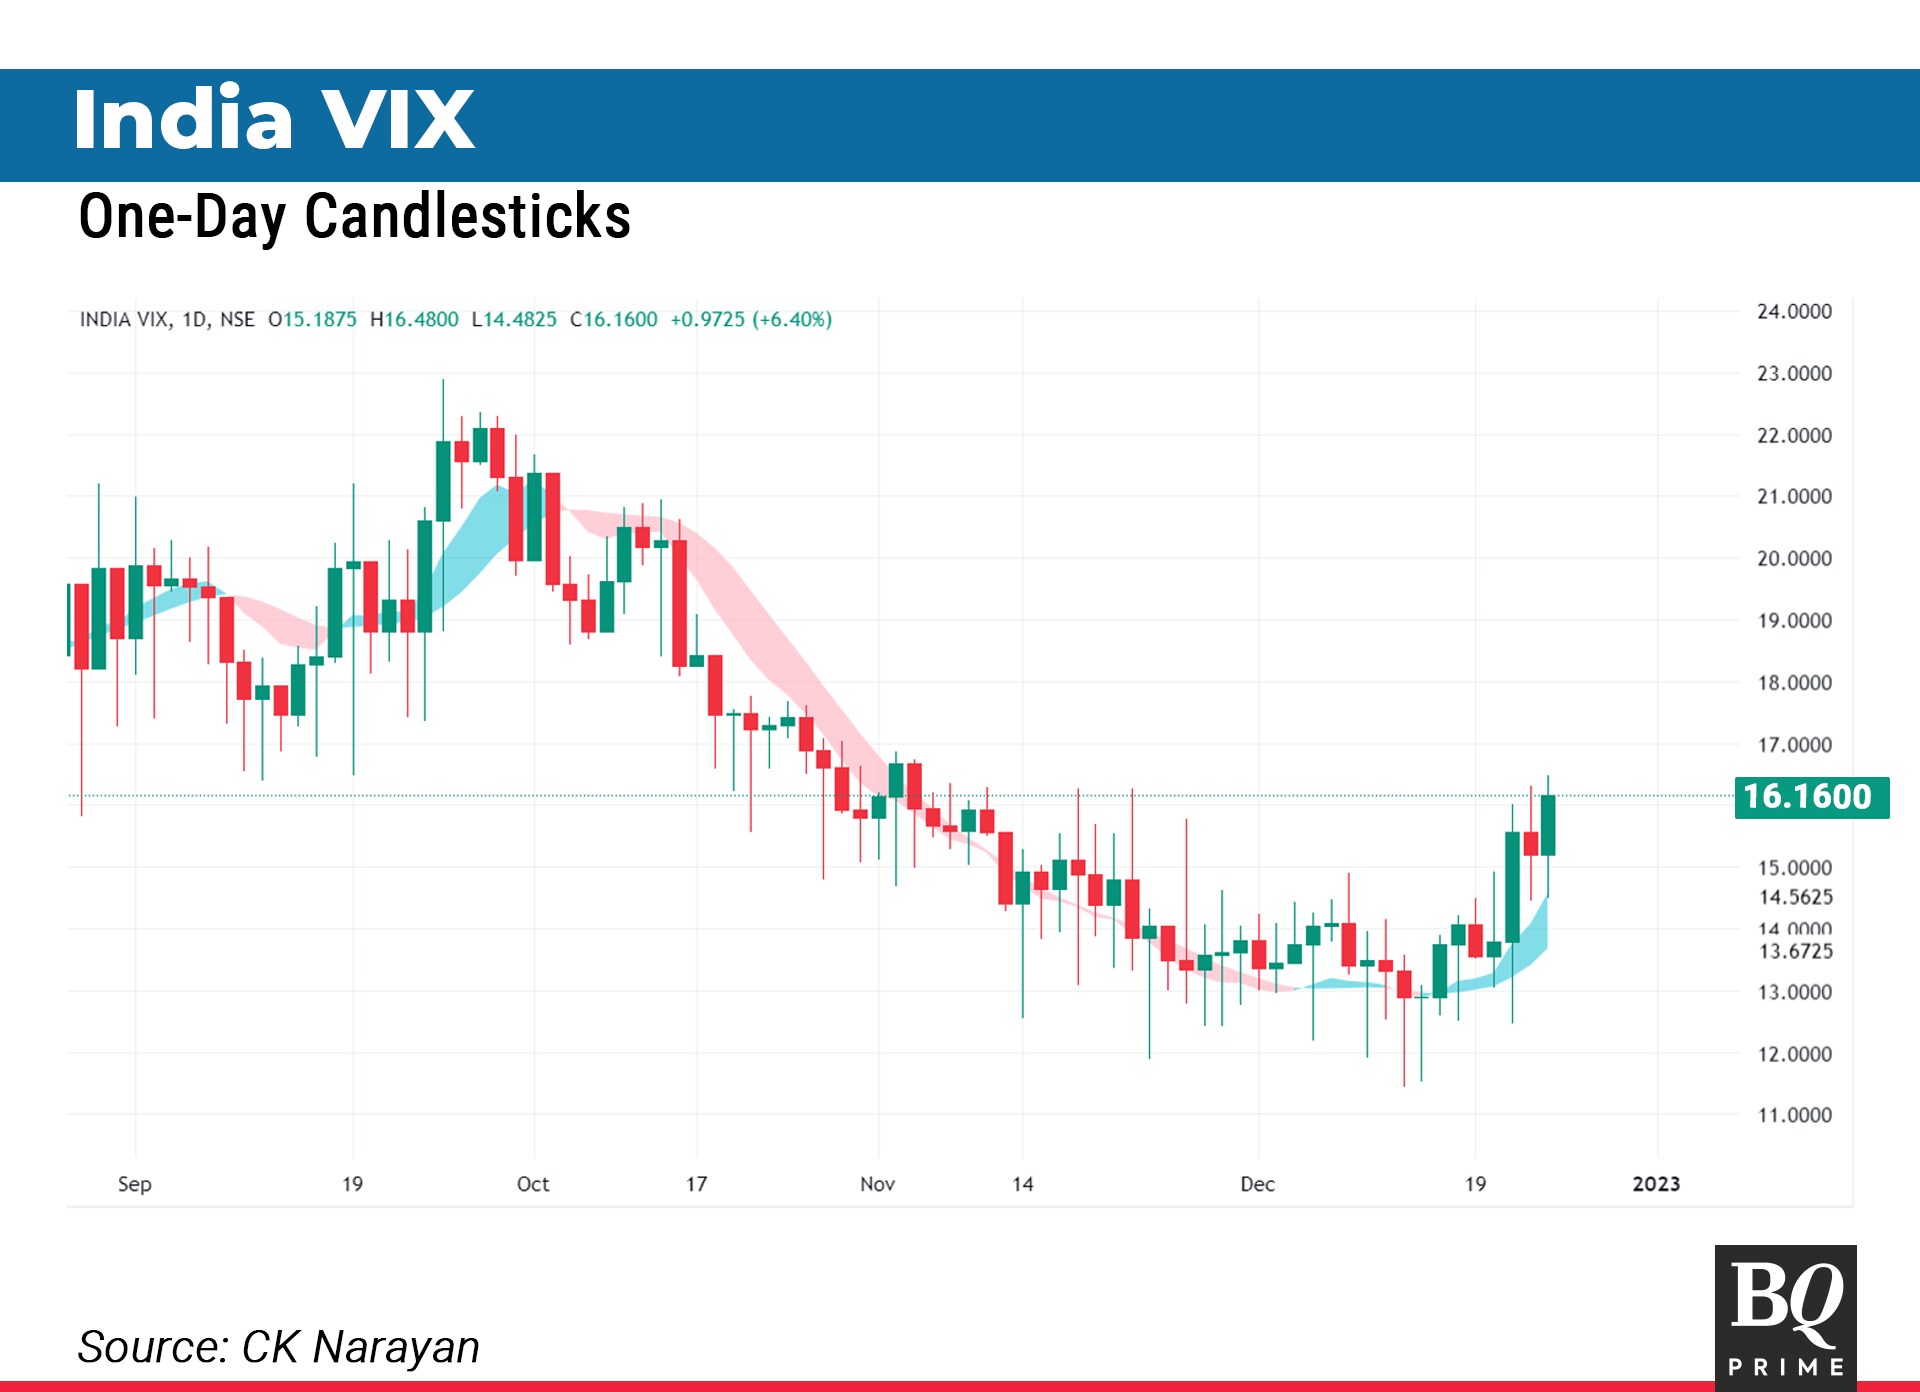
Since September, option short was the way to go. The steady decline in the VIX makes it very convenient and easy for the sellers to take home the money. But when the regime shifts from a low volatility to a higher one, much more adjustments are called for in option strategy deployment. This, most people don't know. Most of them are of the vanilla-type—sell and hope for the best.
In September, VIX was at 22% levels and currently, they are at about 16%. There is good potential for VIX to rise further. It is not an automatic setting that higher VIX also means higher premiums and therefore, better for selling. This is what many think. Unfortunately, for many of those, the last week may well have ruined the return profiles for the year.
So, we come to the conclusion that the market broke below supports, is now poised to break more supports, the set-up is negative across many sectors, the sentiment is biased against advances as shown by the option PCR and there is also an element of fear getting added (rising VIX).
All of these add up to a picture where any rally may be difficult to sustain. So, we have probably entered into a phase of sell on rallies. And this may last for a while. So, gird yourself up for it. Buying dips is a lot easier than selling rallies, please note. Chart 6 shows what to expect ahead.
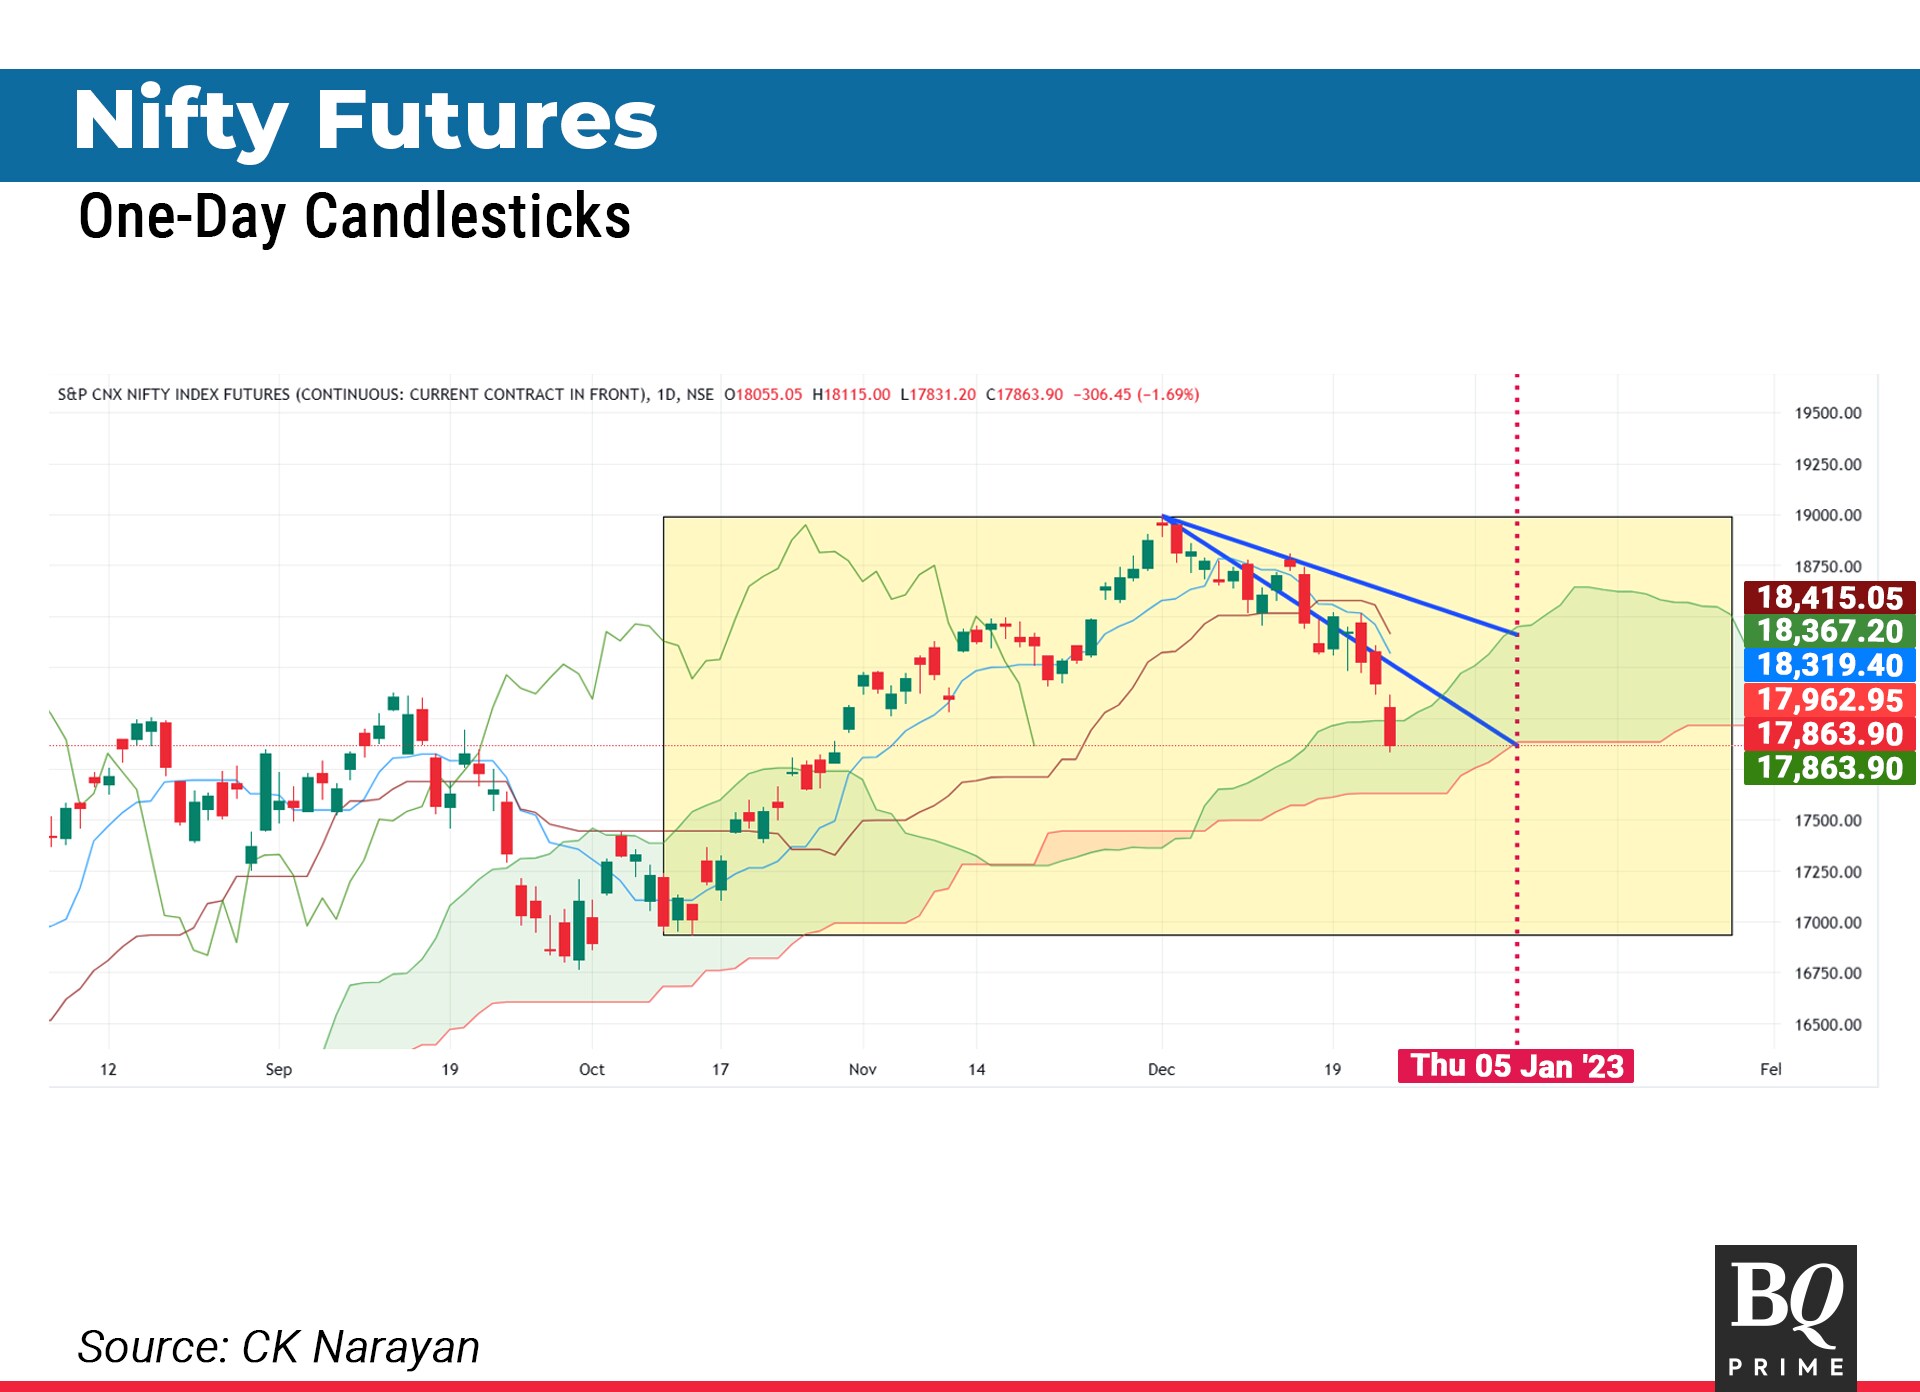
Using the Ichimoku chart (daily), the operative area of consideration for the market for the immediate future is shown as a yellow rectangle. The earliest time count I can find is for Jan. 5. Four of the five Ichimoku lines are declining, so the bears have the hold. Hence, the best that the bulls can do is create a small rally. The tipping point of last week was 18,300 and hence, that would be the max extent of a rally, perhaps it may even undershoot that by 100 points or so.
If the fall continues, then the max that I expect it may fall to is between 17,625-17,700. So, shorts, if any, can be covered there and active traders can attempt longs for a rally that may last up to the next time turn date. A rally will lead to flattening of the two short-term lines of the Ichimoku and those will be the max extent for the rally. The two forecast lines will also guide for immediate resistances. Those playing the trends can await a rally towards 18,100-18,300 and short that rally with a stop-loss above.
CK Narayan is an expert in technical analysis; founder of Growth Avenues, Chartadvise, and NeoTrader; and chief investment officer of Plus Delta Portfolios.
The views expressed here are those of the author, and do not necessarily represent the views of BQ Prime or its editorial team.
Essential Business Intelligence, Continuous LIVE TV, Sharp Market Insights, Practical Personal Finance Advice and Latest Stories — On NDTV Profit.


