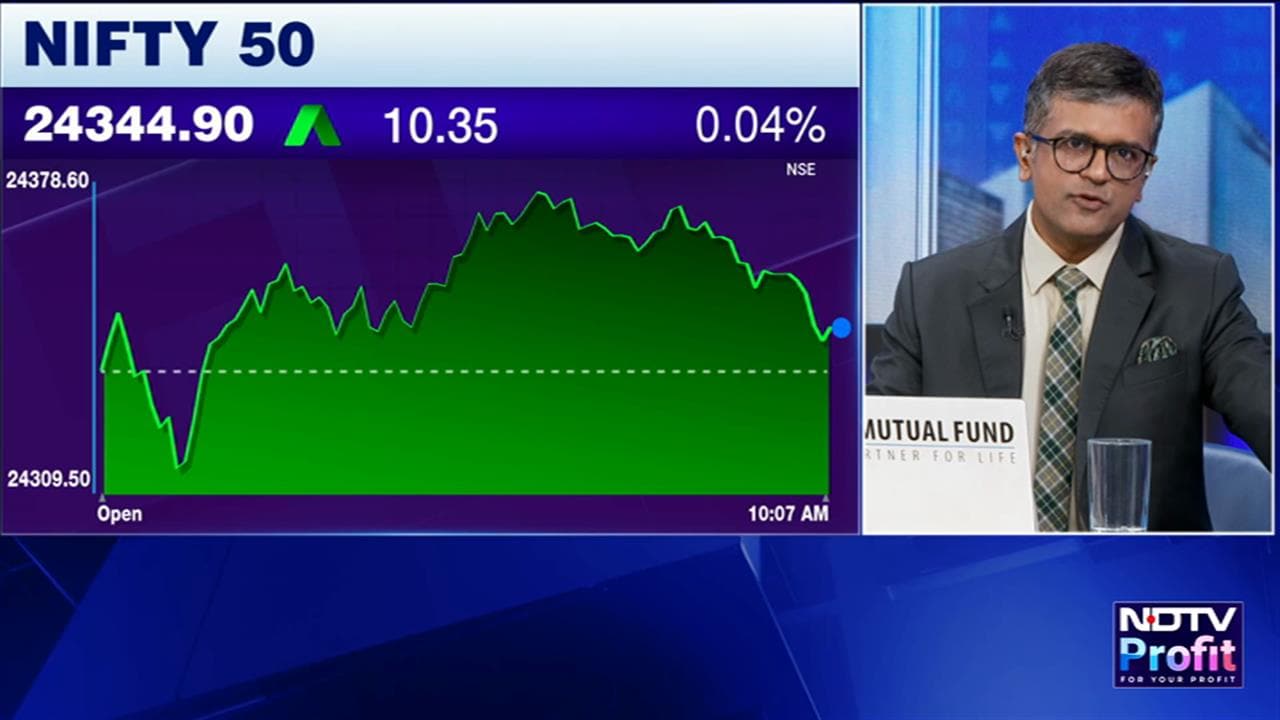
The Nifty 50 closed lower on Wednesday after failing to hold early gains, ending at 24,207.75 as selling intensified during the closing phase.
The index's decline remained limited before the closing auction session, but it fell by nearly 68 points during the CAS. Despite the weakness in the benchmark, the Nifty Smallcap 100 outperformed and touched a fresh all-time high.
The session also saw investors move away from IT and FMCG stocks towards metals, banking and financial services.
The Nifty erased the previous session's gains and formed a sizeable bearish candle on the daily chart, closing near the day's low. The index slipped below its 8-day exponential moving average during the CAS-related decline but held its 50-day moving average support. It was trading about 0.78% below its 20-day moving average.
India VIX fell 4.6% to 10.5, its lowest level in several months, while implied volatility also remained at low levels.
Range Check
The Nifty remains in a sideways trend within the 24,000-24,400 range. A sustained move above 24,400 could open the way towards 24,550-24,670 in the near term.
A sustained decline below 24,000, however, could bring renewed selling pressure and weaken the broader market setup.
Key Levels
For Thursday, 24,115 is the immediate support level, corresponding to Tuesday's low. A break below that level could push the index towards the 24,000-24,040 support zone.
On the upside, the Nifty needs to reclaim and hold above 24,400 to confirm a breakout. Until then, the index is likely to remain range-bound, with stock-specific opportunities continuing to attract investor interest.
Stock Watch
Navin Fluorine International touched a fresh 52-week high in August after forming a bullish candle with higher trading volumes. The stock subsequently entered a consolidation phase, trading within the range of that candle as volumes gradually declined.
On Wednesday, the stock broke above a falling trendline, with trading volumes rising alongside the move. It remains above its key short- and long-term moving averages, while the 14-period relative strength index has moved into bullish territory and the daily MACD has generated a bullish crossover.
Sustaining above the Rs 8,555-Rs 8,560 zone would keep the momentum intact, with Rs 8,770 and Rs 8,850 as the next levels on the upside. The suggested stop loss is Rs 8,300.
Essential Business Intelligence, Sharp Market Insights, Practical Personal Finance Advice, Daily Fuel, Gold and Silver Prices and Latest Stories — On NDTV Profit.