The week just ended was a complete bear show as declines held sway across the markets. All segments of the market were pummelled and there was even some panic in the sentiment. There really wasn't any specific reason attributable to the panic. One of the possibilities was profit taking/loss booking with the advance tax date in mind for people wanting to adjust their tax payment. It is possible that such selling may extend until the cut-off date for FY 23-24 (March 24) but the bulk of the selling appears to be done.
The Nifty fell the least (2.8% off the high) but that gave a misleading picture of the sentiment as the Bank Nifty is down 3.9 % from the high and the small-cap index is down 15% from the high. We did have, earlier, a sharp decline back in December and January where Nifty fell 4.6% and Bank Nifty dropped 9.15%. Given that, the current fall is much less, but the decline in small and mid-cap area is what that has unnerved the sentiment especially in the light of the fact that this space did not meet any meaningful correction in the December-January period. The sentiment pain is caused the most when damage is caused to portfolio values of individuals. Chart 1 shows the different declines referred to above.
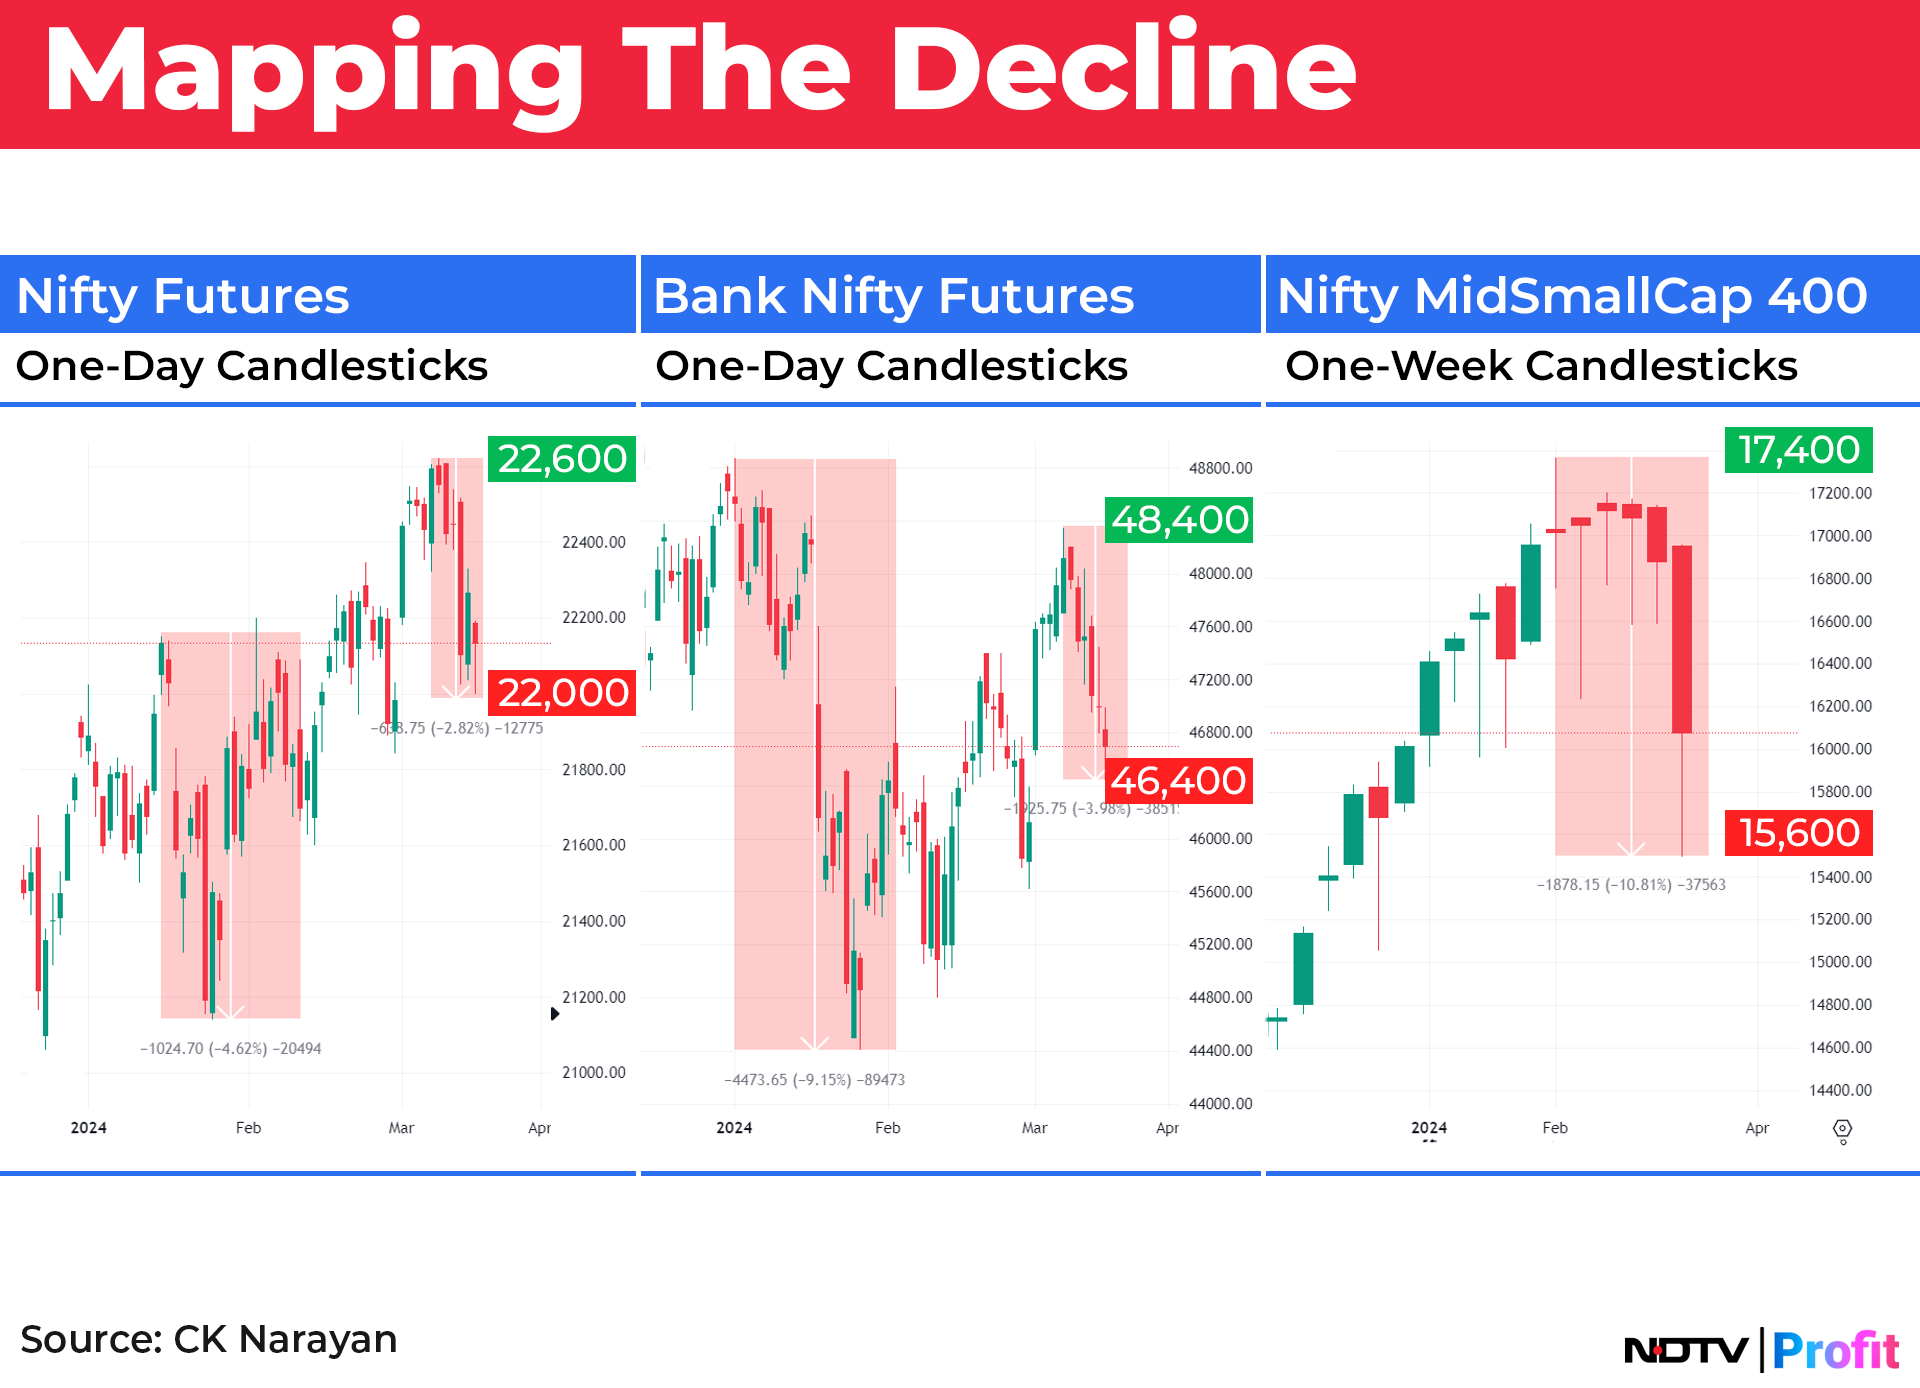
Notice especially that the decline of December and January on the small-cap index is a minor blip which is probably why the current decline is so much larger.
Our projection chart for the year had indicated that the market may pull back to test the January lows but this has not happened in the case of Nifty and Bank Nifty, however, yet. It has happened in the case of mid- and small-cap indices where the January lows have been tested. The rising patterns of the small- and mid-cap indexes shown in Chart 1 are clearly implying that the large majority movement took place in the mid-small segment and, therefore, its pullback to test January lows is in line with the overall expectations laid down for 2024 vide the annual map. Readers may refer to the start-of-the-year letter where the annual road map for 2024 was given.
Since the market was concentrated on the small and mid segment during the last leg of the rise, the sentiment had moved almost completely to that area and an annual map tries to capture the sentiment ebbs and flows in making the forecast.
For some more detail on market behaviour, we shall look at the important indices of the market using a combination of momentum, trend following and sentiment measures to gain some perspective about the future. For this we shall be using the Ichimoku charts coupled with the ADX DMI indicator. We begin with Nifty (Chart 2).
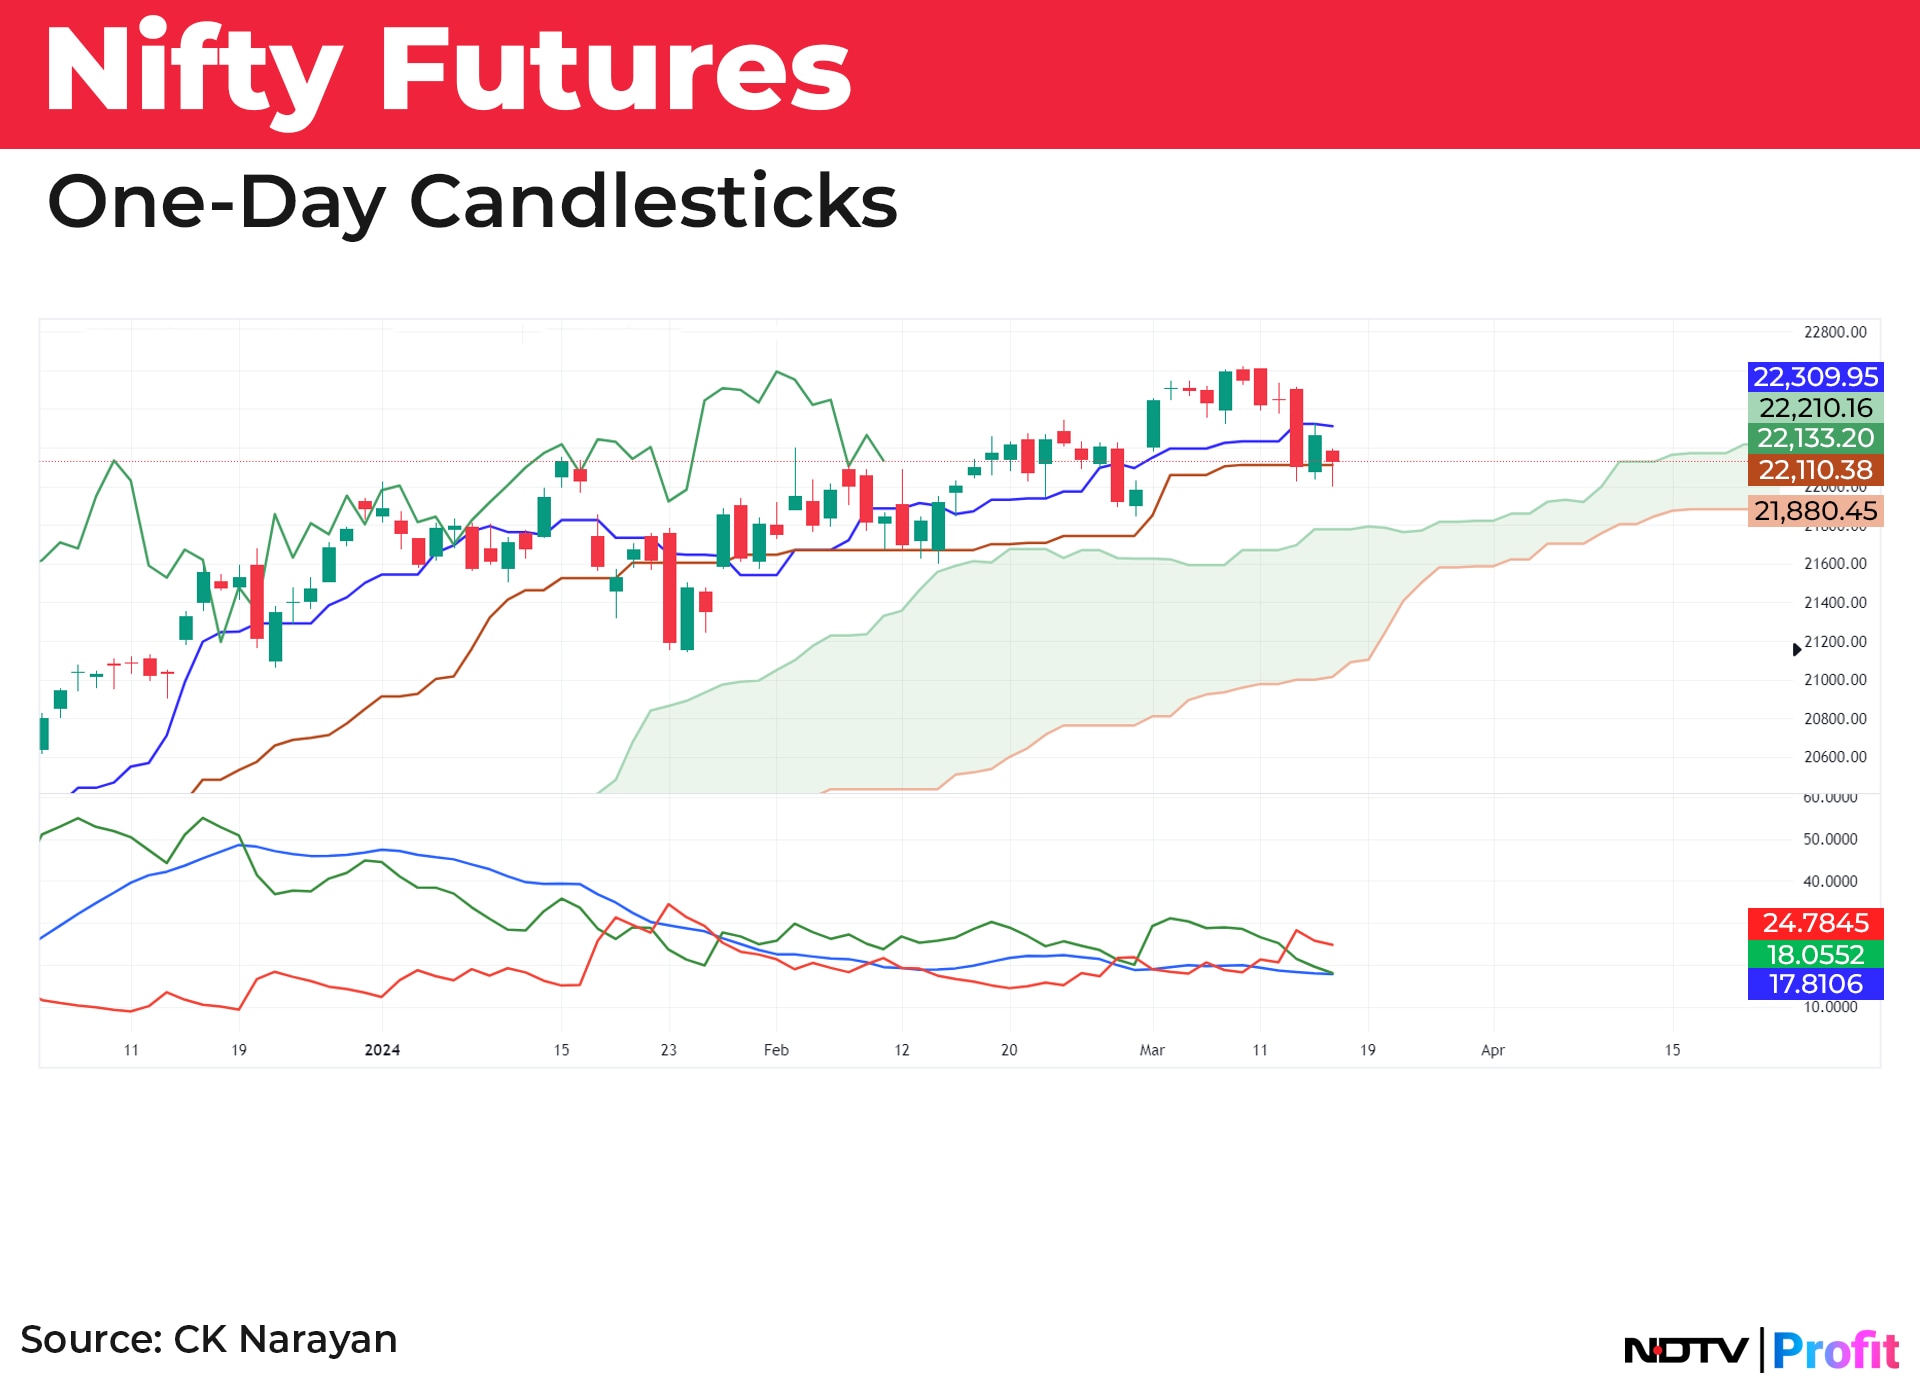
Here one can see that all the 5 lines of the Ichimoku continue to remain in a bullish mode. The DI lines, used here for momentum measure, are seen placed near one another and with steady loss in upward momentum seen since end January even as the index continued to punch out new highs. The ADX line has been on a descent from end December 2023, which again implies divergence between Price Action and Momentum. The noise associated with Price Action often obfuscates such slowing momentum. But, bullish grip on the Nifty is still patent.
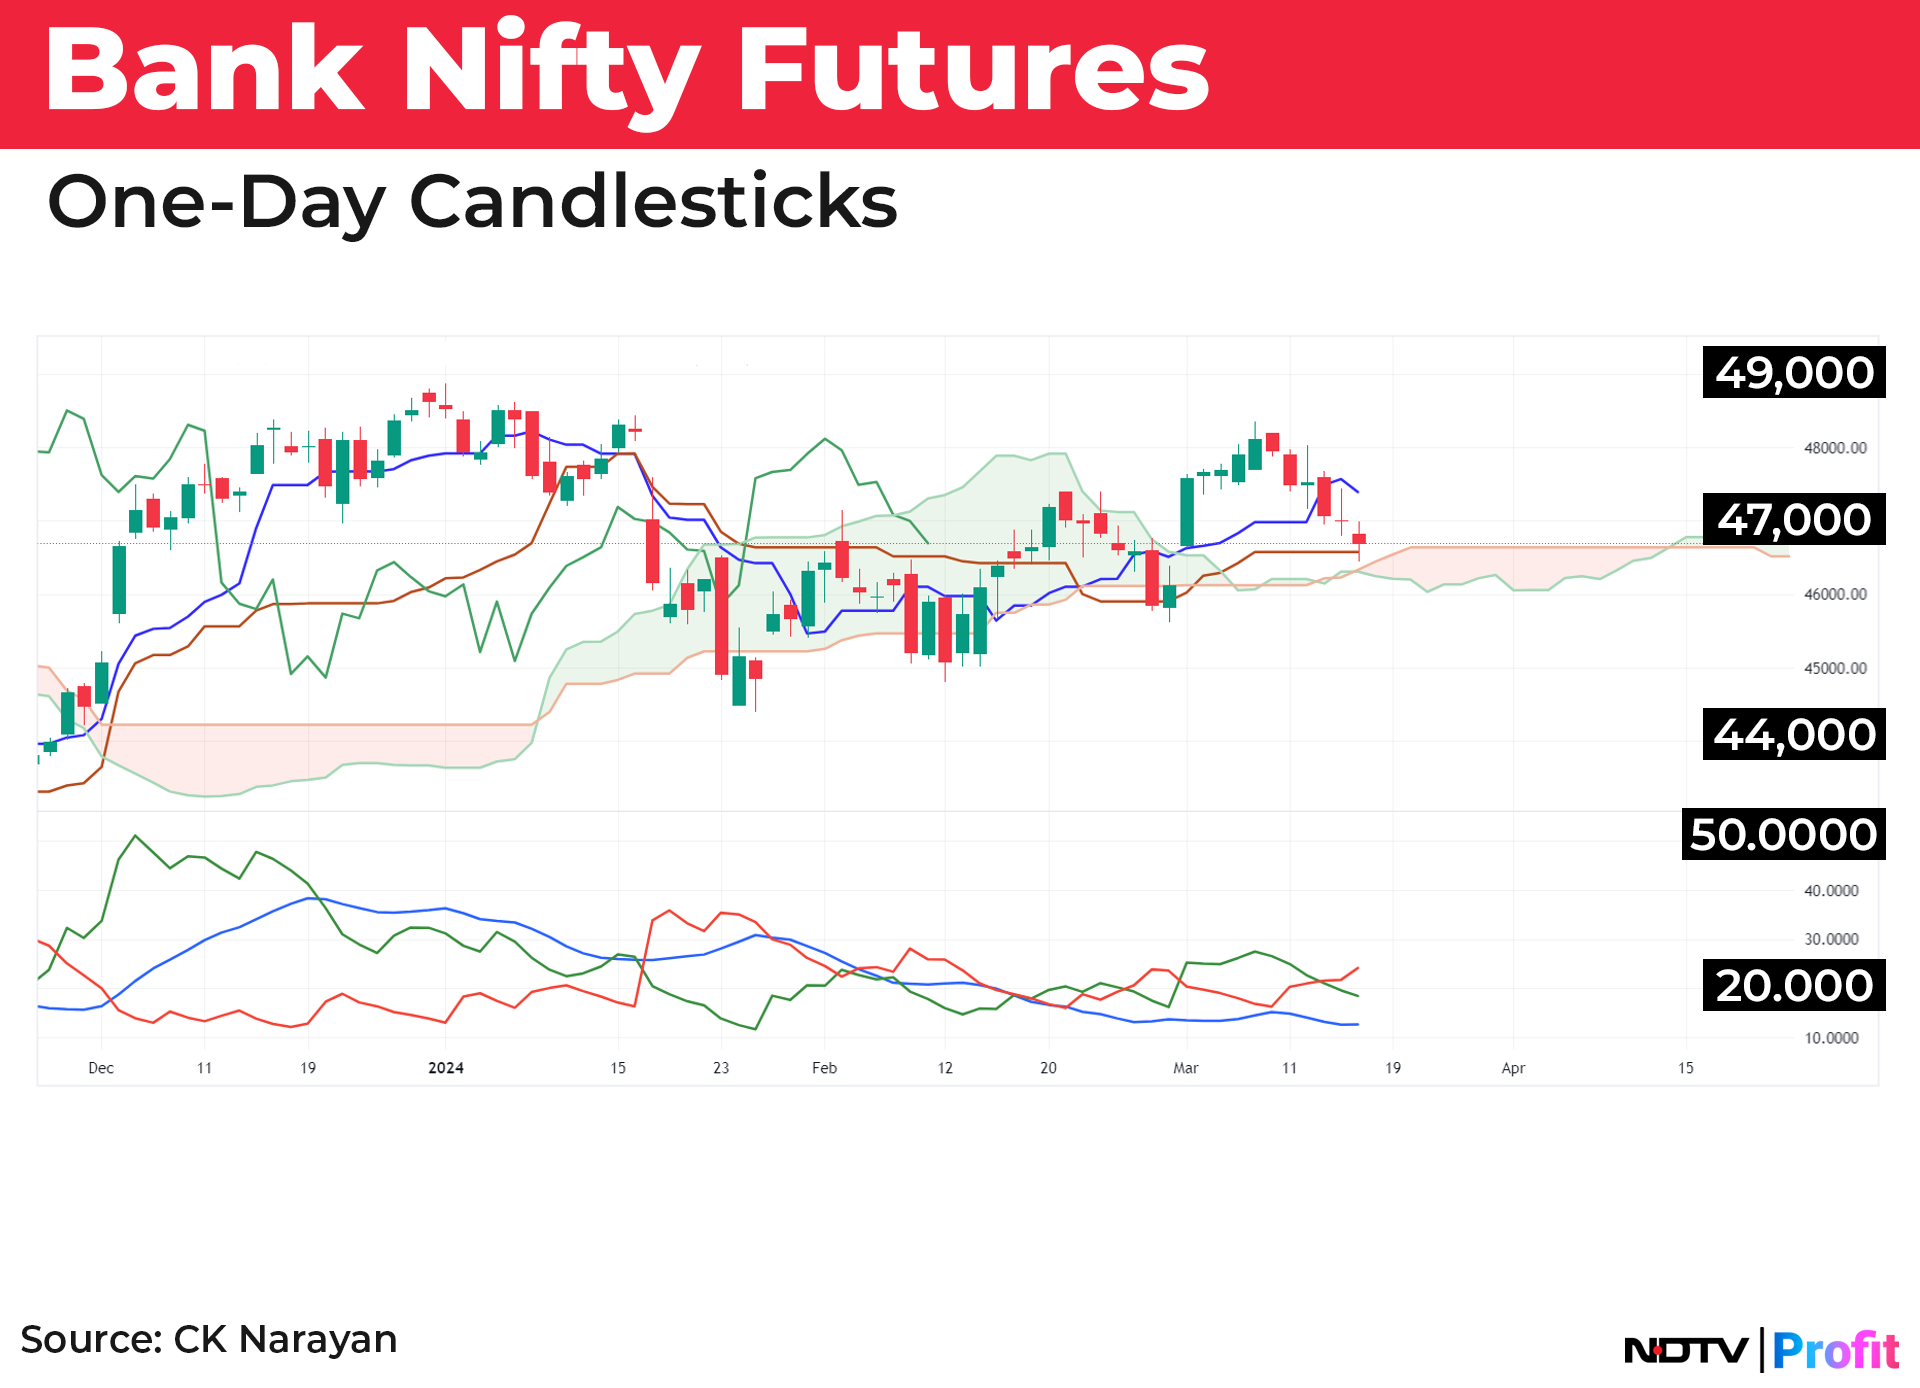
The picture is, however, different on Bank Nifty (Chart 3). Here we note the mixed picture of the Ichimoku lines where bullishness seems have to eroded much. Even though there was a rallying attempt from oversold zones from end of February 2024 it has not been able to work up sufficient momentum to bring the bulls back in the game. Further, bears established sentiment dominance from mid-January 2024 (not the case in Nifty) and that has not yet been reversed. So, here bears have the upper hand in the short term.
Moving on to small cap Index (Chart 4), we are finding a shift towards short term bearishness as all the 5 lines of Ichimoku have turned bearish mode recently. Also, the break of the cloud support (not seen in the earlier two indices) implies either further declines or ranging action ahead. The DMI chart unequivocally speaks of bears grabbing control in this area (Bearish DI dominance and rising ADX). This will require substantial rise in prices to reverse this situation, which may be difficult in the near future.
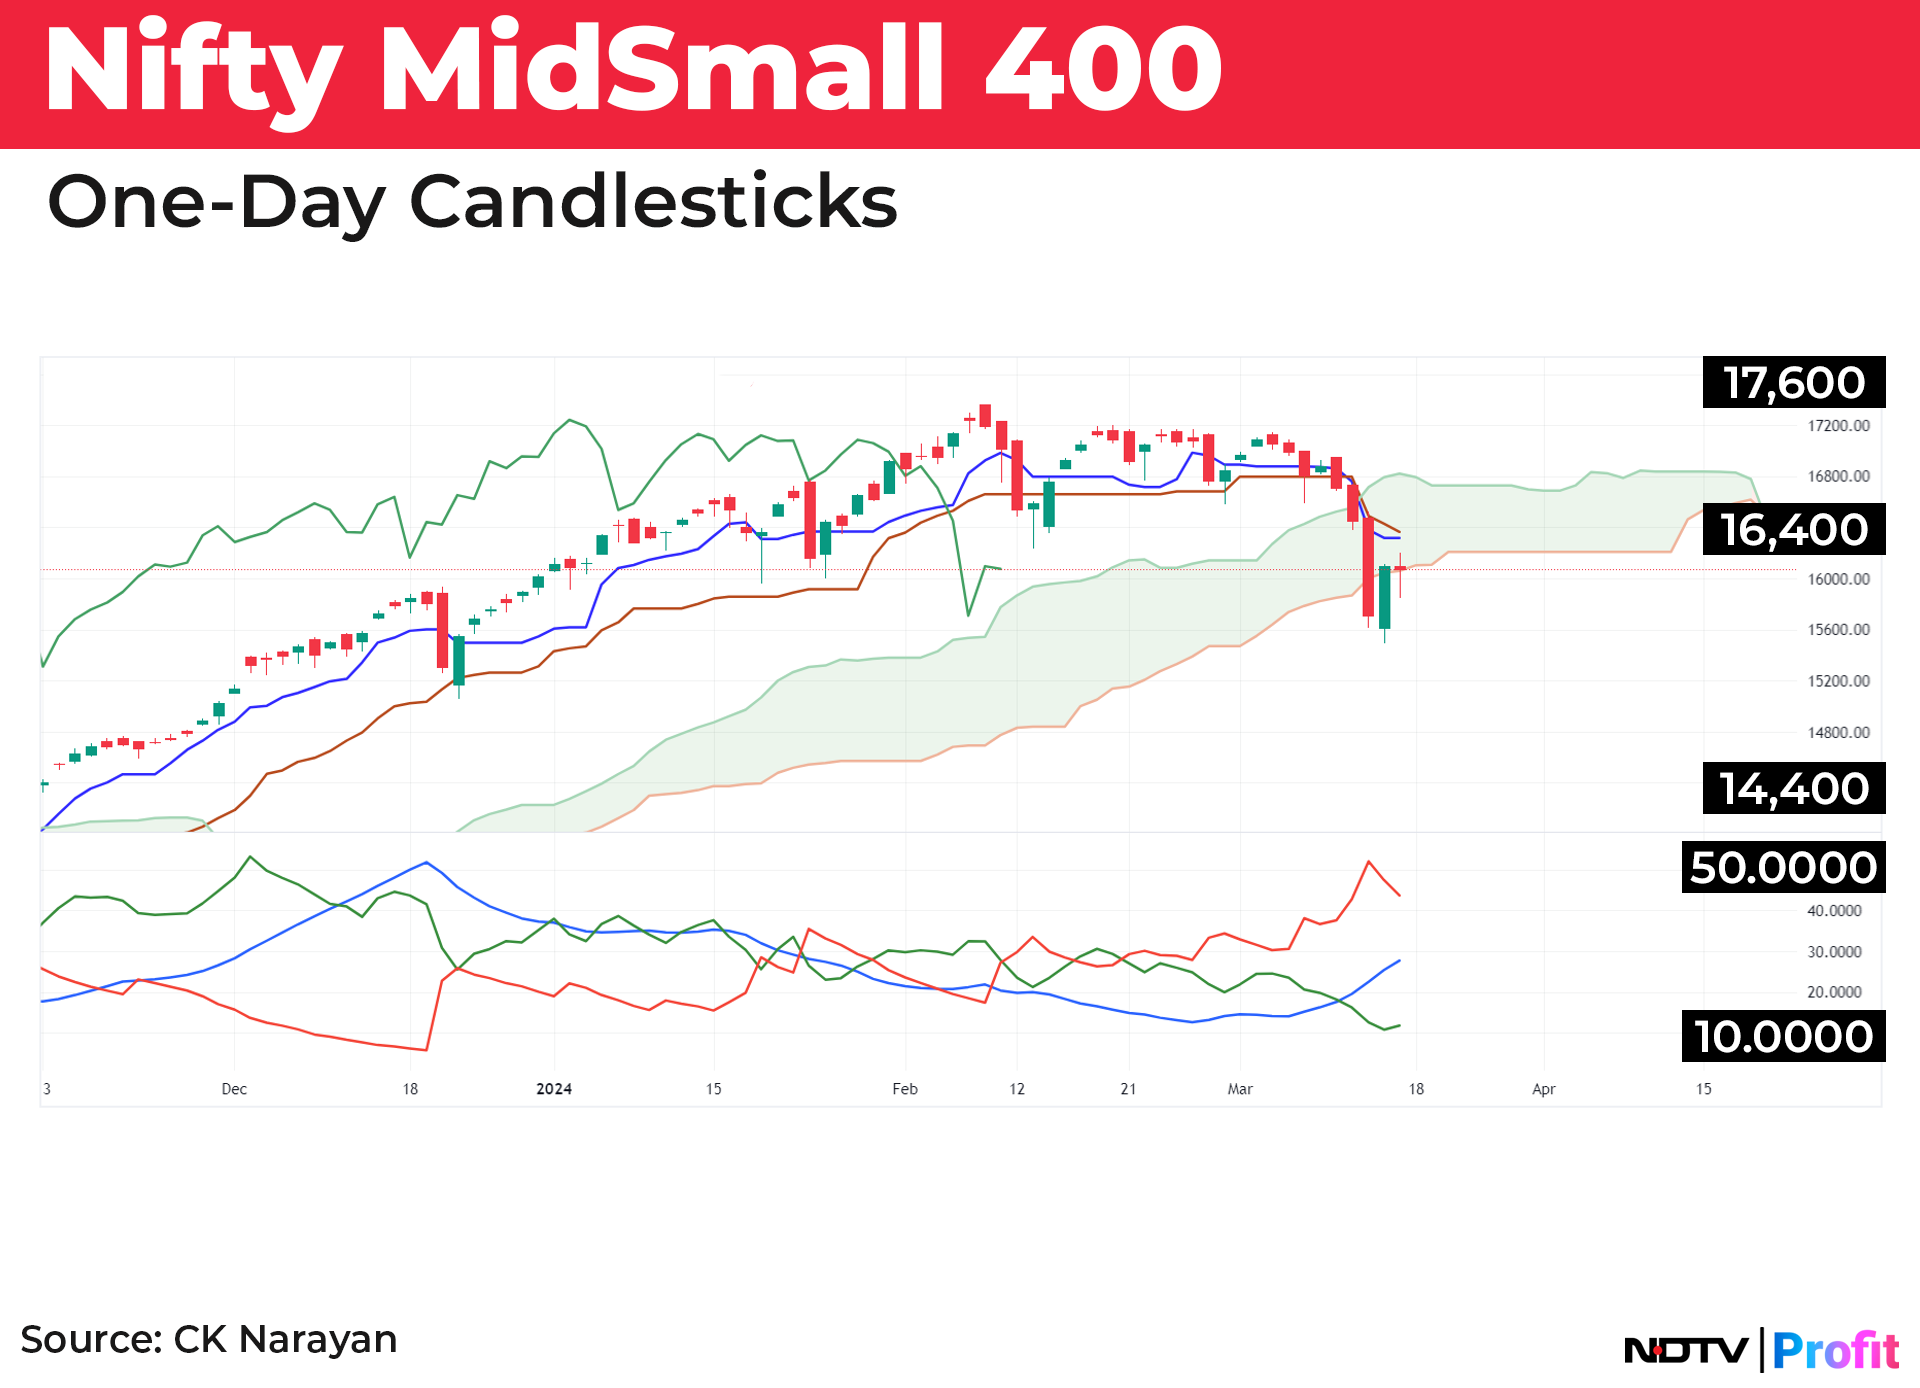
This has important implication for people who are engaged in momentum investing. The free ride that they were enjoying over the last many months has ended with the current downturn and from hereon one will have to be very selective about continuing the same style.
The final index that we shall take up is the FINNIFTY (Chart 5) where we are observing that the bears had taken control in mid-January although the trends now have turned largely neutral and the ADX line remains down. The bearish nature of the trend is evidenced by the bearish positioning of all the 5 lines of Ichimoku.
Collectively, it is evident that the main indices are into some form of ranging while the small-mid cap area has turned bearish. The Nifty is the best place amongst the set and since that arbites the sentiment on a day-to-day basis, a general feeling of complacency may still exist in the market. However, personal portfolio is the area which matters and there the mood has turned down. People straddled with purchases late in the cycle will find it difficult to participate aggressively as earlier. Much unloading of earlier profitable positions has already occurred during the 15% drawdown and buyers will largely emerge from this group as well as some new entrants to the market. In the larger indices, matters may continue as they are with range trading dominating.
Returning to the Nifty, all the action of the last week has still created only a higher bottom in the ongoing sequence of reaction bottoms Chart 6. This now allows us to shift our two trailing stop-losses 21,843 and 21,600 of futures. Since the Nifty has created a new high a pattern of establishing a lower top and then breaking minor bottoms will be required for a change of trend and this may take a while to occur and therefore the immediate change is sentiments are not envisaged in Nifty.
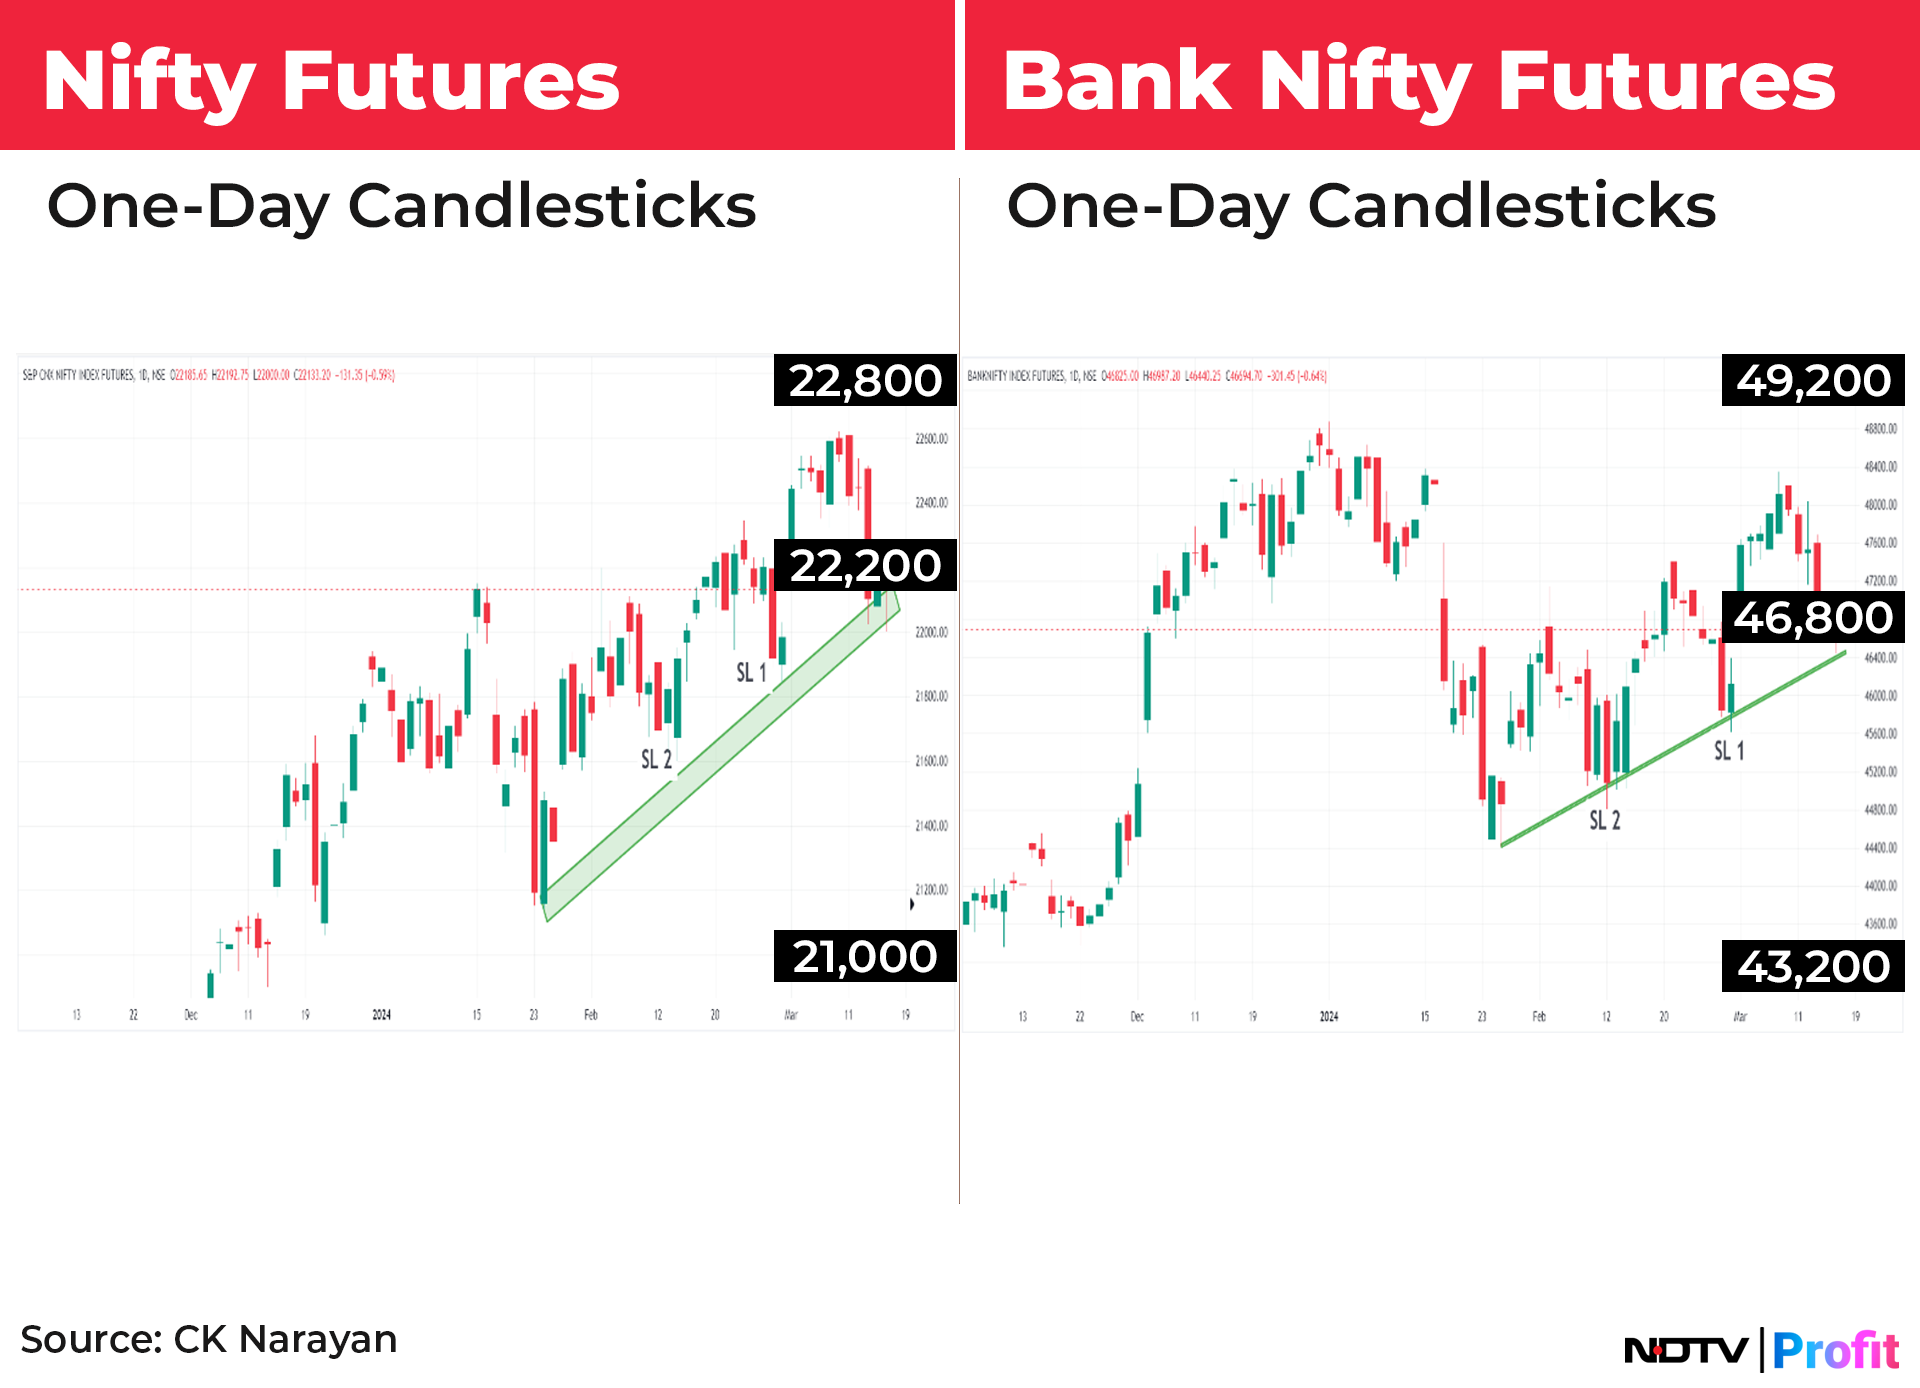
In the Bank Nifty, however, a lower top has been punched out so far and a break of trailing stop levels (44,800 and 45,600) will signal a definite change in trend and hence Bank Nifty players on a greater alert compared to Nifty players.
Given the complexity of the situation facing each segment of the market, it is no wonder that there is a lot of confusion prevailing among traders and investors. Unfortunately, since consistent triggers are absent and we seem to be swayed more by overseas events, the situation may continue to remain this way for some more time to come. However, with a lot of liquidation in positions expectedly done the force of decline may be lesser but intraday/intraweek volatility might increase. Therefore, the weeks ahead may be a lot more difficult to trade or invest compared with the easy ride that all of us have enjoyed over the past many months.
Readers are, therefore, alerted to expect in a more difficult time for the trends ahead and therefore to change their approaches suitably. It may still be a buy on dip time for many large caps but the players of bank stocks need to be on some alert. Small-mid cap investors have to turn very selective in new additions and also consider baling out of losers during any coming rally in that space.
CK Narayan is an expert in technical analysis, the founder of Growth Avenues, Chartadvise, and NeoTrader, and the chief investment officer of Plus Delta Portfolios.
The views expressed here are those of the author and do not necessarily represent the views of NDTV Profit or its editorial team.
Essential Business Intelligence, Continuous LIVE TV, Sharp Market Insights, Practical Personal Finance Advice and Latest Stories — On NDTV Profit.