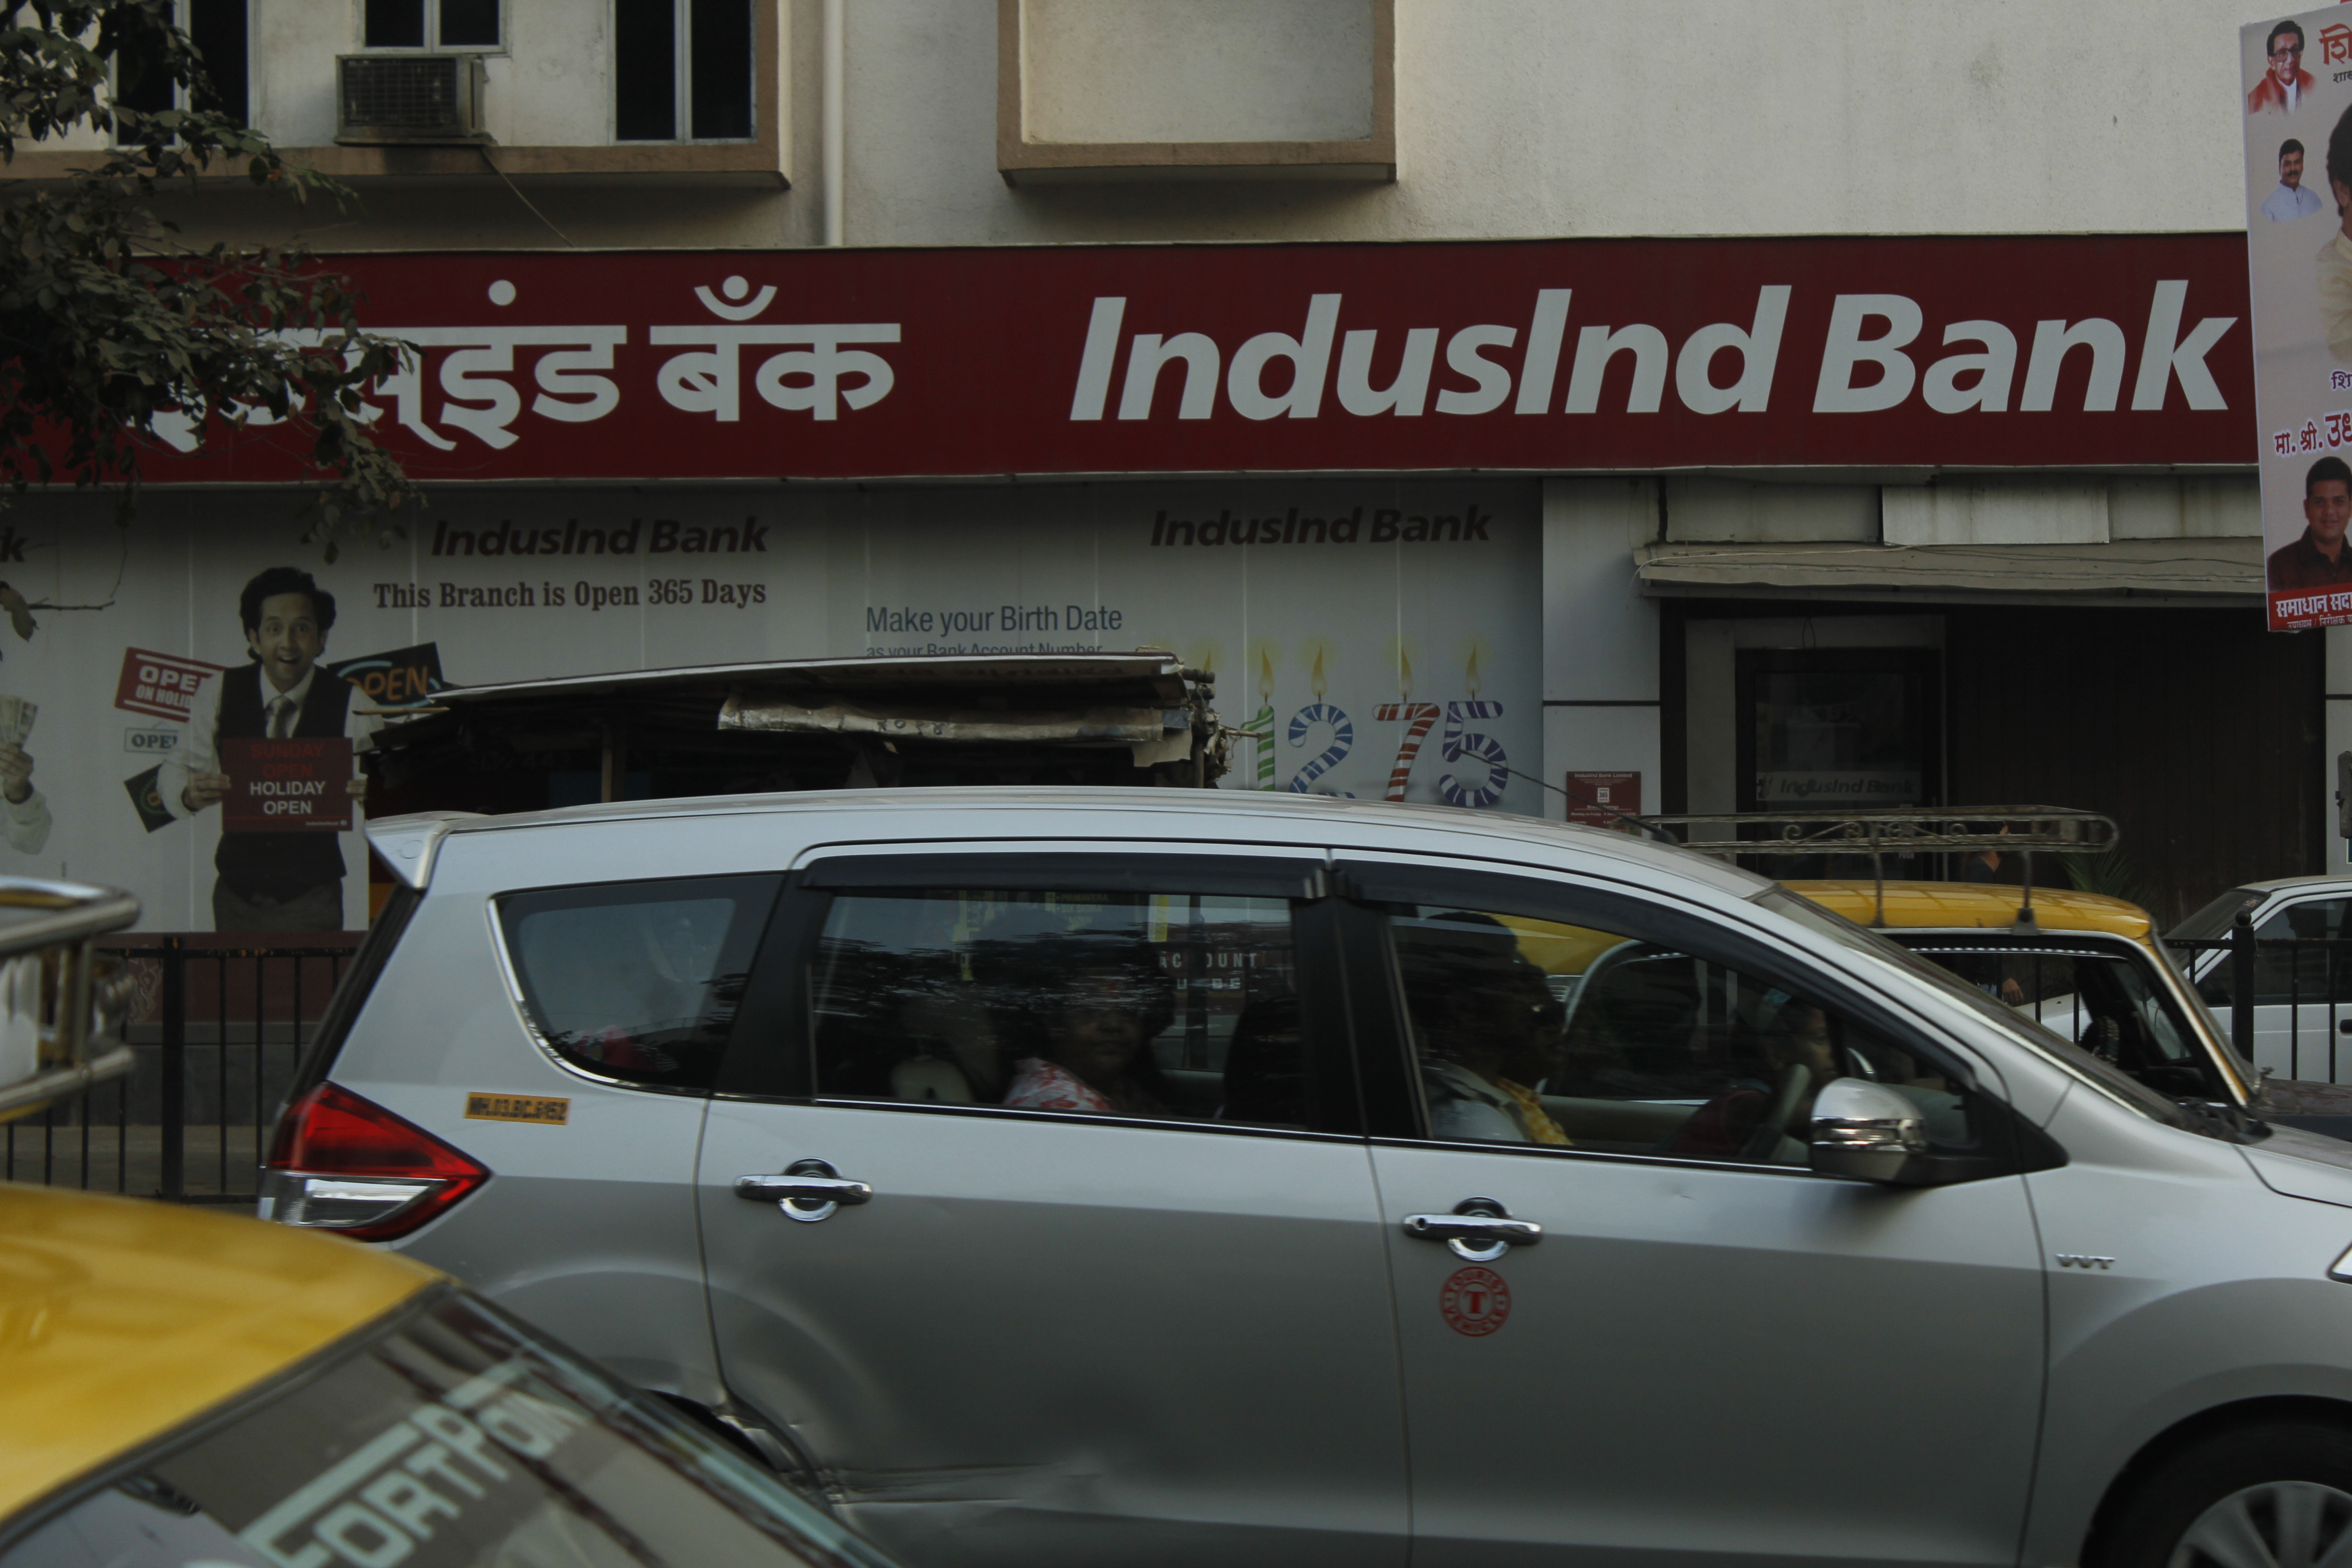
IndusInd Bank Ltd.'s third-quarter profit rose, in line with analysts' estimates, due to a rise in income from investments.
The private lender's net profit increased 17.2% year-on-year to Rs 2,301 crore in the October–December quarter, according to an exchange filing. Analysts polled by Bloomberg estimated a net profit of Rs 2,277 crore for the quarter.
The income from investments rose 31% year-on-year to Rs 1,589 crore in the December quarter, resulting in a jump in the total income of the private lender.
Poonawalla Fincorp Ltd.'s standalone net profit rose 76.3% in the third quarter of the current fiscal, meeting analysts' estimates.
The non-banking financial company's revenue increased 52.1% to Rs 762.61 crore, as against Rs 501.37 crore over the same period last year.
Here are the major quarterly results announced after market hours on Thursday:
IndusInd Bank Q3 FY24 (Consolidated, YoY)
NII at Rs 5,295.7 crore vs Rs 4,495.3 crore, up 17.8%.
Net profit at Rs 2,301.5 crore vs Rs 1,963.6 crore, up 17.2% (Bloomberg estimate: Rs 2,336.30 crore).
GNPA at 1.92% vs 1.93% (QoQ).
NNPA at 0.57% vs 0.57% (QoQ).
Accelya Solutions Q3 FY24 (Consolidated, QoQ)
Revenue at Rs 124.74 crore vs Rs 127.29 crore, down 2.01%.
Ebitda at Rs 38.38 crore vs Rs 40.63 crore, down 5.54%.
Margin at 30.76% vs 31.91%.
Net profit at Rs 30.93 crore vs Rs 31.52 crore, down 1.87%.
Board declared an interim dividend of Rs 25 per share.
Poonawalla Fincorp Q3 FY24 Highlights (Standalone, YoY)
Revenue at Rs 762.61 crore vs Rs 501.37 crore, up 52.1%.
Net profit at Rs 265.1 crore vs Rs 150.4 crore, up 76.3% (Bloomberg estimate: Rs 255.44 crore).
Gross NPA: 1.33% vs 1.36% (QoQ).
Net NPA: 0.70% vs 0.72% (QoQ).
Board approves interim dividend of Rs 2 per share.
Board approves fundraising of up to Rs 4,000 crore via NCDs.
IndiaMart InterMesh Q3 FY24 (Consolidated, YoY)
Revenue at Rs 305.3 crore vs Rs 251.4 crore, up 21.43% (Bloomberg estimate: Rs 308.47 crore).
Ebitda at Rs 85.7 crore vs Rs 70.2 crore, up 22.07% (Bloomberg estimate: Rs 85.4 crore).
Margin at 28.07% vs 27.92% (Bloomberg estimate: 27.7%).
Net profit at Rs 81.9 crore vs Rs 112.8 crore, down 27.39% (Bloomberg estimate: Rs 78.7 crore).
Home First Finance Q3 FY24 (YoY)
Revenue at Rs 296.3 crore vs Rs 205.4 crore, up 44.3%.
Net profit at Rs 78.8 crore vs Rs 58.7 crore, up 34.2%.
360 One WAM Q3 FY24 (Standalone, YoY)
Revenue at Rs 74.4 crore vs Rs 39.22 crore, up 89.69%.
Net profit at Rs 143.22 crore vs Rs 105.92 crore, up 35.21%.
Board declared dividend of Rs 4.5 per share.
Metro Brands Q3 FY24 (Consolidated, YoY)
Revenue at Rs 635.5 crore vs Rs 598.7 crore, up 6.1% (Bloomberg estimate: Rs 729.18 crore).
Ebitda at Rs 199 crore vs Rs 205.2 crore, down 3% (Bloomberg estimate: Rs 235.37 crore).
Margin at 31.31% vs 34.27% (Bloomberg estimate: 32.3%).
Net profit at Rs 98.8 crore vs Rs 113 crore, down 12.6% (Bloomberg estimate: Rs 126.63 crore).
Shoppers Stop Q3 FY24 (Consolidated, YoY)
Revenue at Rs 1,237.5 crore vs Rs 1,137.1 crore, up 8.8%.
Ebitda at Rs 217.5 crore vs Rs 212.8 crore, up 2.2%.
Margin at 17.57% vs 18.71%.
Net profit at Rs 36.9 crore vs Rs 62.7 crore, down 41.1%.
Supreme Petrochem Q3 FY24 (Consolidated, YoY)
Revenue at Rs 1,187.7 crore vs Rs 1,180.4 crore, up 0.6%.
Ebitda at Rs 94.87 crore vs Rs 119.26 crore, down 20.5%.
Margin at 7.98% vs 10.1%.
Net profit at Rs 67.7 crore vs Rs 89.8 crore, down 24.6%.
Innova Captab Q2 FY24 (Consolidated, YoY)
Revenue at Rs 282.9 crore vs Rs 242.2 crore, up 16.8%.
Ebitda at Rs 40.4 crore vs Rs 31.2 crore, up 29.5%.
Margin at 14.28% vs 12.88%.
Net profit at Rs 22.9 crore vs Rs 18.7 crore, up 22.5%.
Finolex Industries Q3 FY24 (Consolidated, YoY)
Revenue at Rs 1,019.7 crore vs Rs 1,124.8 crore, down 9.4% (Bloomberg estimate: Rs 1,108.96 crore).
Ebitda at Rs 119.98 crore vs Rs 91.89 crore, up 30.6% (Bloomberg estimate: Rs 156.3 crore).
Margin at 11.76% vs 8.16% (Bloomberg estimate: 14.1%).
Net profit at Rs 95.4 crore vs Rs 79.5 crore, up 20% (Bloomberg estimate: Rs 125.1 crore).
Essential Business Intelligence, Sharp Market Insights, Practical Personal Finance Advice, Daily Fuel, Gold and Silver Prices and Latest Stories — On NDTV Profit.