Every asset class is cyclical in terms of performance, which is influenced by both global and domestic factors. No single asset class can be the top performer for a prolonged period of time. Winners keep changing!
Our analysis of the performance of different asset classes (in INR terms) across a few market cycles shows interesting results.
Asset Classes considered were Equity-India, Equity-U.S., Debt-Long Term, Debt-Short Term, and Gold.
Time Period: 1993–1996
Equity-India was the best performer in the initial half with absolute returns of 28% in calendar year 1993 and 17% in CY94.
In CY95 though, Equity-India fell 21% and was flat in CY96. In contrast, Equity-U.S. delivered 50% in CY95 and 23% in CY96.
For the full period of CY93–96, Equity-U.S. was the top performer with 20% compound annual growth rate, while Equity-India was the worst performer with 4% CAGR.
Time Period: 2001–2004
Post the dot-com bubble burst in 2000, equity markets bore the impact in CY01 with Equity-India at -18% and Equity-U.S. at -10%, while the top performer was Debt-Long Term at 8.5%.
In CY02, Equity-U.S. saw a large correction at -24%, Equity-India was flat, gold was the top performer at 24%.
Equity-India rebounded dramatically in CY03 and CY04 with returns of 72% and 11%, respectively.
Consequently, for the full period of CY01–04, Equity-India was the top performer with 12.5% CAGR, followed by gold at 11% CAGR, while the worst performer was Equity-U.S. at -4%.
Time Period: 2018–2021
In CY18, gold was the top performing asset class at 7%, while both equity markets, India and U.S. were flat.
Gold topped the chart even during the pandemic year of CY20 at 28% return.
However, with the subsequent rebound in equity markets, for the full period CY18-21, Equity-U.S. was the top performer with 18% CAGR, followed by Equity-India at 16% CAGR, while gold returned 11% CAGR.
The above analysis clearly highlights the need for portfolio 'diversification' since:
Equity has the ability to deliver superior compounding of returns over long term, but can have significant corrections in the interim.
Gold is a value addition to a portfolio of risk assets as it acts as a hedge during extreme volatility.
Debt or fixed income, over most cycles, tends to provide steady returns with low volatility.
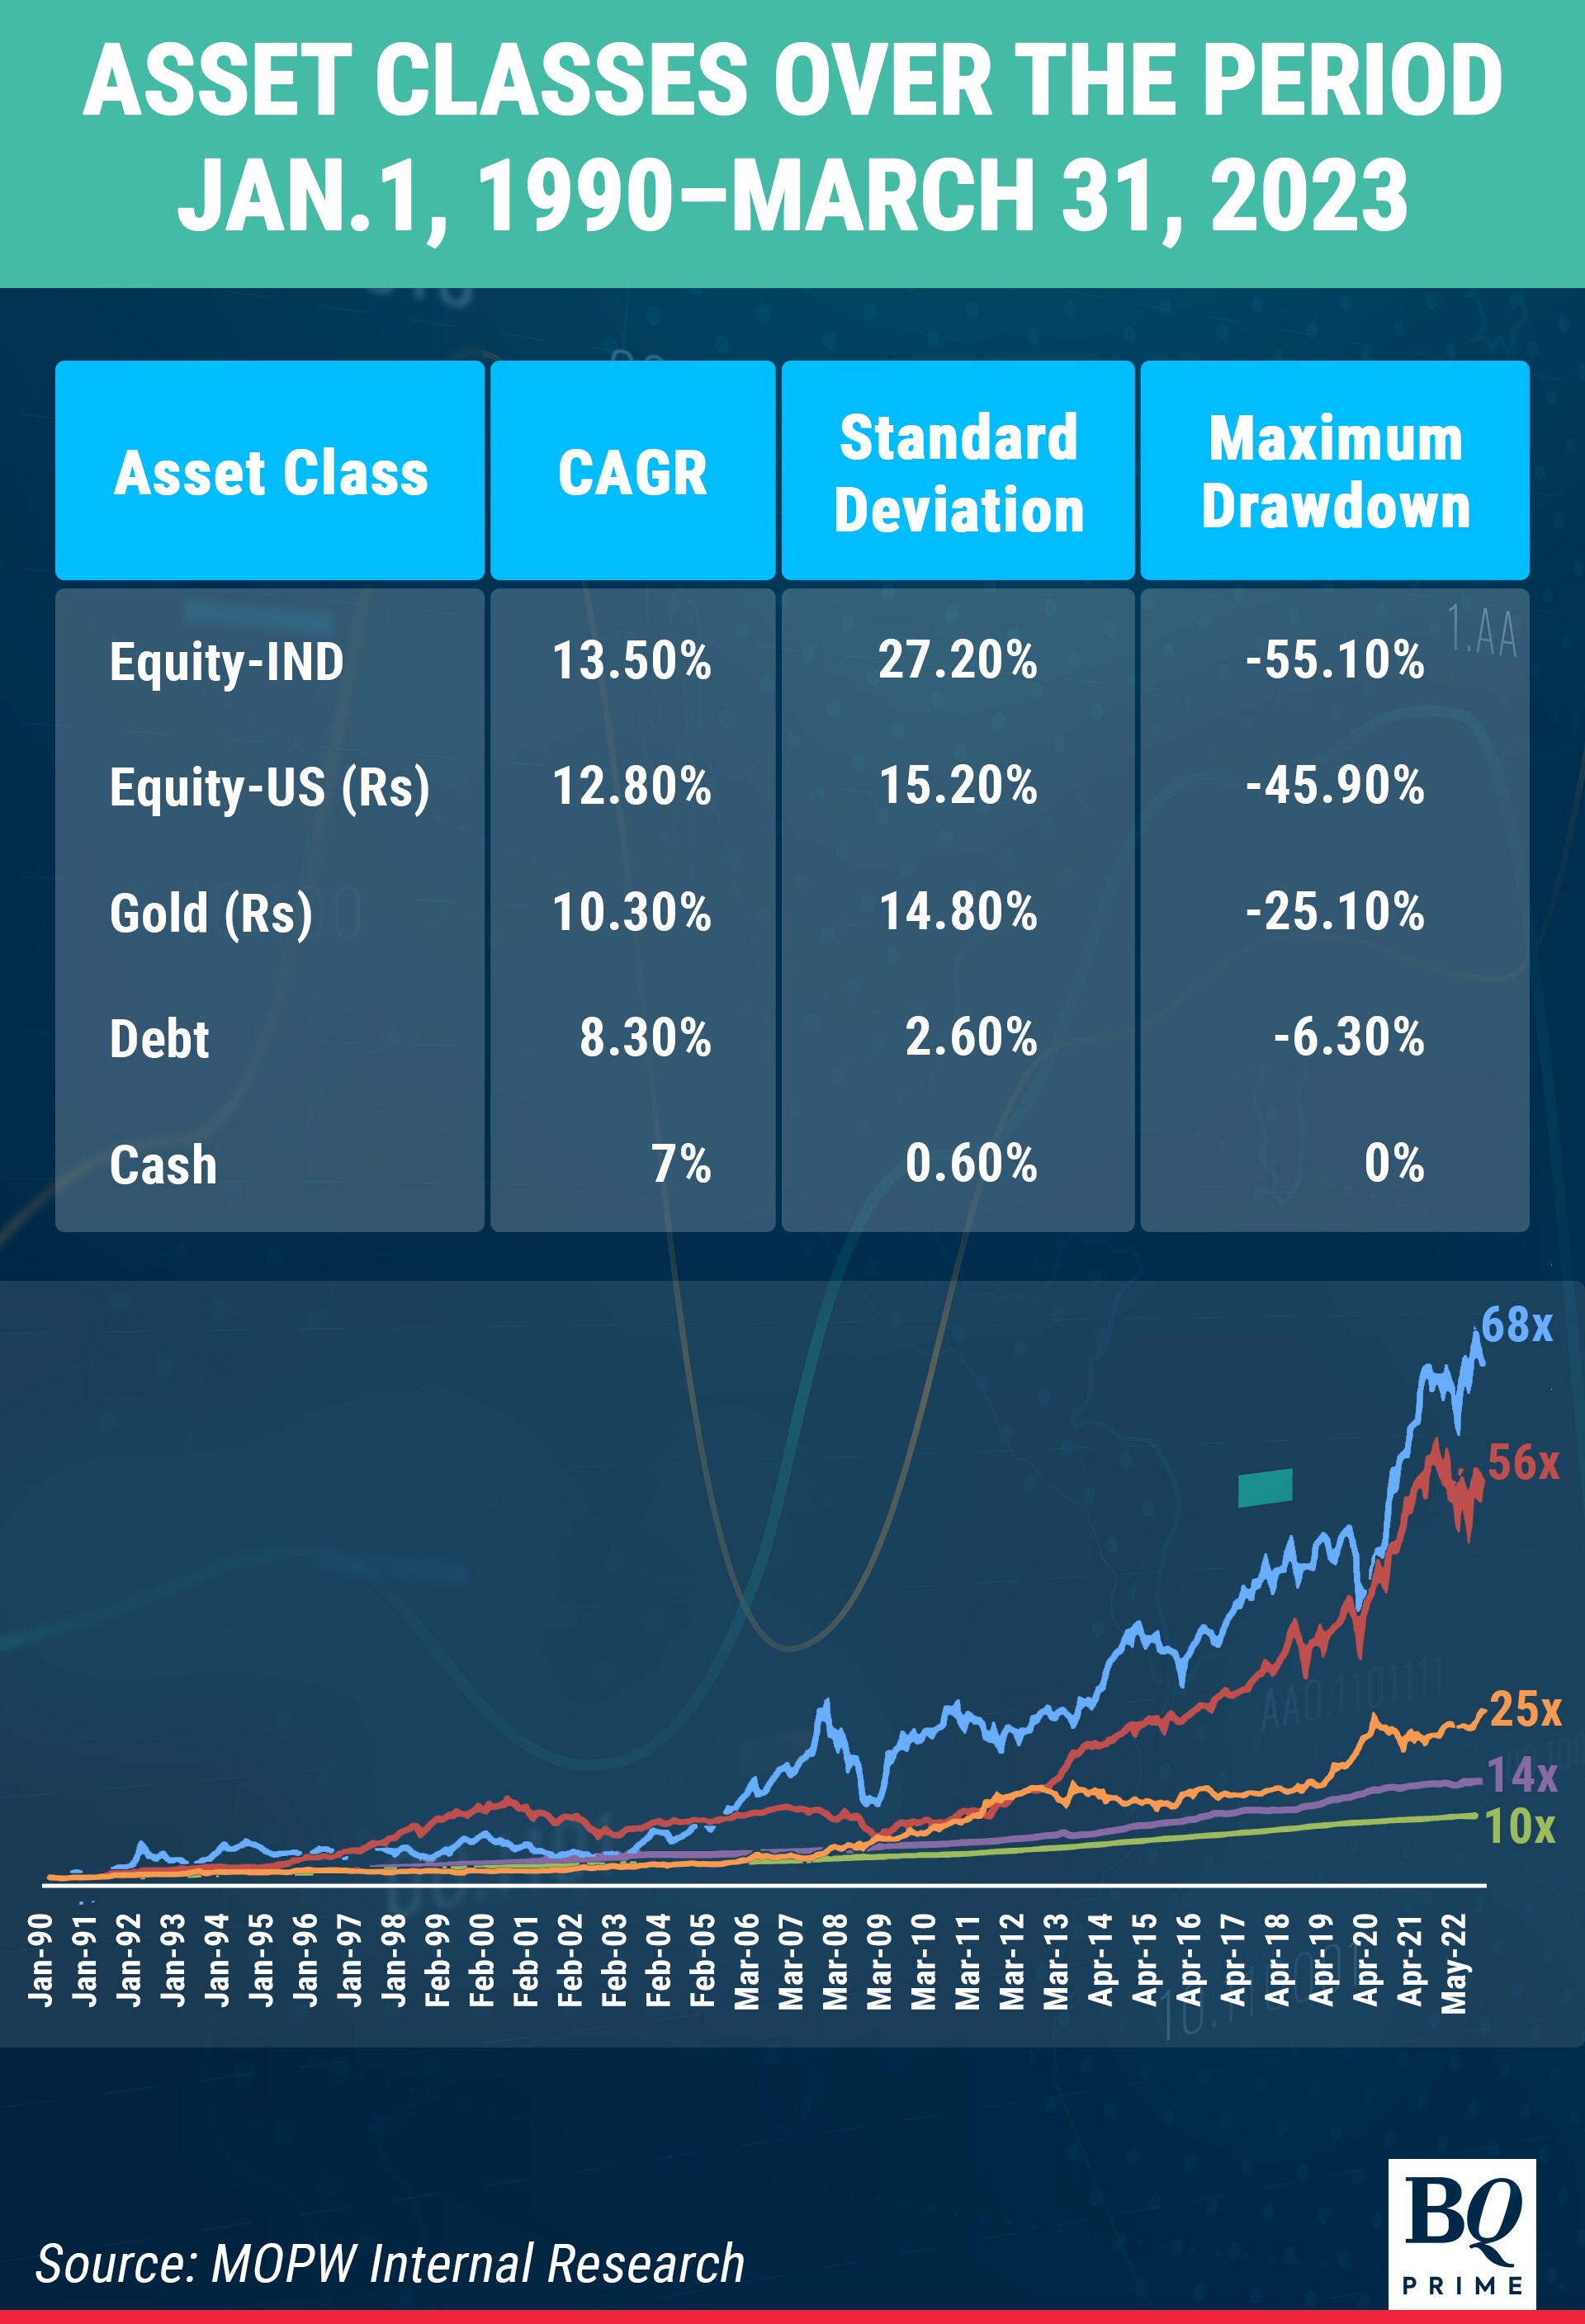
The chart below shows the characteristic of the aforementioned asset classes for period Jan. 1, 1990–March 31, 2023.
Maximum drawdown is the highest correction that the respective asset class has witnessed from peak to trough before recovery.
See note at the end of the article
The essence of an "All Weather Strategy" is that it uses the principle of 'portfolio diversification' across multiple asset classes in combination with a 'rule-based approach' to investing.
All Weather strategies are designed to:
Have a disciplined and systematic approach, which keeps emotions and human behaviour away.
Deliver superior risk-adjusted performance in the long run.
Navigate through the vagaries of market cycles.
One such All Weather Strategy can be created using Equity-India, Equity-U.S., Debt-Long Term, Debt-Short Term, and Gold. The rule is to have active asset allocation based on a proprietary valuation framework with annual rebalancing at the end of each calendar year. Such strategy can be a 'superior alternative to fixed Income'.
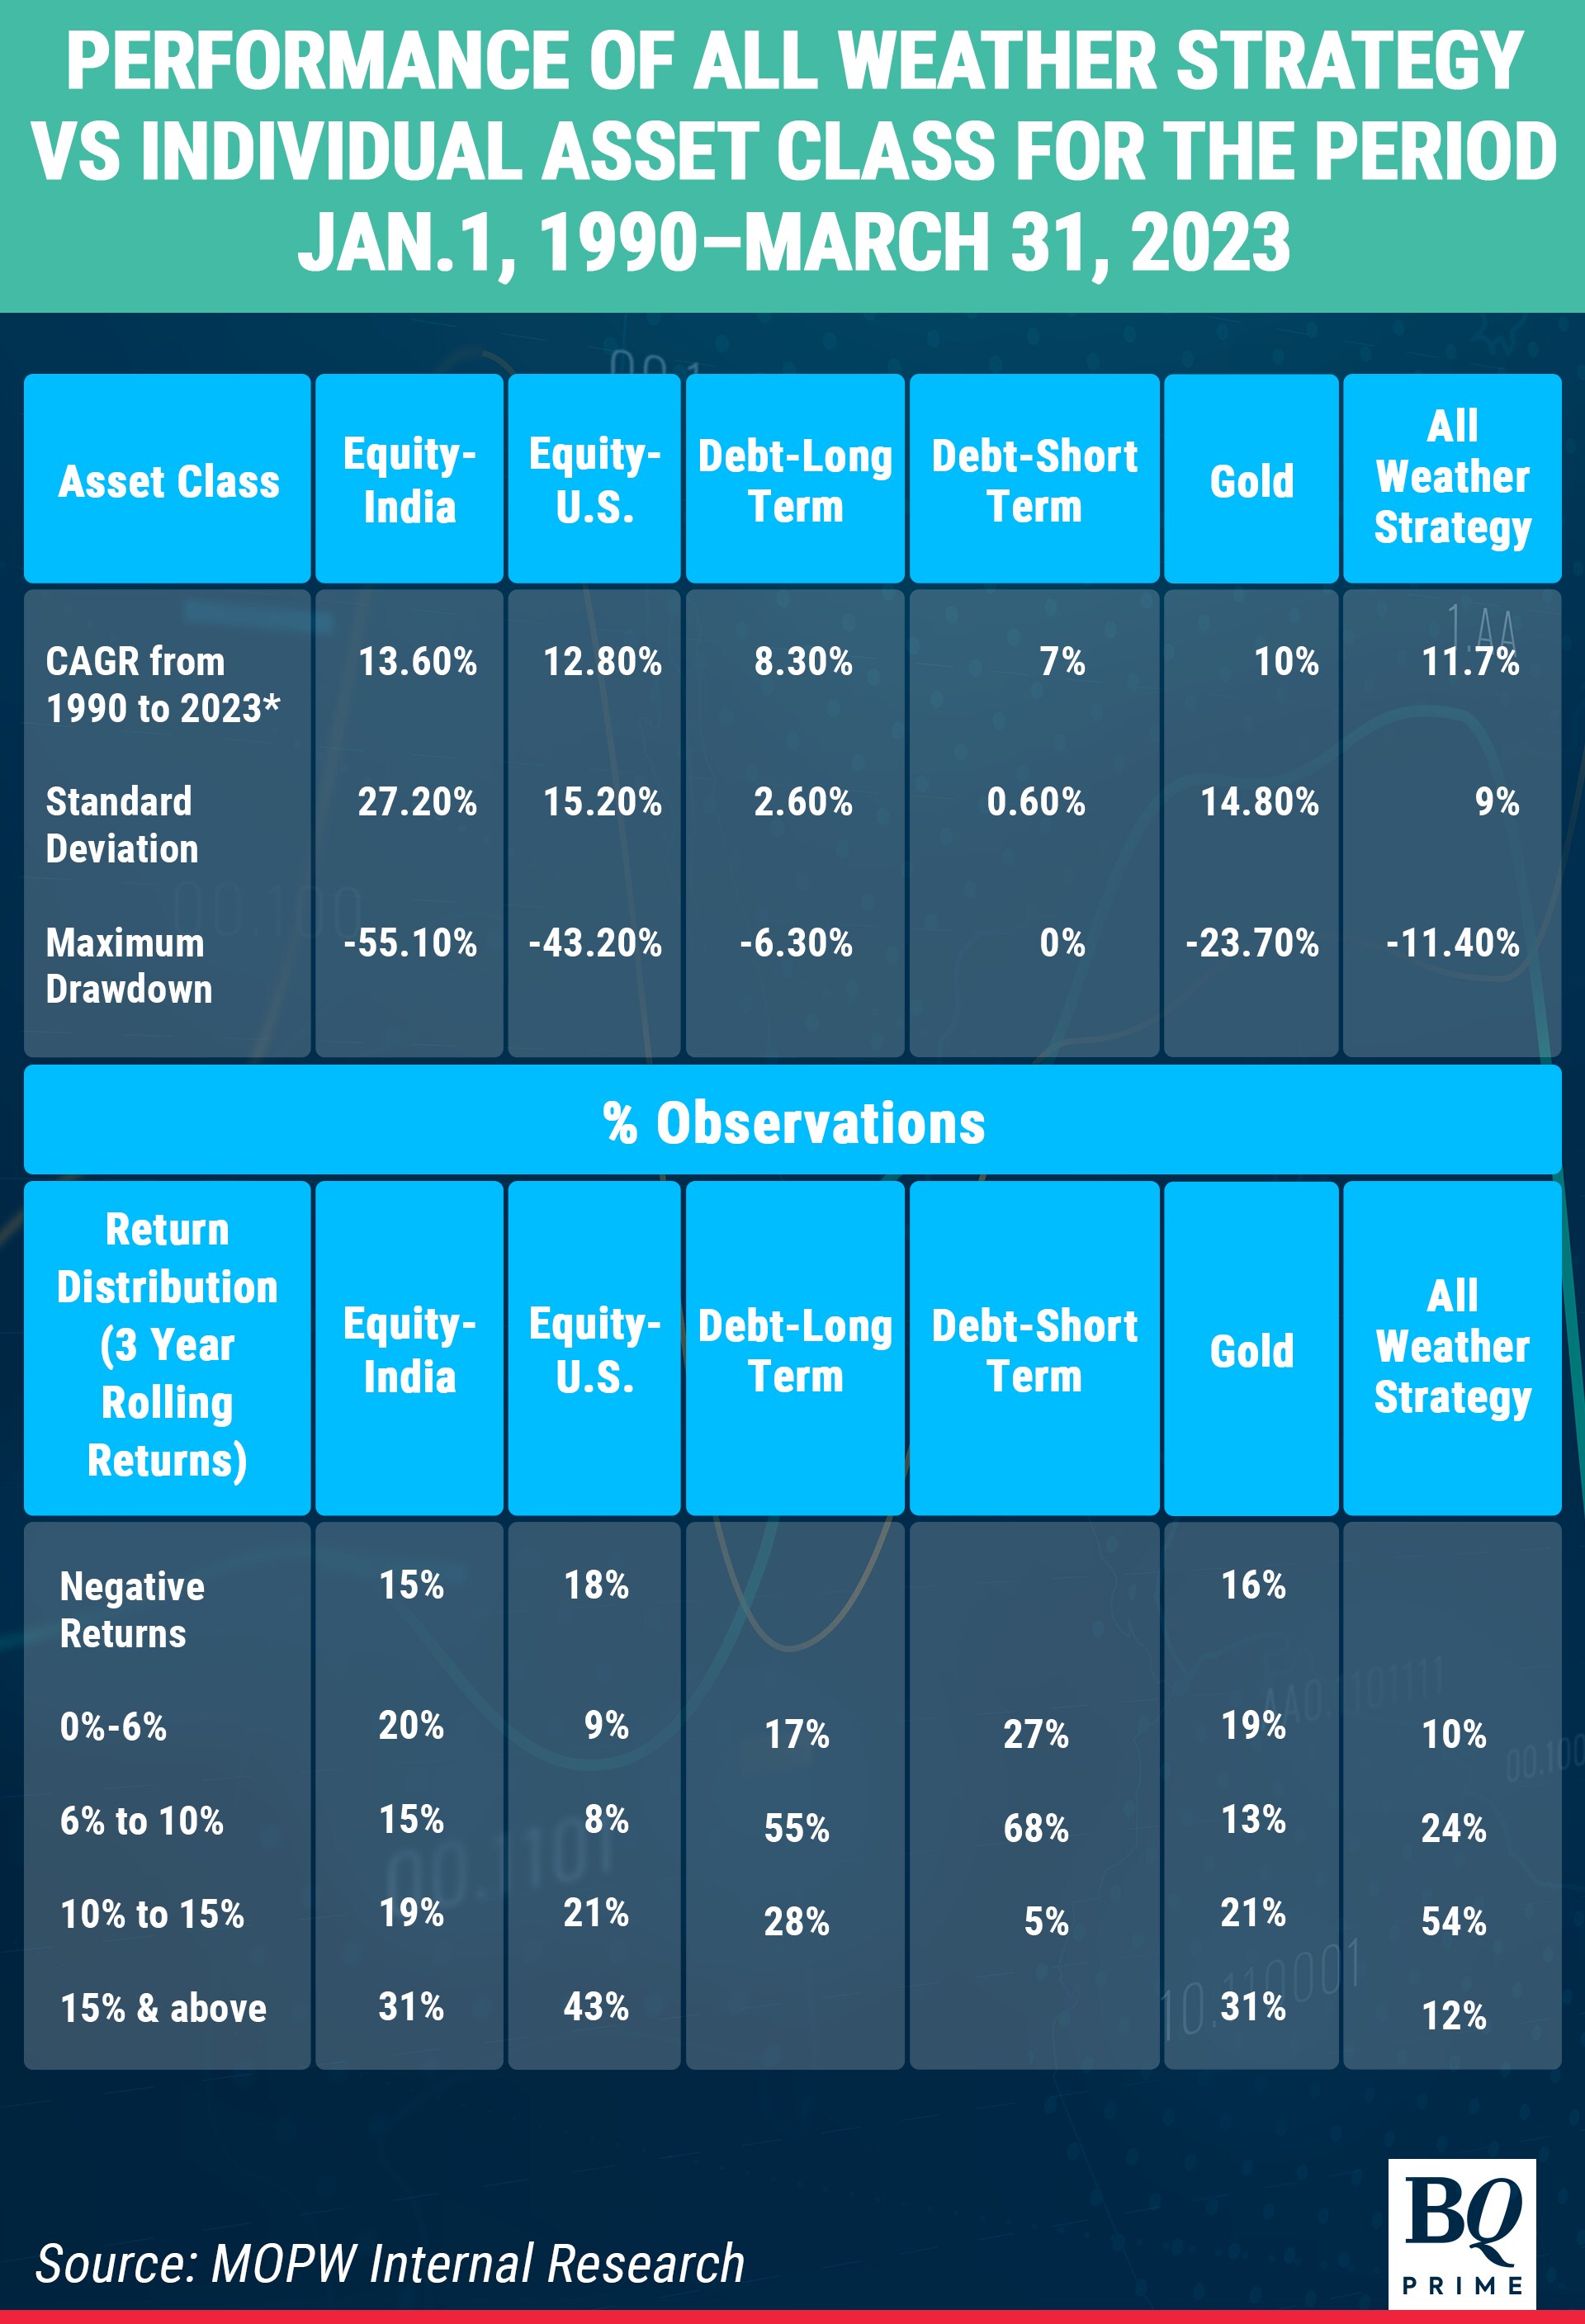
The exhibit below shows the performance of the All Weather Strategy in comparison with each individual asset class for the period between Jan 1, 1990 and March 31, 2023.
See note at the end of the article
Analysis of the top half of the exhibit shows that the All Weather Strategy has:
Reasonably outperformed Debt-Long Term.
Standard deviation or volatility is less than one-third that of Equity-India and almost half that of either Equity-U.S. and gold.
Maximum drawdown (fall from peak to trough before recovery) is in line with debt and far lower than equity.
For any three-year rolling return period over the last 30 years, the All Weather Strategy shows:
No negative return observations
90% of observations beating 6% CAGR, which is the risk-free rate (denoted by the 10-year G-Sec).
Almost two-third of observations generating a double digit CAGR.
All of the above with volatility, which is less than one third of the volatility of domestic equity market.
FY23 was an eventful year in terms of change in taxation for various fixed income instruments, most importantly for Debt Mutual Funds. For any incremental investments in Debt mutual funds effective April 1, 2023 onwards, any capital gain that is realised at the time of redemption will be subject to short-term capital gains tax at maximum marginal rate for the investment entity.
Hence, incremental allocation to fixed income portfolios needs to evolve to achieve optimum risk reward on a post-tax basis. Consequently, traditional asset allocation in financial assets will also need to evolve beyond pure equity and fixed income to include multi-asset investment solutions, vindicating the requirement for All Weather strategies.
Ashish Shanker is Managing Director and Chief Executive Officer at Motilal Oswal Private Wealth and Nitin Shanbhag is Head of Investment Products on Multi-asset Investment Framework.
The views expressed here are those of the author, and do not necessarily represent the views of BQ Prime or its editorial team.
Notes:
Equity-IND is represented by Sensex from 1990 to 2002 and Nifty 50 from 2002 onwards; Debt-Long Term is represented by SBI 1-yr FD rates from 1990 to 2002 and CRISIL Composite bond Index from 2002 onwards; Debt-Short Term is represented by SBI 3-month FD rates from 1990 to 2002 and CRISIL Liquid fund Index from 2002 onwards; Gold is represented by Gold USD Spot Price conversion into INR from 1990 to 2005 and MCX Spot Gold price in INR from 2006 till date; Equity-US is represented by S&P 500 in INR terms; Source: AceMF; Bloomberg.
Note for Chart 1: Cash is proxy for Debt-Short Term. Maximum drawdown is the highest correction that the respective asset class has witnessed from peak to trough before recovery.
Note for Chart 2, CAGR from 1990 to 2023 is till March 31, 2023. Returns shown are pre-tax. Rolling returns are on a monthly basis and returns shown are pre-tax.
Essential Business Intelligence, Continuous LIVE TV, Sharp Market Insights, Practical Personal Finance Advice and Latest Stories — On NDTV Profit.