
Granules India is showing signs of a potential breakout from a nine-week flat base, with the stock closing above a downward-sloping trendline resistance and recording its highest close since Aug. 7. Above-average trading volumes over the past three sessions and stronger momentum indicators add to the setup.
A sustained move above Rs 873-875 could confirm the breakout and open the way towards Rs 910, the stock's previous all-time high. A closing stop-loss can be maintained at Rs 830. A decisive move above Rs 910 could put Rs 950 and Rs 1,034 in focus.
Granules Setup
Granules India is trading above all its key moving averages, while its moving average ribbon continues to trend upwards. Momentum indicators have also strengthened.
Also Read | Layoffs Are Rising In Tech, But These Skills Are Helping People Unlock Better Pay
The MACD has generated a fresh bullish signal, while the Elder Impulse System has formed a strong bullish candle.
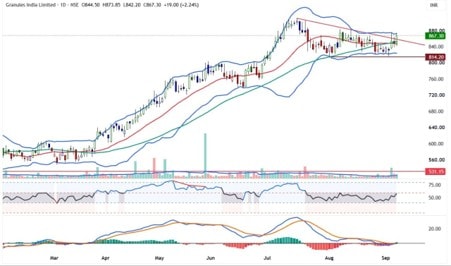
The stock's Relative Strength Rating stands at 85, indicating strong price performance compared with the broader universe of listed stocks. Trading volumes have remained above average for the past three sessions.
A sustained move above Rs 873-875 could confirm the flat-base breakout and open the way towards Rs 910. A closing stop-loss can be maintained at Rs 830.
If the stock moves decisively above Rs 910, the next upside levels to watch are Rs 950 and Rs 1,034.
Nifty View
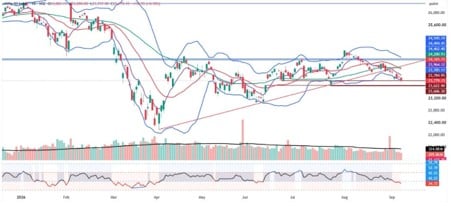
The Nifty resumed its decline on Monday, Sept. 7, after a modest pullback on Friday. The index opened about 14 points lower and remained under pressure for most of the session, falling 118.35 points to close at 23,779.15.
Selling pressure took the index to an intraday low of 23,737.90. A mild recovery during the Closing Auction Session helped reduce the losses, but the index remained weak.
The Nifty has now corrected by more than 1,000 points from its early-August swing high of 24,774 to Monday's low.
Monday's price action formed a bearish candle with a lower high and lower low compared with the previous session, keeping the short-term structure weak.
Bearish Crossover
The 20-DMA slipped below the 50-DMA on Monday, adding to the weakness in the short-term setup. The 100-DMA has also started to flatten, indicating that the medium-term trend is losing strength.
The index is trading below its key short-, medium- and long-term moving averages. Attempts to recover during the session have repeatedly struggled to hold at higher levels.
Key Support
The Nifty's next important support is around 23,721, which corresponds to the 61.8% Fibonacci retracement of the rally from the June low to the August high.
If the Nifty holds 23,721, some short-covering or a technical pullback could follow. A decisive break below the level could weaken the structure further and expose the index to the July swing low near 23,606.
Resistance Zone
On the upside, 23,900 is the first hurdle. The Nifty has already slipped below the earlier 23,900-24,000 support zone, which could now act as resistance during recovery attempts.
A sustained move above 23,900 could allow the index to extend a pullback towards the 100-DMA, currently near 24,023.
For the technical picture to improve meaningfully, the index needs to reclaim and hold above the 100-DMA. Until then, moves towards the 23,900-24,023 zone could continue to face selling pressure.
Tuesday View
The near-term setup remains weak as the Nifty continues to form lower highs and lower lows while trading below its key moving averages.
For Tuesday, 23,721 is the immediate support to watch. A break below it could expose the index to 23,606, while a recovery above 23,900 could trigger a pullback towards 24,023.
As long as the Nifty remains below the 23,900-24,023 resistance zone, sellers could retain the upper hand on rallies.
Essential Business Intelligence, Sharp Market Insights, Practical Personal Finance Advice, Daily Fuel, Gold and Silver Prices and Latest Stories — On NDTV Profit.