The stock market was expected to rise after the general election. But technical indicators suggest a correction.
That's according to Gautam Shah, associate director and technical analyst at JM Financial Ltd. “The market is losing momentum,” he said at the Bengaluru edition of BQ Edge, BloombergQuint's on-ground initiative. The benchmark Nifty Index, Shah said, possibly could drop 10 percent in the short-term.
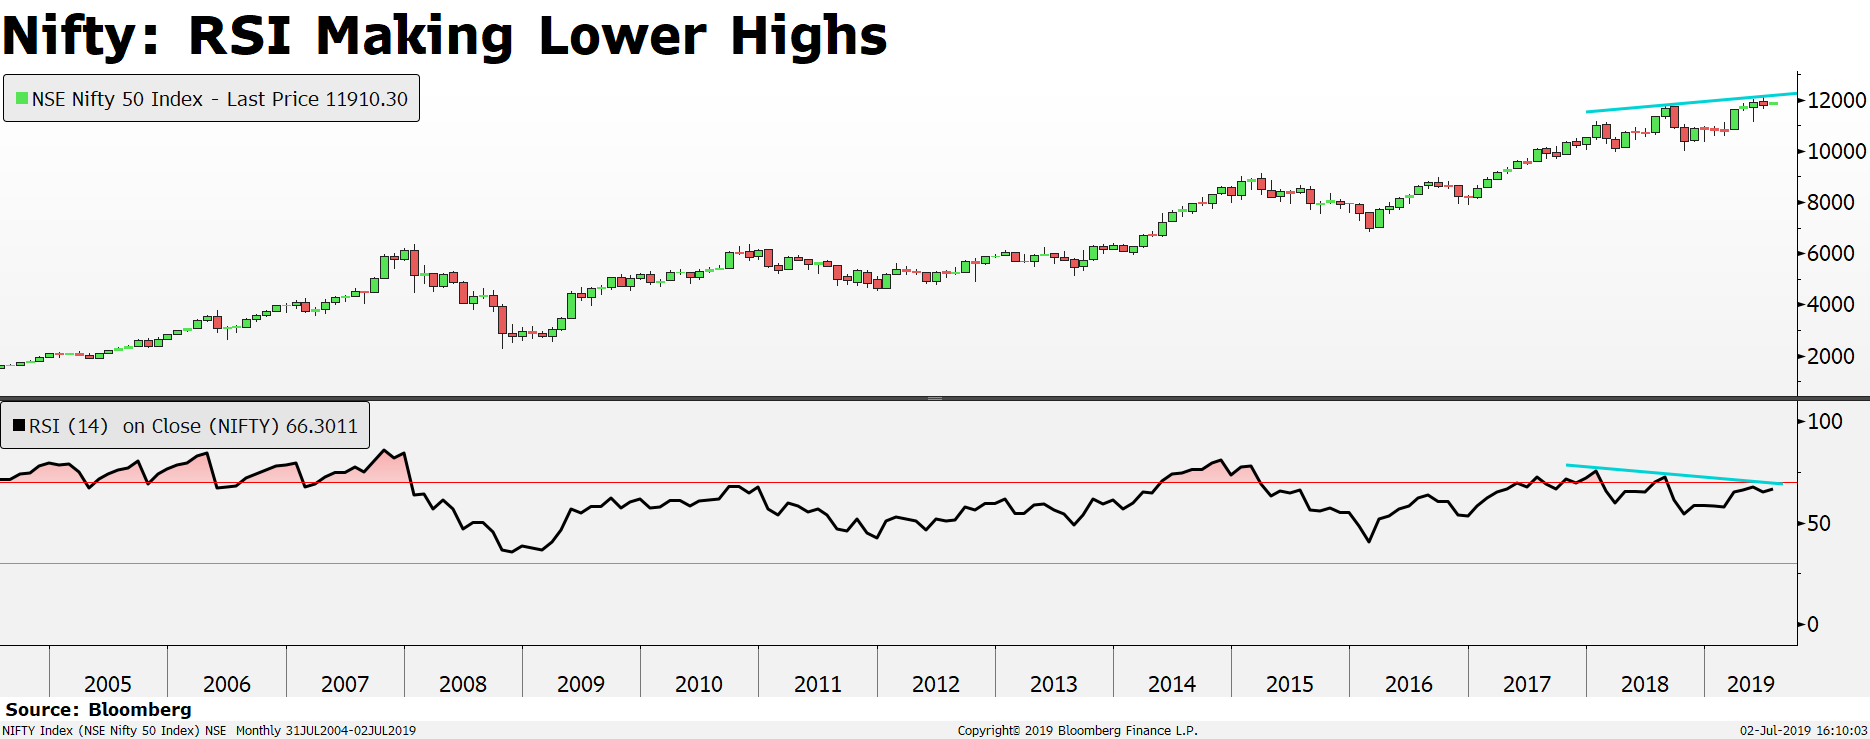
“While the Nifty has made thee higher highs (11,000 11,800 and 12,100) in the last 12 months, the Relative Strength Index or the RSI on the monthly time frame has made three lower highs,” he said, referring to a pattern of declining peaks formed by a chart. “Typically, when you have three consecutive lower highs, it is an indication of the markets losing momentum.”
Shah doesn't expect Nifty to sustain at elevated levels of 12,000 and beyond. “The index has a strong support around the 11,600 mark which once violated could trigger a move down to 11,400 and thereafter 11,000.”
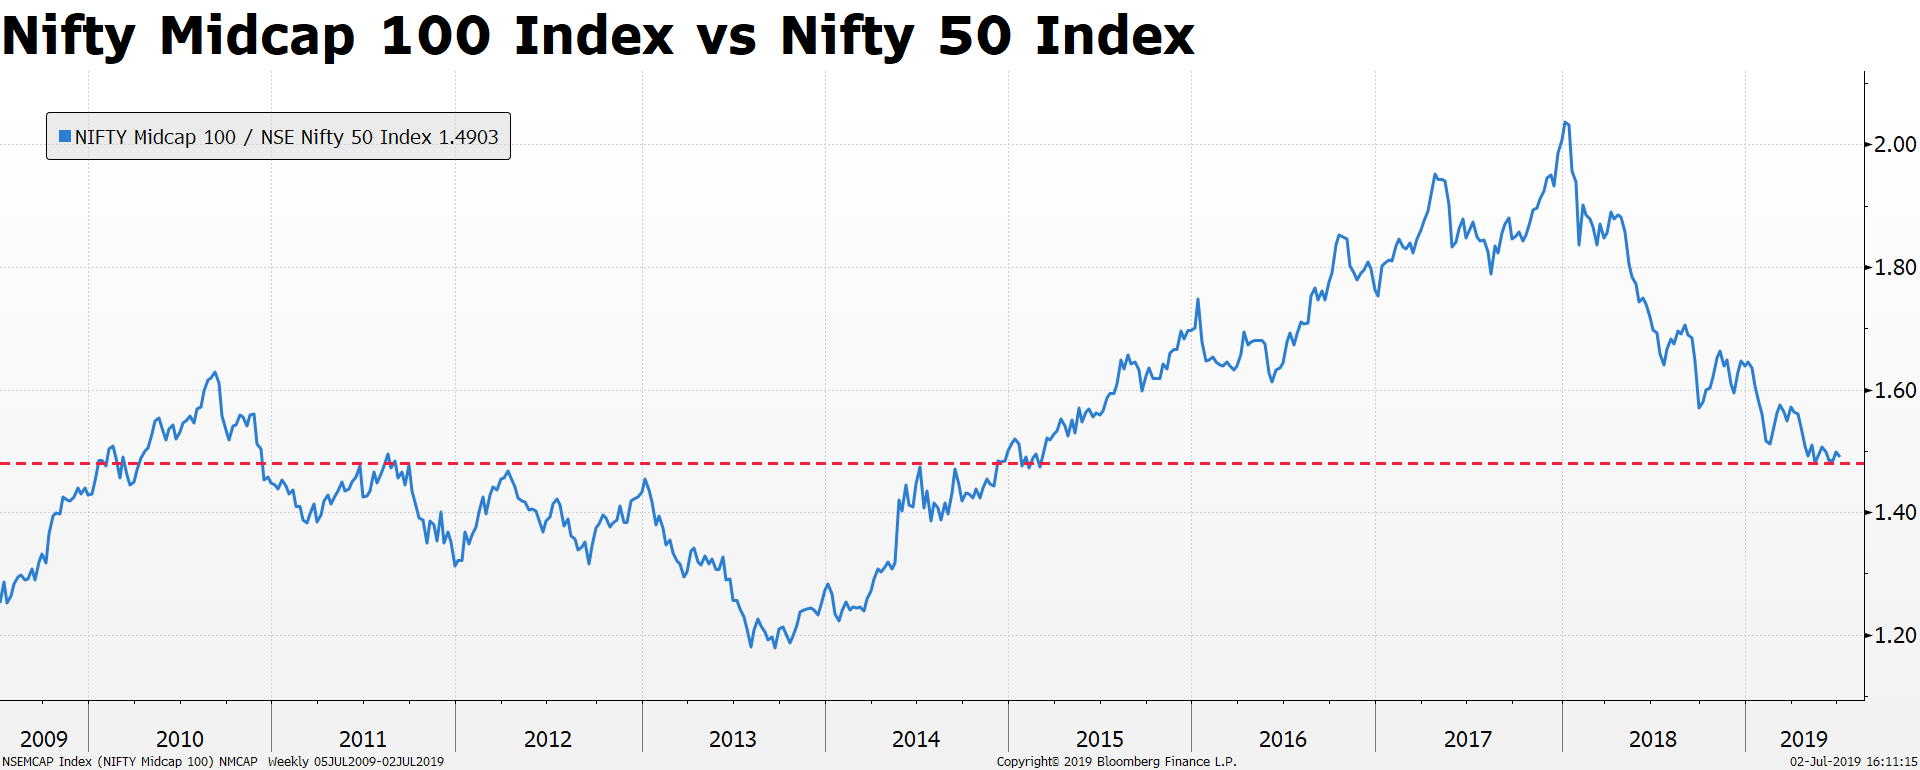
Shah said the ratio of the Nifty Midcap Index— it's performance compared to Nifty 50—is at a level where long-term bottoms have been seen. That indicates a probability of an upside and a possible role reversal with mid caps outperforming their larger peers, he said.
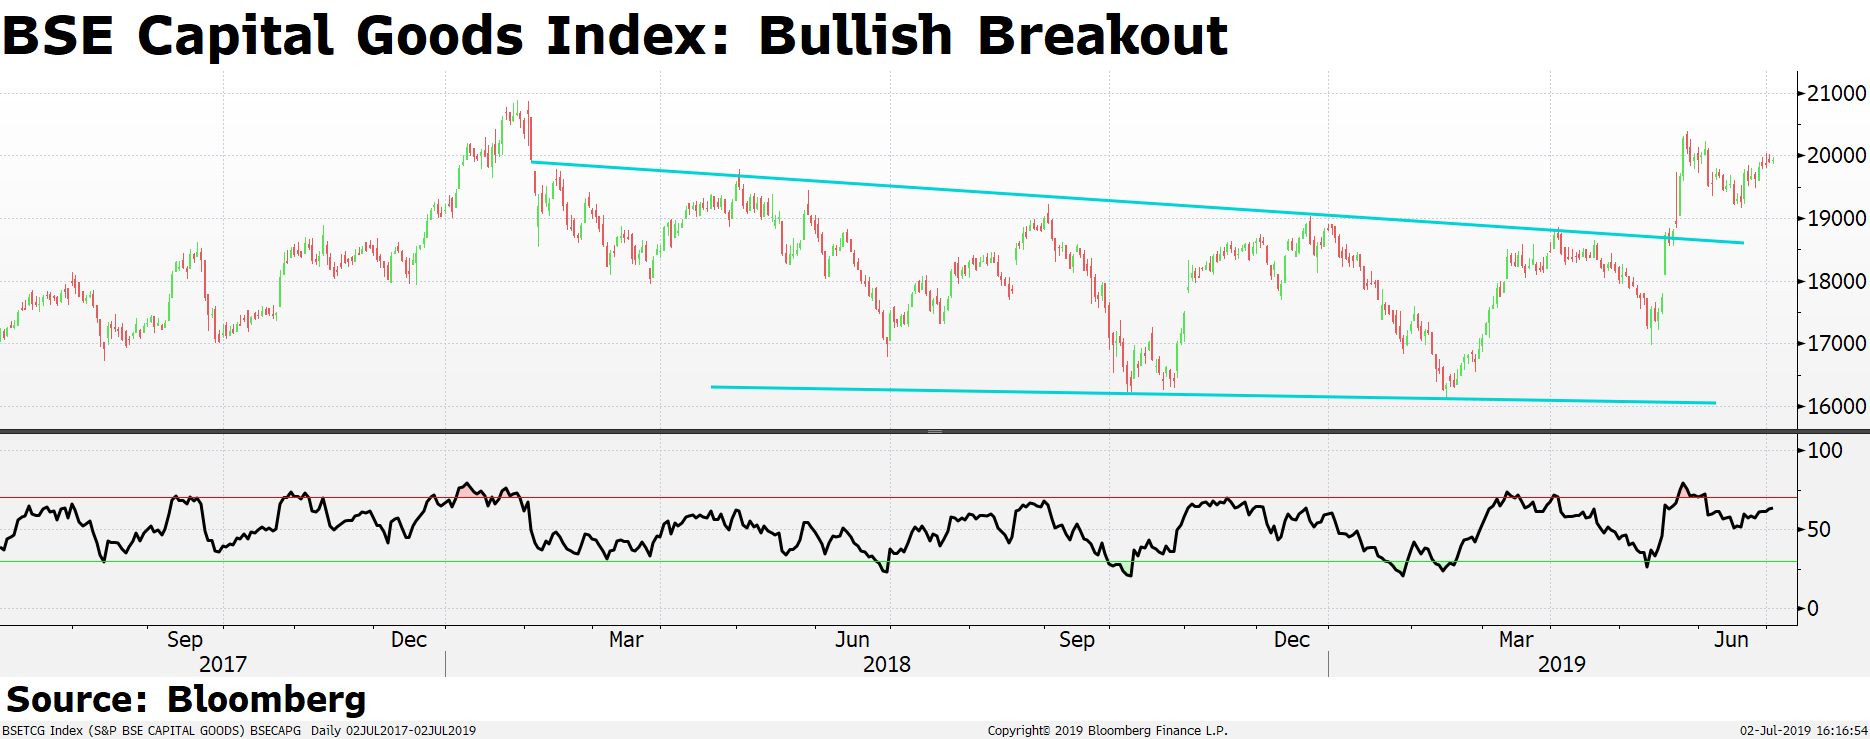
The Capital Goods Index, he said, remained largely insulated from the fall of 2018 and is currently trading at a 52-week high. “This is one space that could do exceedingly well.”
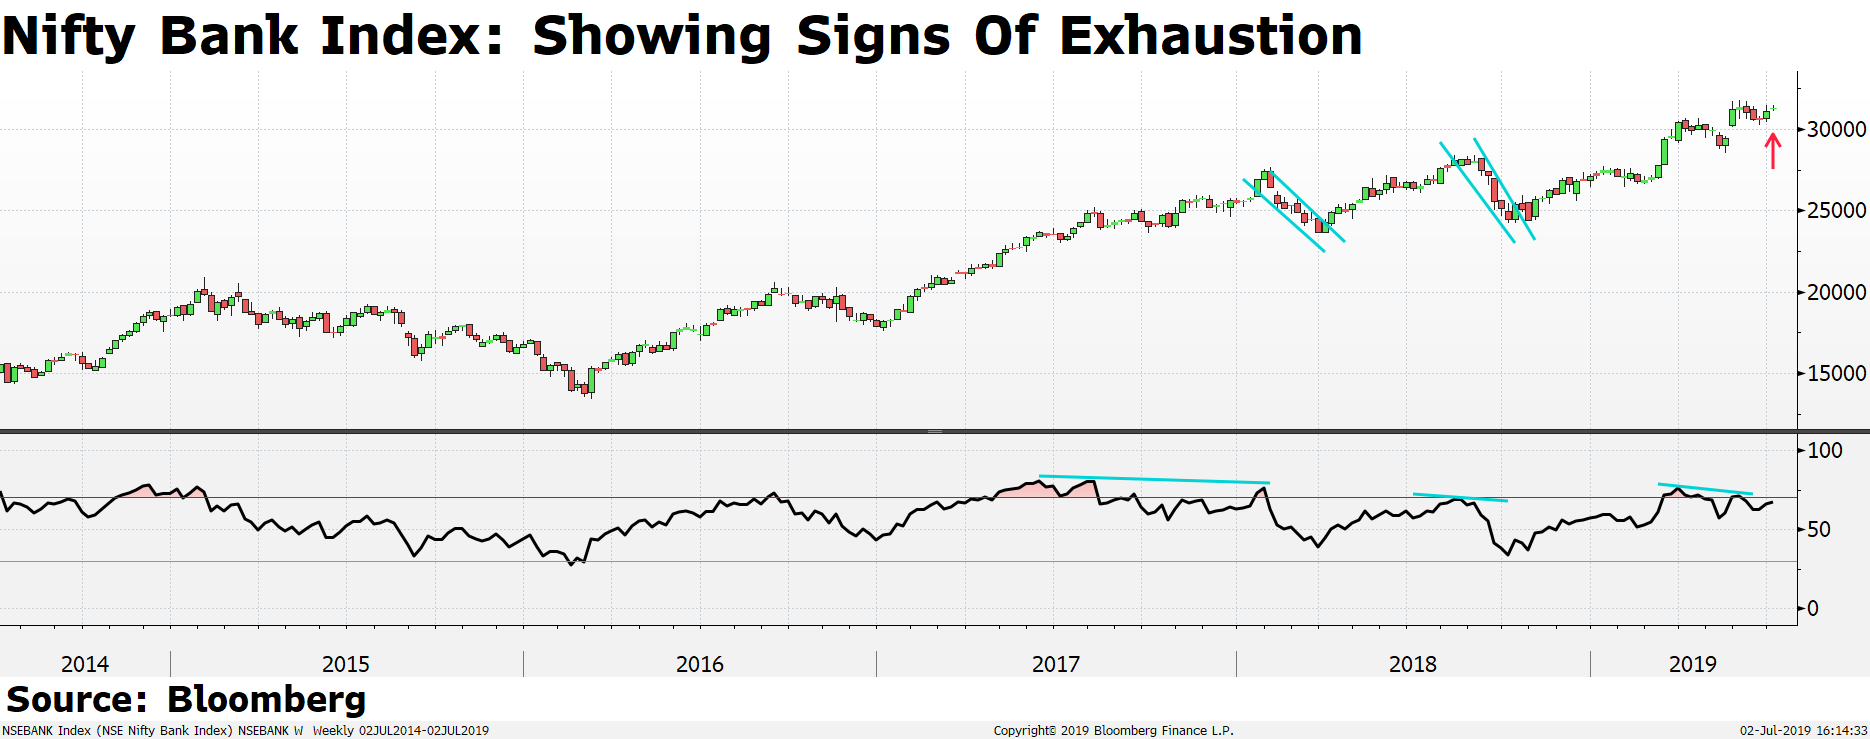
The Nifty Bank Index has fallen nearly 10 percent many times in the past when the Relative Strength Index indicated a negative divergence or the RSI falling even as the index rises, Shah said, showing that it's a precursor to a correction. “At present, the charts indicate a negative divergence developing which is not a good sign.”
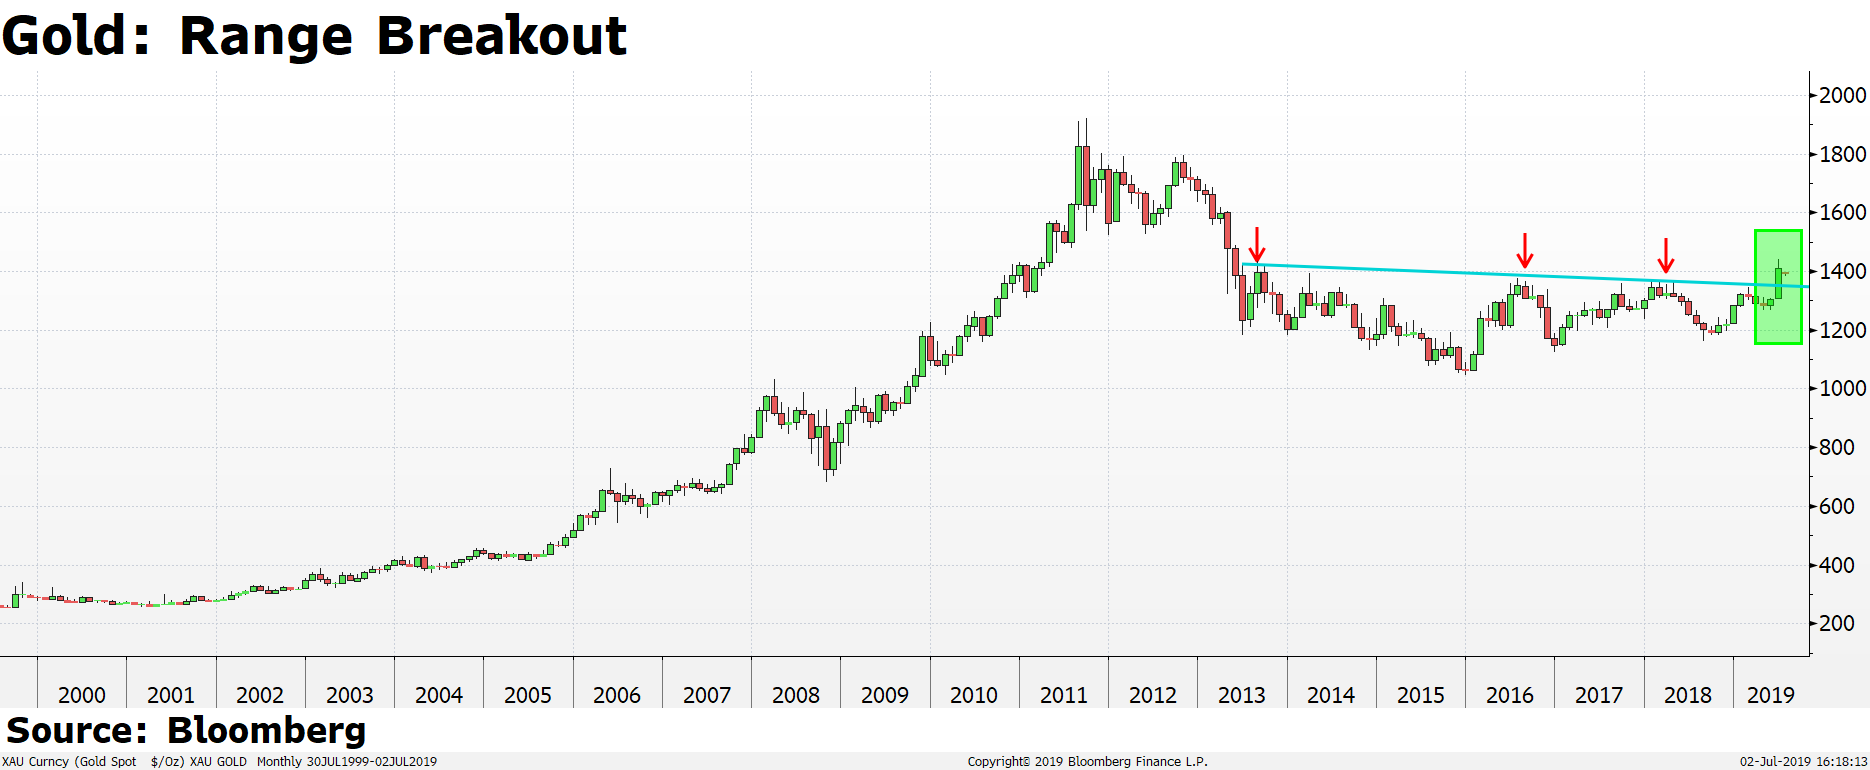
Gold, another potential indicator for the equity market, breached the $1,350 per ounce mark after trading in a range for five years, he said. This, according to him, could mean that money is moving out from equities as investors look for a safe haven and could potentially trigger a 20 percent rally in the precious metal.
Watch the video here
Essential Business Intelligence, Continuous LIVE TV, Sharp Market Insights, Practical Personal Finance Advice and Latest Stories — On NDTV Profit.