
The Nifty 50 may attempt a recovery towards the 24,000 mark this week after finding buying support near key technical levels on Friday, although the broader short-term trend remains under pressure.
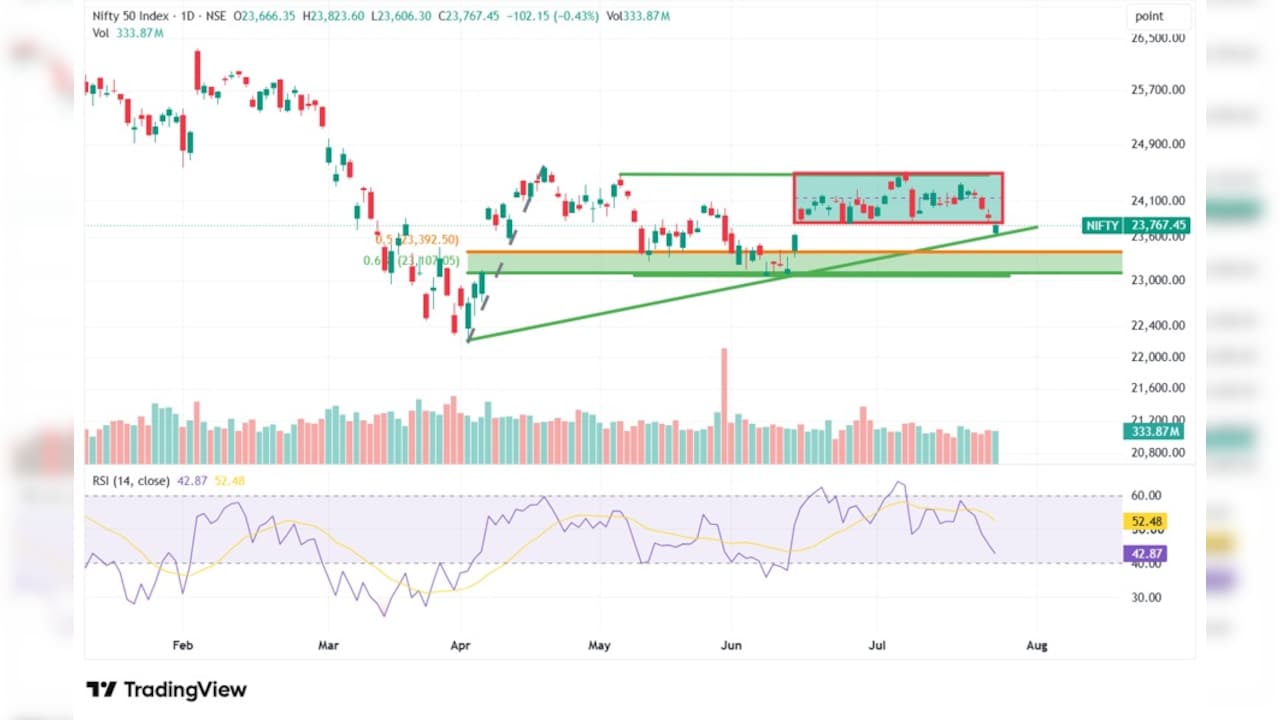
The benchmark index recovered nearly 160 points from its intraday low after buyers emerged around the June 15 gap support and the rising trendline drawn from the April 2 low. Even so, the Nifty ended Friday down 0.43% and lost 2.33% for the week, marking one of its steepest weekly declines since the second week of March.
The index has slipped below its recent trading range, but support around the 20-week moving average, the June 15 gap and the rising trendline could influence trading in the sessions ahead. Resistance is seen near 23,851 and 24,000, while a break below 23,600 could expose the index to further downside.
Also Read | Layoffs Are Rising In Tech, But These Skills Are Helping People Unlock Better Pay
Support Zone
The Nifty opened lower on Friday and fell below the range that had held for nearly five weeks. The decline also filled the gap created on June 15 before buying interest returned near the gap support and the rising trendline from the April 2 low.
On the daily chart, the index formed a green-bodied candle after recovering from the day's low and closing above its opening level, indicating buying interest around an important support area.
However, the short-term trend remains weak as the index continues to form lower highs and lower lows. Friday's rebound, therefore, signals support rather than confirming a change in trend.
Resistance Ahead
The Nifty closed below both its 10-week and 50-day moving averages, while the 20-day moving average has started to slope lower. Bollinger Bands have also widened, suggesting higher downside volatility.
At the same time, the index managed to close near its 20-week moving average at around 23,741. Together with the rising trendline and the June 15 gap support, this area remains an important technical zone.
Immediate resistance is placed near 23,851, which coincides with the 50-day moving average. The next hurdle is the 24,000 level. A sustained move above that mark could pave the way for a test of the 20-day moving average at around 24,097.
For Monday's session, traders may watch whether the index sustains above the high formed during the first hour of trade. Holding above 23,850 could support a rebound towards 24,000. On the downside, 23,600 remains a key support. A break below that level could increase selling pressure and pull the index towards 23,393, which marks the 50% retracement of the rally between April 2 and April 21.
Stock Watch
United Spirits has broken out of a 22-week double-bottom pattern and closed near its previous pivot level. The stock also posted its highest weekly close in 57 weeks, while its Relative Strength line reached a fresh high, indicating outperformance against the broader market.
The breakout was backed by higher volumes on both the daily and weekly charts. The stock is trading above all key moving averages, while the Daryl Guppy Multiple Moving Averages remain in an upward formation. The moving average ribbon is also trending higher.
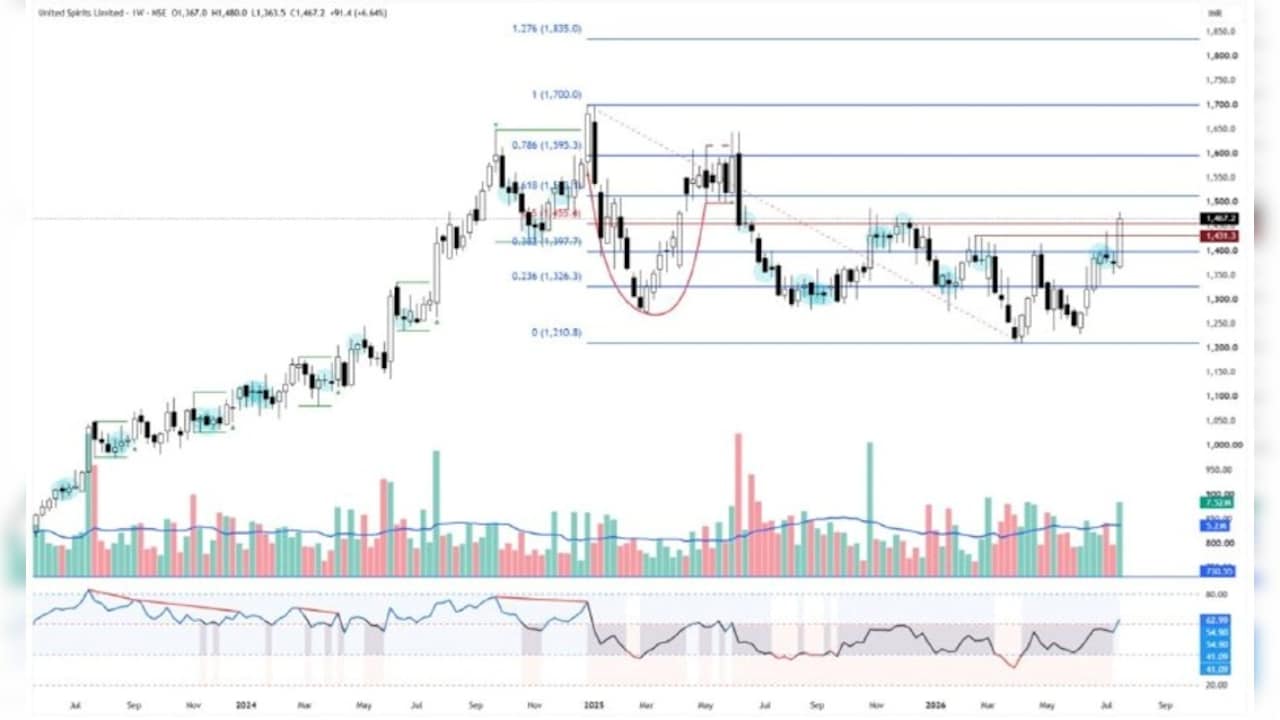
Momentum indicators continue to support the move. Bollinger Bands have widened following the breakout, while the MACD has generated a fresh bullish crossover. The 14-period RSI has entered bullish territory across multiple time frames, the Stochastic RSI remains positive, and the Elder Impulse System has formed a bullish bar.
A sustained move above Rs 1,470 could take the stock towards Rs 1,545. A break above that level may open the way for a move to Rs 1,598. The suggested stop-loss level is Rs 1,384.
Essential Business Intelligence, Sharp Market Insights, Practical Personal Finance Advice, Daily Fuel, Gold and Silver Prices and Latest Stories — On NDTV Profit.