- Nifty 50 ended eight-day losing streak on Wednesday, closing above 24,800 with a 225-point gain
- The index tested 50-DMA and closed above 23.6% retracement of the eight-day decline
- Market breadth was broad-based with strong volume higher than previous day and average
October kicked off on an upbeat note, much like September's start, bringing cheer to the markets. On the very first trading session of the month, the benchmark Nifty 50 snapped its eight-day losing streak and closed decisively above the 24,800 mark, gaining 225 points, or 0.92%.
After opening in the green, the index sustained its upward momentum through most of the day. The market swiftly bought into every intraday dip, resulting in a strong close. The session produced a sizable bullish candle on the daily chart, reversing the weakness of the prior days. Crucially, Nifty broke the recent sequence of lower highs and lower lows, finishing above the past two days' highs. Volumes were robust, higher than both the previous day and the average. On the technical front, the index tested the 50-DMA and managed to close above the 23.6% retracement level of the eight-day decline. Interestingly, the downtrend halted after exactly eight sessions—a Fibonacci number—while the preceding upswing had lasted 13 days, also a Fibonacci number.
The key takeaway from Wednesday's action is that Nifty rebounded strongly from near the crucial support of a falling trendline, drawn by connecting the swing highs of Auf. 21 and Sept 4. Effectively, this was a re-test of the earlier triangle breakout pattern, though not a textbook one. The rally was broad-based, with participation across sectors and the broader market, supported by healthy market breadth. Meanwhile, the MACD histogram confirmed a decline in bearish momentum. On the hourly chart, Nifty moved above the moving average ribbon, and the MACD approached the zero line, signalling a short-term bottom reversal.
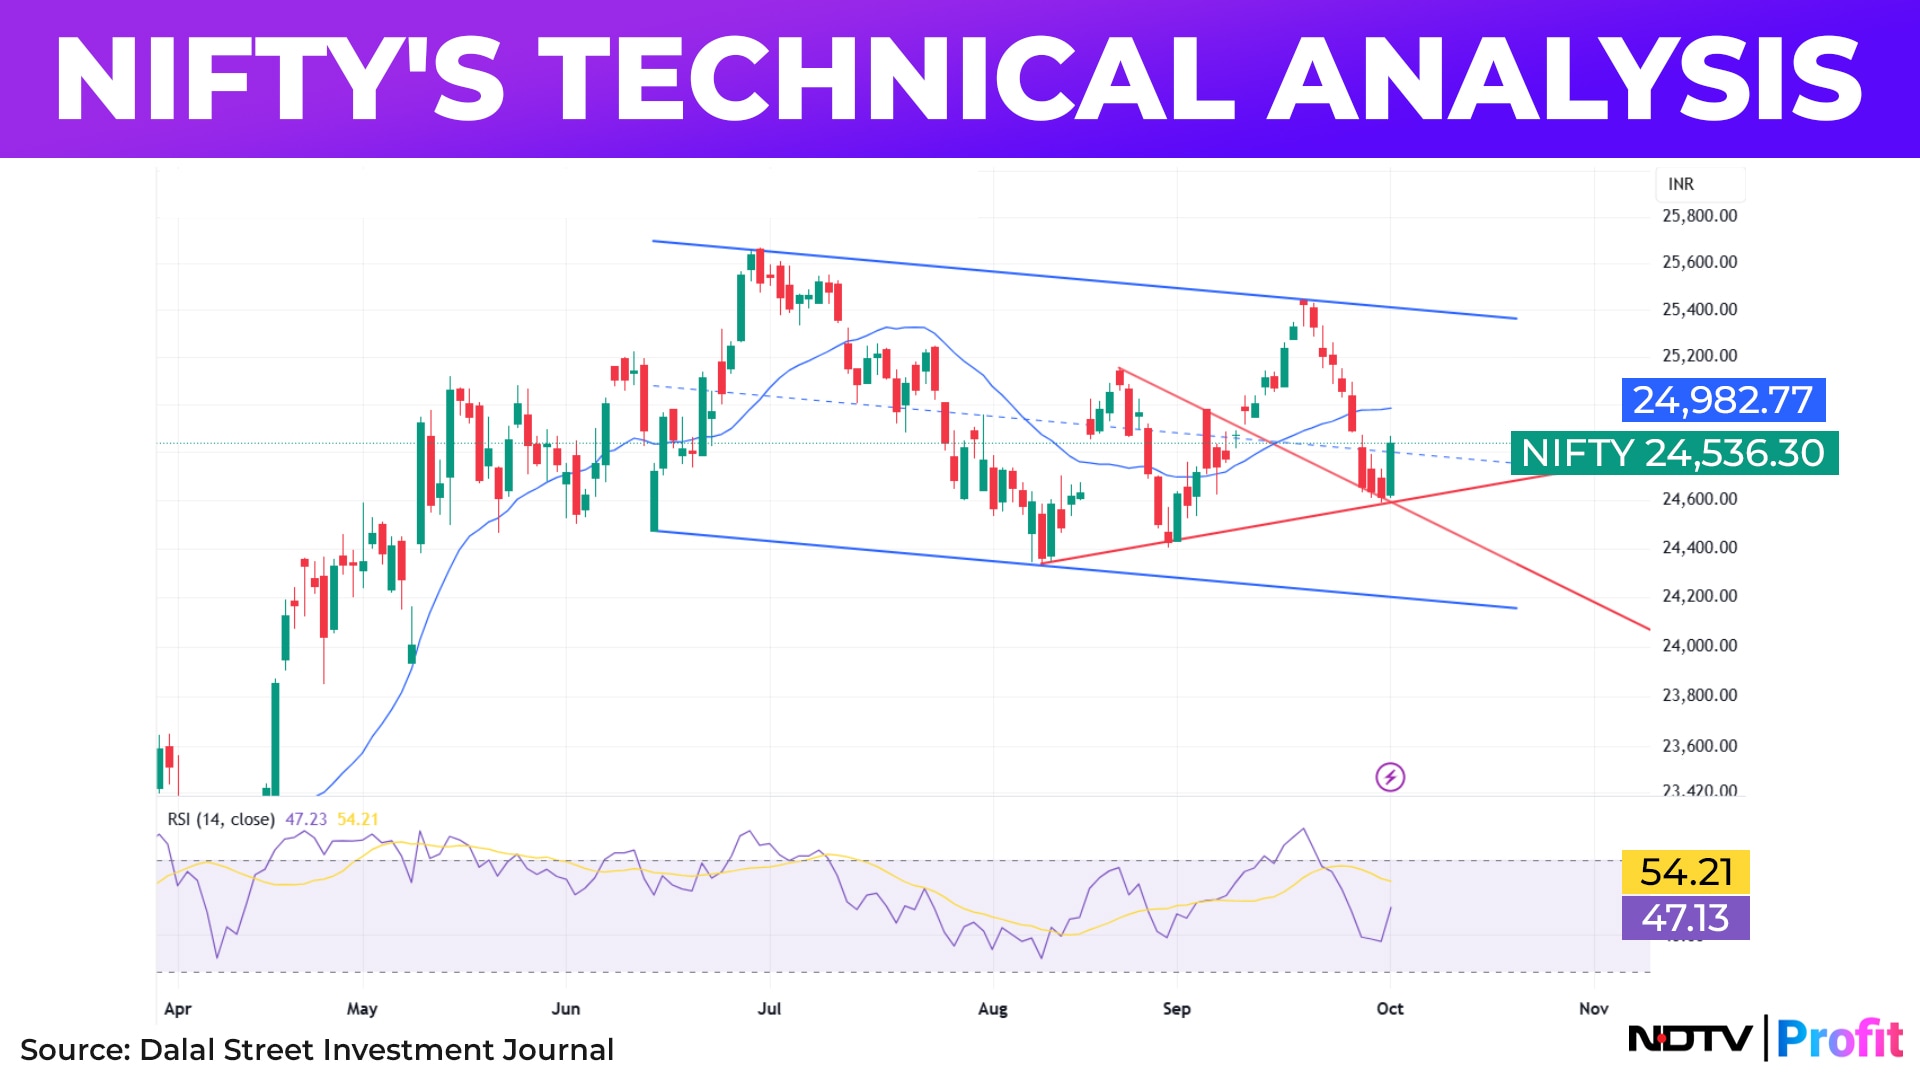
For the bulls, the immediate support lies at 24,580. As long as this level holds, the positive momentum seen in the last session is likely to extend, with immediate resistance placed at 24,983 (20-DMA), followed by 25,040.
Overall, the market bias has turned constructively positive, backed by the bullish candle, Fibonacci alignment, and broad-based recovery. However, the index remains vulnerable to further declines. The bulls still face hurdles: reclaiming the 20- and 50-DMA and filling the downside gap from Sept. 26. With these technical tests ahead, Friday's session becomes crucial; a strong follow-through buying could reinforce bullish confidence and lay the ground for further gains.
Catch all the live stock market action here for real-time updates, stock movements, and broader trends throughout the day.
Disclaimer: The views shared by investment advisers on NDTV Profit are their own. They do not reflect the views of NDTV Profit. Viewers should consult a financial adviser before making investment decisions.
Essential Business Intelligence, Sharp Market Insights, Practical Personal Finance Advice, Daily Fuel, Gold and Silver Prices and Latest Stories — On NDTV Profit.