Nifty Declines For Fourth Day: When Could The Bulls Make A Comeback? Check Key Levels And Stock Of The Day
With three days of decline already completed since the confirmation candle, it is advised to wait another day or two for the pattern’s implications to fully materialise.


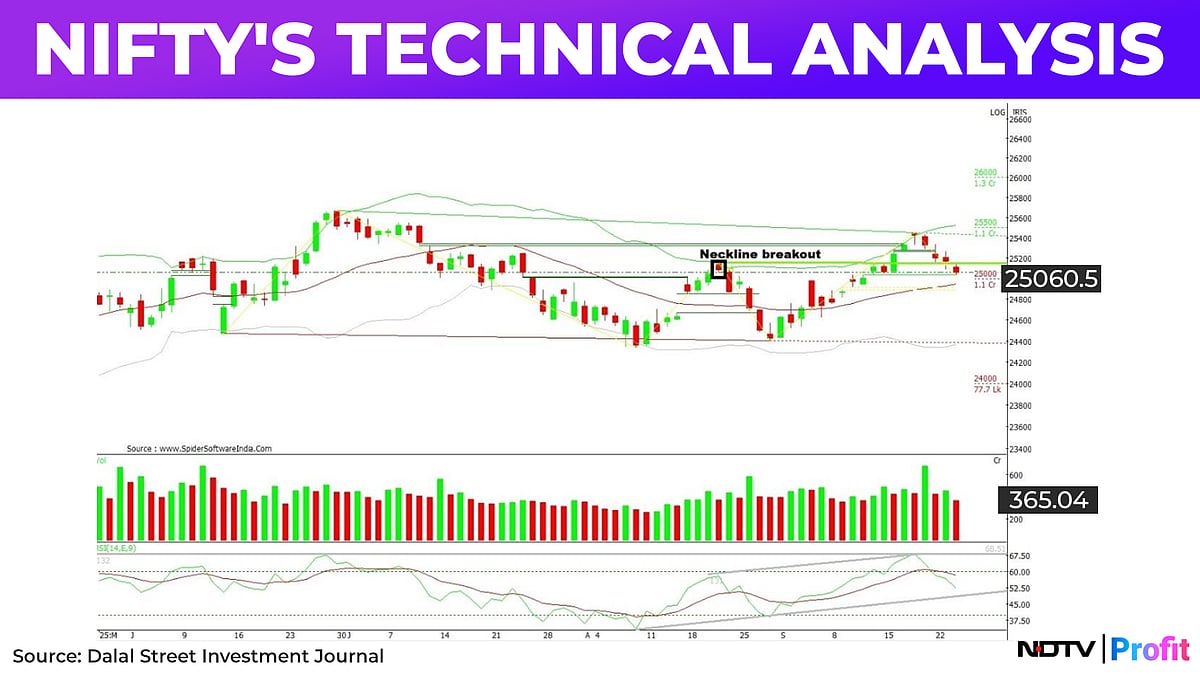
The Nifty 50 index opened lower on Wednesday but managed to recover from the support area identified in the previous write-up. However, this recovery was short-lived, as selling pressure during the final leg of trading led to the index extending its decline for the fourth consecutive day. By the close, the Nifty 50 had fallen 112.60 points, or 0.45%, settling at 25,056.90. While the Nifty FMCG index remained in the green, all other indices ended the day in the red.
From a technical perspective, the Nifty 50 continued its formation of lower highs and lower lows, closing below the swing high of August 21. As a result, the earlier breakout of the double-bottom pattern has turned into a failed breakout, as the index closed below the low of the neckline breakout candle.
Catch all the live markets here for real-time updates, stock movements, and broader market trends throughout the day.
On an intraday basis, the index slipped below both the 21 EMA and the 38.2% Fibonacci retracement of the recent upswing. Despite this, it managed to defend both on a closing basis. Going forward, if the Nifty fails to hold Wednesday’s low of 25,027.45, the correction may extend towards the support zone of 24,915-24,944. This zone aligns with the confluence of the 20-DMA, the bullish gap area from September 10th, and the 50% Fibonacci retracement of the recent upswing.
According to Steve Nison's candlestick principle, the hanging man reversal pattern may continue with its bearish implication for 3 to 5 sessions after its confirmation. With three days of decline already completed since the confirmation candle, it is advised to wait another day or two for the pattern’s implications to fully materialise. During this period, if the bulls manage to hold above the support zone of 24,915-24,944, it could signal the completion of the mean reversion phase, followed by a potential bounce from this support zone.
In short, the Nifty 50 index is currently at a crucial support level. If it fails to hold at this level, it could lead to a test of the support zone between 24,915 and 24,944, from where a bounce back is expected based on the completion of the mean reversion and the implications of Steve Nison’s hanging man reversal pattern. On the upside, the level of 25,150 is likely to act as immediate resistance.
Stock of the Day: Syrma SGS Technology
Syrma SGS Technology’s stock reached an all-time high of Rs 875 in early September before entering a corrective phase. The correction halted near the 38.2% Fibonacci retracement of the upswing from the August low to the September high, coinciding with the rising 20-DMA and the lower boundary of the ascending channel pattern, as shown on the chart.
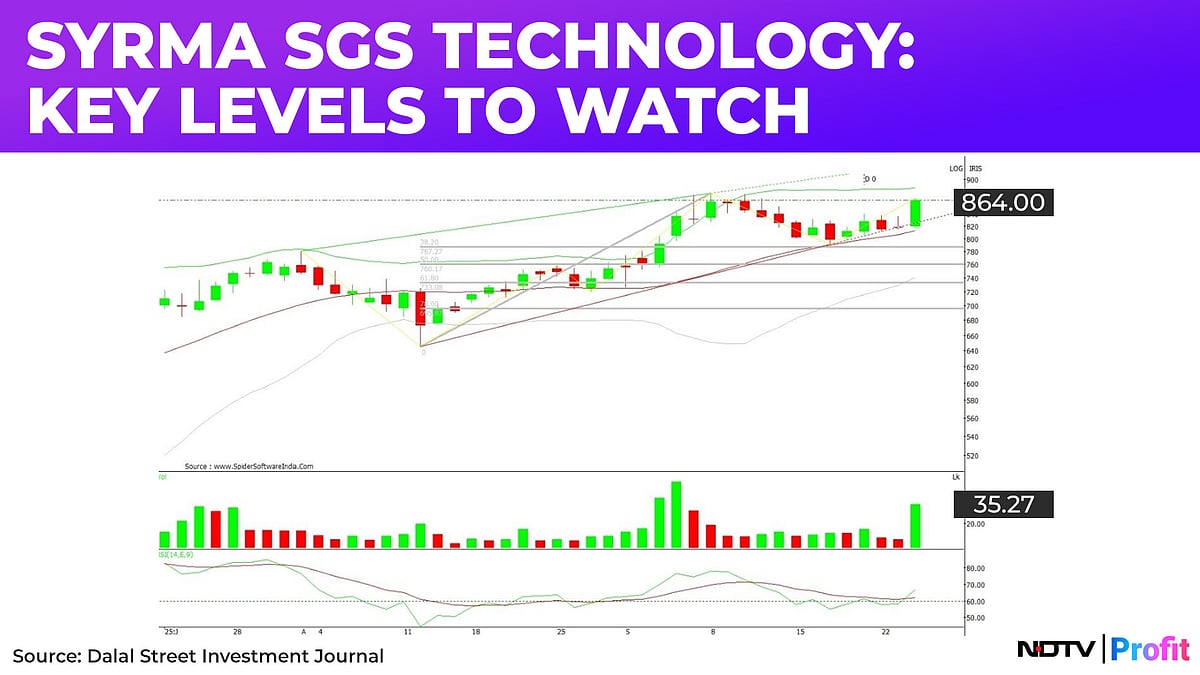
On Wednesday, the stock formed a sizable candlestick pattern, accompanied by more than twice the 30-day average volume of 14.61 lakh shares, indicating strong buying interest from market participants following the end of the corrective phase. Additionally, the 14-period RSI on the daily chart generated a buy signal, reinforcing the positive bias.
Based on this evidence, the stock presents a fresh entry opportunity and signals the potential resumption of the uptrend, with targets in the range of Rs 894 to Rs 910 in the short to medium term. However, a close below Rs 832 would negate the bullish outlook.
Disclaimer: The views shared by investment advisers on NDTV Profit are their own. They do not reflect the views of NDTV Profit. Viewers should consult a financial adviser before making investment decisions.