Shares of Multi Commodity Exchange Ltd., Federal Bank Ltd., Tata Power Co., ITC Ltd., ABB India Ltd., among others, reacted to their first quarter results on Monday. The earnings report of these companies came in post-market hours of Friday and through the weekend.
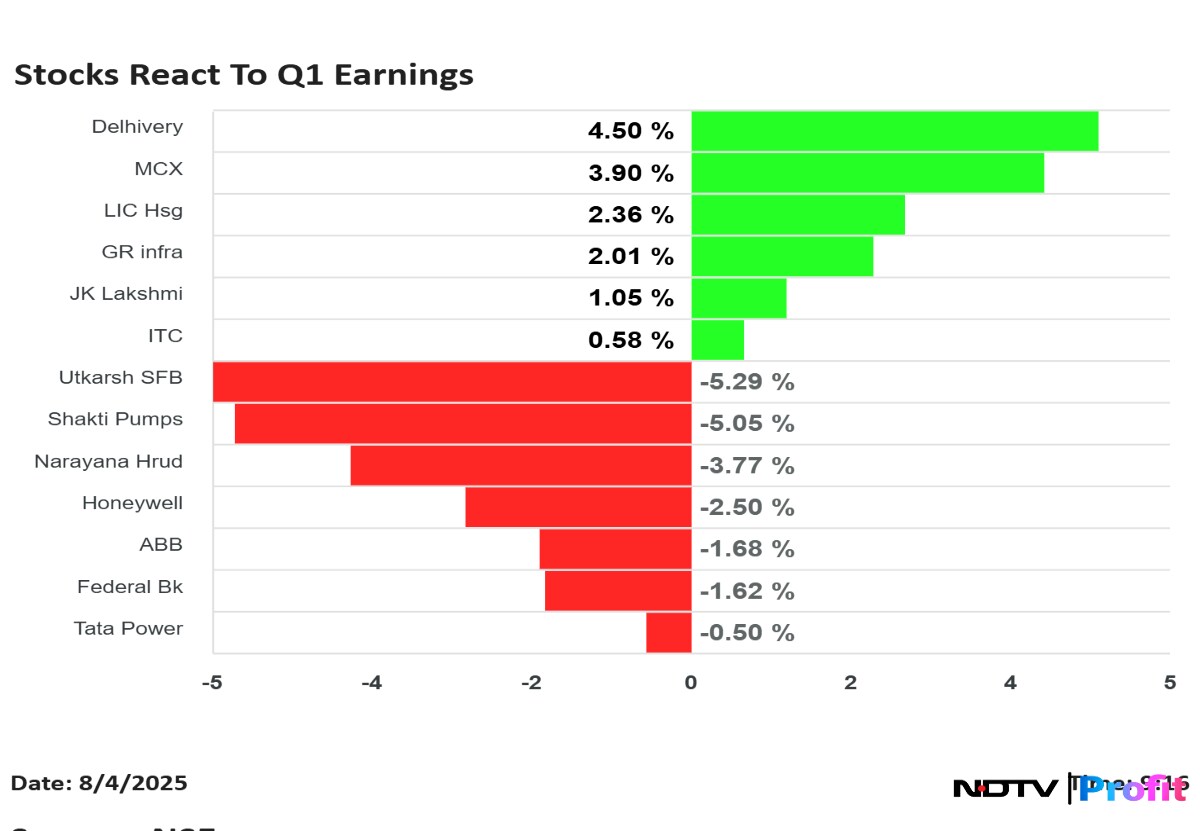
Among the notable gainers in the pack were Delhivery Ltd., MCX, LIC Housing Finance Ltd. and GR Infraprojects Ltd.
On the other hand, Utkarsh Small Finance Bank Ltd., Shakti Pumps Ltd., Narayana Hrudayalaya Ltd. and Honeywell Automation Ltd. stocks slide.
ITC's net profit stayed flat in the June quarter, while its revenue saw a 21% rise to Rs 19,750. Brokerages expect the second half of the financial year 2026 to be better on the back of demand recovery and lower raw material costs. Shares were up marginally.
Earnings Post Market Hours
ITC Q1 Highlights (Standalone, YoY)
Revenue up 20.6% to Rs 19,749.91 crore versus Rs 16,374.02 crore (Estimate: Rs 20,925 crore).
Ebitda up 3% to Rs 6,261.27 crore versus Rs 6,086.77 crore (Estimate: Rs 6,417 crore).
Margin at 31.7% versus 37.2% (Estimate: 35.1%)
Net Profit down 0.1% to Rs 4,912.36 crore versus Rs 4,917.45 crore (Estimate: Rs 5,085 crore)
Stock rose as much as 1.45%.
Multi Commodity Exchange of India Q1 Highlights (Consolidated, QoQ)
Revenue up 28.1% to Rs 373.21 crore versus Rs 291.33 crore (Estimate: Rs 389.13 crore).
Net Profit up 50% to Rs 203.19 crore versus Rs 135.46 crore (Estimate: Rs 200.57 crore).
Ebitda up 51% to Rs 241.66 crore versus Rs 160.19 crore (Estimate: Rs 267.73 crore).
Margin at 64.8% versus 55% (Estimate: 68.8%).
Approves share split in 1:5 ratio
Stock rose as much as 4.85%.
Tata Power Q1 Highlights (Consolidated, YoY)
Revenue up 4.3% to Rs 18,035.07 crore versus Rs 17,293.62 crore (Estimate: Rs 17,865.52 crore).
Ebitda up 15% to Rs 4,139.01 crore versus Rs 3,586.66 crore (Estimate: Rs 3,530.28 crore).
Margin at 22.9% versus 20.7% (Estimate: 19.8%).
Net Profit up 9% to Rs 1,059.86 crore versus Rs 970.91 crore (Estimate: Rs 1,021.87 crore).
Stock fell as much as 3.35%.
Honeywell Automation India Q1 Highlights (YoY)
Revenue up 23.2% to Rs 1,183 crore versus Rs 960 crore
Ebitda down 8% to Rs 141.3 crore versus Rs 153.4 crore
Margin at 11.9% versus 16%
Net Profit down 9% to Rs 125 crore versus Rs 137 crore
Stock fell as much as 4.3%.
Delhivery Q1 Highlights (Consolidated, YoY)
Revenue up 5.6% to Rs 2,294.00 crore versus Rs 2,172.30 crore.
Ebitda up 53% to Rs 148.82 crore versus Rs 97.06 crore.
Margin at 6.5% versus 4.5%
Net Profit up 67% to Rs 91.05 crore versus Rs 54.36 crore.
Stock rose as much as 5.5%.
Jupiter Lifeline Highlights (Consolidated, YoY)
Revenue up 20.5% to Rs 347.63 crore versus Rs 288.58 crore.
Ebitda up 20% to Rs 78.13 crore versus Rs 65.31 crore.
Margin at 22.5% versus 22.6%
Net Profit down 1% to Rs 43.84 crore versus Rs 44.47 crore.
Stock fell as much as 1.3%.
JK Lakshmi Cement Q1 Highlights (Consolidated, YoY)
Revenue up 11.3% to Rs 1,741 crore versus Rs 1,564 crore.
Ebitda up 39.9% to Rs 311 crore versus Rs 222 crore.
Margin at 17.9% versus 14.2%.
Net Profit at Rs 150 crore versus Rs 56.9 crore.
Stock rose as much as 3.25%.
Ramkrishna Forgings Q1 Highlights (Standalone, YoY)
Revenue up 5.7% to Rs 936.69 crore versus Rs 886.34 crore.
Ebitda down 8% to Rs 134.76 crore versus Rs 147.05 crore.
Margin at 14.4% versus 16.6%.
Net Profit down 49% to Rs 21.51 crore versus Rs 42.52 crore.
Alivus Life Sciences Q1 Highlights (Consolidated, YoY)
Revenue up 2.2% to Rs 601.80 crore versus Rs 588.60 crore.
Ebitda up 8% to Rs 172.20 crore versus Rs 159.40 crore.
Margin at 28.6% versus 27.1%.
Net Profit up 9% to Rs 121.50 crore versus Rs 111.40 crore.
Stock fell as much as 5%.
PC Jeweller Q1 Highlights (Consolidated, YoY)
Revenue up 80.7% to Rs 724.91 crore versus Rs 401.15 crore.
Ebitda up 147% to Rs 127.31 crore versus Rs 51.57 crore .
Margin at 17.6% versus 12.9%.
Net Profit up 4% to Rs 161.93 crore versus Rs 156.06 crore.
Stock rose as much as 6.3%.
Shakti Pumps India Q1 Highlights (Consolidated, YoY)
Revenue up 9.7% to Rs 622.50 crore versus Rs 567.65 crore .
Ebitda up 6% to Rs 143.57 crore versus Rs 135.95 crore .
Margin at 23.1% versus 23.9%.
Net Profit up 5% to Rs 96.83 crore versus Rs 92.66 crore.
Stock fell as much as 8%.
Narayana Hrudayalaya Q1 Highlights (Consolidated, YoY)
Revenue up 15.4% to Rs 1,507 crore versus Rs 1,306 crore
Ebitda up 11.4% to Rs 337 crore versus Rs 302 crore
Margin at 22.4% versus 23.1%
Net Profit down 2.3% to Rs 197 crore versus Rs 201 crore
Stock fell as much as 6.5%.
Baazar Style Retail Q1 Highlights (Consolidated, YoY)
Revenue up 37% to Rs 377.85 crore versus Rs 275.79 crore
Ebitda up 39% to Rs 58.20 crore versus Rs 41.88 crore
Margin at 15.4% versus 15.2%
Net Profit at Rs 2.05 crore versus loss of Rs 0.42 crore
Stock rose as much as 9.6%.
HealthCare Global Enterprises Q1 Highlights (Consolidated, YoY)
Revenue up 16.6% to Rs 611.80 crore versus Rs 524.60 crore
Ebitda up 18% to Rs 106.45 crore versus Rs 89.91 crore
Margin at 17.4% versus 17.1%
Net Profit down 61% to Rs 4.75 crore versus Rs 12.10 crore
Stock fell as much as 4.7%.
GR Infraprojects Q1 Highlights (Consolidated, YoY)
Revenue down 2.1% to Rs 1,988 crore versus Rs 2,030 crore
Ebitda up 8% to Rs 398.12 crore versus Rs 367.8 crore
Margin at 20.0% versus 18.1%
Net Profit up 57% to Rs 244 crore versus Rs 155 crore
Stock rose as much as 4.3%.
LIC Housing Finance Q1 Highlights (Consolidated, YoY)
Net Profit up 4.4% to Rs 1,364 crore versus Rs 1,306 crore
Calculated NII up 3.9% to Rs 2,076 crore versus Rs 1,997 crore
Impairment up 34.8% to Rs 193 crore versus Rs 143.1 crore
Stock rose as much as 3.2%.
Shriram Pistons Q1 Highlights (Consolidated, YoY)
Revenue up 15.05% at Rs 963 crore versus Rs 837 crore
Ebitda up 18.2% at Rs 195 crore versus Rs 165 crore
Margin flat at 20% versus 20%
Net profit up 15.3% at Rs 135 crore versus Rs 117 crore
Stock fell as much as 3.64%.
ABB India Q2FY25 Highlights (YoY)
Revenue up 12.2% to Rs 3,175 crore versus Rs 2,831 crore
Ebitda down 23.7% to Rs 414 crore versus Rs 542 crore
Margin at 13% versus 19.2%
Net profit down 20.7% to Rs 352 crore versus Rs 443 crore
Stock fell as much as 3.4%.
Stylam Industries Q1FY26 Highlights (Consolidated, YoY)
Revenue up 16.6% to Rs 283 crore versus Rs 243 crore
Ebitda up 26.5% to Rs 52.9 crore versus Rs 41.8 crore
Margin at 18.7% versus 17.3%
Net profit down 0.3% to Rs 28.3 crore versus Rs 28.36 crore
Stock rose as much as 1.2%.
Epigral Q1FY26 Highlights (Consolidated, YoY)
Revenue down 6.8% to Rs 607 crore versus Rs 651 crore
Ebitda down 7.4% to Rs 163 crore versus Rs 176 crore
Margin at 26.9% versus 27%
Net profit up 87% to Rs 161 crore versus Rs 85.9 crore
Stock fell as much as 7.9%.
Advanced Enzyme Tech Q1FY26 Highlights (Consolidated, YoY)
Revenue up 20.3% to Rs 186 crore versus Rs 155 crore
Ebitda up 7.3% to Rs 63.3 crore versus Rs 59 crore
Margin at 34% versus 38.2%
Net profit up 17% to Rs 39.9 crore versus Rs 34.1 crore
Stock fell as much as 11.7%.
Gujarat Ambuja Exports Q1FY26 Highlights (Consolidated, YoY)
Revenue up 18.4% to Rs 1,291 crore versus Rs 1,090 crore
Ebitda down 8.9% to Rs 96.3 crore versus Rs 106 crore
Margin at 7.5% versus 9.7%
Net profit down 15.3% to Rs 65 crore versus Rs 76.7 crore
Stock fell as much as 1.8%.
Sarda Energy Q1FY26 Highlights (Consolidated, YoY)
Revenue up 76.3% to Rs 1,633 crore versus Rs 926 crore
Ebitda at Rs 617 crore versus Rs 261 crore
Margin at 37.8% versus 28.1%
Net profit at Rs 434 crore versus Rs 199 crore
Stock rose as much as 20%.
Federal Bank Q1FY26 Highlights (YoY unless mentioned)
Net profit down 14.6% to Rs 862 crore versus Rs 1,010 crore
Net NPA at 0.48% versus 0.44% (QoQ)
Gross NPA at 1.91% versus 1.84% (QoQ)
Net interest income up 2% to Rs 2,337 crore versus Rs 2,292 crore
Operating profit up 3.7% to Rs 1,556 crore versus Rs 1,501 crore
Provisions at Rs 400 crore versus Rs 144 crore (YoY) and Rs 138 crore (QoQ)
Stock fell as much as 5.6%.
Vishnu Chemicals Q1FY26 Highlights (Consolidated, YoY)
Revenue up 2.4% to Rs 347 crore versus Rs 339 crore
Ebitda up 0.2% to Rs 55.7 crore versus Rs 55.6 crore
Margin at 16.1% versus 16.4%
Net profit up 5.8% to Rs 32.2 crore versus Rs 30.5 crore
Neogen Chemicals Q1FY26 Highlights (Consolidated, YoY)
Revenue up 3.8% to Rs 187 crore versus Rs 180 crore
Ebitda up 2.3% to Rs 31.5 crore versus Rs 30.8 crore
Margin at 16.9% versus 17.1%
Net profit down 10.5% to Rs 10.3 crore versus Rs 11.5 crore
Stock fell as much as 4%.
MedPlus Health Q1FY26 Highlights (Consolidated, YoY)
Revenue up 3.6% to Rs 1,543 crore versus Rs 1,489 crore
Ebitda up 39.5% to Rs 131 crore versus Rs 93.7 crore
Margin at 8.5% versus 6.3%
Net profit at Rs 42.4 crore versus Rs 14.4 crore
Stock fell as much as 3%.
Balaji Amines Q1FY26 Highlights (Consolidated, YoY)
Revenue down 6.9% to Rs 358 crore versus Rs 385 crore
Ebitda down 17.3% to Rs 54.7 crore versus Rs 66.1 crore
Net profit down 12.2% to Rs 37.9 crore versus Rs 43.3 crore
Margin at 15.3% versus 17.2%
Stock fell as much as 7.1%.
Finolex Industries Q1FY26 Highlights (Consolidated, YoY)
Revenue down 8.5% to Rs 1,043 crore versus Rs 1,141 crore
EBITDA down 55% to Rs 94 crore versus Rs 207 crore
Margin at 9% versus 18.1%
Net profit down 80% to Rs 98 crore versus Rs 501 crore
Note: Base quarter included an exceptional gain of Rs 417 crore
Lower sales and higher raw material costs impacted performance
Management Update: Udipt Agarwal (currently Chief Commercial Officer at Alkyl Amines) appointed MD for 5 years starting November 1; Saurabh Dhanorkar to step down on October 25.
Stock fell as much as 4%.
Utkarsh Small Finance Bank Q1FY26 Highlights (YoY)
Net interest income down 30% to Rs 402 crore versus Rs 573 crore
Operating profit down 71% to Rs 92 crore versus Rs 311 crore
Net loss of Rs 239 crore versus net profit of Rs 137 crore
Provisions surged 3.3 times YoY to Rs 411 crore versus Rs 125 crore
Provisions up 1.8x QoQ to Rs 411 crore versus Rs 223 crore
Gross NPA at 11.4% versus 9.4% (QoQ)
Net NPA at 5% versus 4.84% (QoQ)
NIM at 5.9% versus 9.4% (YoY)
Credit cost at 8.5% versus 2.7% (YoY)
Gross loan portfolio growth at 2.3% (YoY)
Stock fell as much as 8.5%.
Essential Business Intelligence, Continuous LIVE TV, Sharp Market Insights, Practical Personal Finance Advice and Latest Stories — On NDTV Profit.