As organisations adopt microservices, containers, serverless computing, and other distributed architectures, gaining end-to-end visibility into IT infrastructure has become a challenge in today's dynamic and hybrid environments. Observability offers IT leaders a holistic view into IT infrastructure and systems.
ManageEngine surveyed 1,240 IT professionals on this trend (340 were from India). According to the respondents, observability tool deployments are resulting in improved developer productivity and reducing mean time to resolution (MTTR). Around 77% of the respondents used observability to strengthen IT security posture, yet despite many reporting excellent RoI from observability investments, 45% said they struggle with integration, and 33% said current AI/ML features fall short.
We spoke to Gowrisankar Chinnayan, Director of Product Management, Zoho Corporation on the state of observability in India and what IT leaders need to do to achieve their objectives and integrate with their AI/ML strategies.
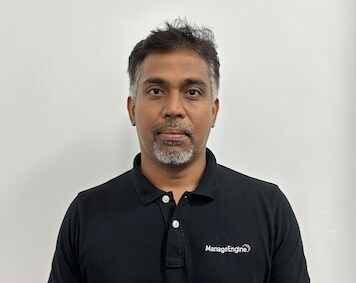
Gowrisankar Chinnayan, Director of Product Management, Zoho Corporation, speaks about observability and its integration with AI.
How is fragmentation of tools and dashboards becoming an issue in complex, multi-cloud environments? How is AIOps helping?
In a multi-cloud environment, every platform and service tends to ship with its own monitoring and logging tools. Over time, these pile up, each tracking its own metrics, keeping its own history, and generating its own alerts. The result is multiple dashboards, which means multiple versions of the truth. An incident in production might show up first in an application performance monitoring tool, minutes later in a log analytics tool, and only partially on an infrastructure dashboard. The lack of unified context means engineers have to reconcile timelines manually, normalise metric formats, and cross-check which anomalies are related. This investigative overhead is the drag that tool sprawl creates.
AIOps addresses this by sitting on top of these disparate data sources, ingesting telemetry in real time, and applying correlation logic across them. Instead of engineers manually pivoting between datasets, the system builds a unified event storyline, linking an infrastructure spike to an application slowdown or mapping a configuration change to an alert storm. For the business, this means less downtime, faster recovery, and fewer staff hours lost to manual triage — all of which translates to lower operational costs and a more resilient service experience for customers.
As Kubernetes becomes the dominant platform for apps, how is that challenging current approaches to observability?
Kubernetes changes the observability challenge because the environment it creates is constantly shifting. Containers spin up and down in seconds. Pods are rescheduled across nodes. IPs change, services scale dynamically, and workloads move based on demand. So, traditional monitoring tools, which are built for long-lived hosts and a static topology, struggle to keep up with that level of churn.
Another challenge is abstraction. Kubernetes hides much of the underlying infrastructure, so a pod crash might trace back to a node capacity issue, a misconfigured deployment, or even a failing upstream service. Without the right instrumentation, these root causes can be obscured.
So, our operational need is twofold: Telemetry needs to be granular enough to track short-lived components, and it needs to be tied back to the higher-level constructs teams actually manage, like namespaces, deployments, and services. The teams that do this well combine cluster-native metrics with application and infrastructure telemetry so they can follow an issue across layers without losing context to Kubernetes' ephemeral nature.
In environments where systems are increasingly interdependent and ephemeral, what blind spots do teams continue to face — even with modern observability solutions in place?
In highly interdependent, short-lived environments, you can only see what you've instrumented. If observability isn't deliberately built into the services and flows that matter the most, critical gaps will remain, no matter how advanced the tool set is.
Another common gap is correlation. Many modern tools still struggle to present a clean, unified view across layers. A pod crash may show up on one dashboard, a database spike on another, and an API slowdown somewhere else — without a clear link between them. That leaves teams stitching timelines together manually.
An additional challenge is separating signals from noise. In fast-moving systems, even minor fluctuations can trigger alerts. If the tools can't filter these down to the events that matter, teams end up chasing false leads. Beyond causing operational inefficiency, this directly impacts the mean time to resolution (MTTR) and customer-facing SLAs.
Finally, observability is rarely a plug-and-play endeavour. It needs the right telemetry, the right integrations, and a habit of reviewing signals regularly. Without that discipline, the data exists but remains unused, and blind spots persist.
What risks do organisations face when observability and security remain siloed — and how are forward-thinking teams closing that gap?
When observability and security are siloed, teams miss early threat signals. A latency spike hinting at a DDoS attack or repeated login failures pointing to a brute-force attempt may never reach the security team because the telemetry sits only with the ITOps team.
There was a time when it made sense to keep performance monitoring and security separate. That's no longer the case. Today's attack surface spans APIs, ephemeral workloads, and CI/CD pipelines, and even user behaviour patterns need to be watched. Thankfully, many of these are already monitored for performance.
ManageEngine's State of Observability 2025 survey shows that 77% of Indian organisations have strengthened their security by sharing observability data. This is done by routing it into SIEM solutions so the security team can work with the same signals that operations teams see.
The harder change, however, is cultural: getting ITOps and SecOps teams to trust each other's context, align alert rules, and work from a shared playbook. Once that happens, handoffs will get faster, and incidents will close with far less back-and-forth.
How is observability becoming a catalyst for AI adoption?
AI works best when it has access to large, high-quality datasets. An observability platform naturally produces these via continuous, structured telemetry from across infrastructures, applications, and user interactions. This makes it the ideal foundation for applying AI to real operational problems.
According to our findings, over 75% of Indian organisations are already using AI in their observability workflows, with some experimenting, some using it selectively, and others fully integrating it into day-to-day operations.
We're also seeing a shift from AI inside the tool to AI across the workflow: for example, correlating metrics, logs, and traces to pinpoint a likely root cause, then using natural language summaries to help an on-call engineer act faster. Without an observability platform, AI would be operating on isolated datasets. With an observability platform, AI can draw from a unified, real-time view of the systems, making its insights both faster and more actionable.
What is the value generated by a unified observability platform powered by causal AI?
A unified observability platform removes one of the biggest sources of delay in operations: context switching. Instead of jumping between tools for metrics, logs, and traces, teams can see the entire event chain in one place. When that platform is powered by causal AI, the advantage goes further: The system will show the causal relationship between multiple anomalies. That shortens the investigative loop dramatically.
This has a direct impact on outcomes. In our survey, 89% of Indian organisations said their observability investments have helped them reduce their MTTR by at least 50%. These gains come from fewer false leads, faster root cause identification, and less time spent reconciling data across silos. Over time, the same cause and effect insights can power automated remediation, allowing routine fixes to be triggered without human intervention and helping your ITOps become truly autonomous.
What are some of the key considerations that CIOs should focus on when it comes to evaluating and deploying observability tools?
The first consideration should be interoperability: Can the observability tool pull data from the existing infrastructure, applications, and services without heavy customisation? This is important because a tool that looks powerful can still create friction if it's difficult to integrate with the systems and workflows already in place.
The next considerations should be data compliance and security. An observability platform processes vast amounts of operational telemetry, which may include sensitive information. CIOs need to ensure that the platform supports encryption in transit and at rest, fine-grained access controls, audit trails, and retention policies that align with organisational and regulatory requirements. Regional data residency rules are another factor, especially for global teams. Without these, the risks of exposure or noncompliance can outweigh the operational gains.
Finally, CIOs should consider the scalability and cost. The platform should be able to handle growing telemetry volumes without driving up operational expenses disproportionately.
Addressing all of these considerations up front — by piloting high-value use cases and testing the integration depth — can save CIOs from expensive reworking later.
Where do you see spending on observability in the year ahead? Is cost an issue?
Costs will shape many observability spending decisions in the year ahead. With budgets under closer scrutiny and IT leaders expected to do more with less, the cost of scaling tools is coming into sharper focus. In fact, 61% of Indian organisations see it as a major roadblock. As a result, teams are focusing on extracting more value from what they already have before adding new investments.
Tool consolidation is a key part of that. By centralising with fewer, more capable platforms, organisations can cut down on licensing and operational overhead. Those that do this well can free up resources faster, giving them a competitive edge in how quickly they can respond to change.
We're also seeing more investments in skills, with IT leaders prioritising training to help teams unlock more value from their existing platforms. On the technology front, priorities include improving hybrid visibility, using telemetry data more effectively, and expanding AI and ML adoption to scale up observability without scaling up costs.
Essential Business Intelligence, Continuous LIVE TV, Sharp Market Insights, Practical Personal Finance Advice and Latest Stories — On NDTV Profit.


