Navin Fluorine International Ltd. hit fresh high, GMR Power and Urban Infra Ltd. and Computer Age Management System Ltd. fell sharply after the companies released their first-quarter numbers.
Navin Fluorine International rose 3.28% to a record high of Rs 169.10 apiece. The stock has been rising for four days in a row. Its net profit more than doubled in the first quarter.
Among companies which are reacting to earnings, HEG Ltd. rose the most. It advanced 8.54% to Rs 580 apiece. It was trading 7.96% higher at Rs 577 apiece as of 9:34 a.m.
HEG reported that its consolidated net profit advanced 25.8% on the year to Rs 104.83 crore versus adjusted net profit of Rs 83.33 crore.
Kaynes Technology India Ltd. rose for three days in a row as it has reported a 46.27% on the year rise in its consolidated net profit during April–June quarter.
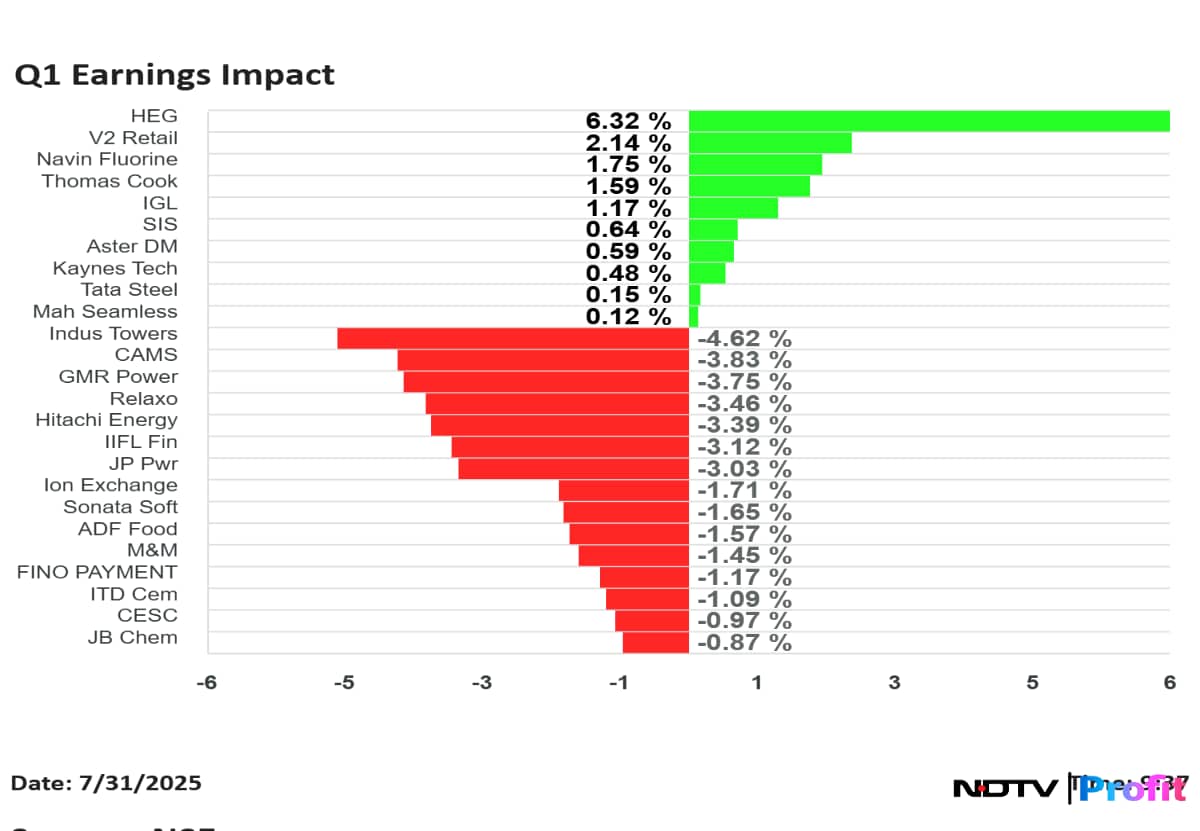
GMR Power and Urban Infra share price declined 5.28% to Rs 108 apiece, the lowest level since June 27. The company has reported a loss of Rs 7.8 crore versus profit of Rs 1,225 crore.
Computer Age Management Services Ltd. fell 5.26% to Rs 3,685.4 apiece, the lowest level since May 15. The stock declined because it has reported 4.38% on the quarter fall in net profit.
Q1 Earnings
Mahindra & Mahindra Q1FY26 Highlights (Standalone, YoY)
Revenue up 25.8% to Rs 34,142.96 crore versus Rs 27,132.76 crore.
Net profit up 32% to Rs 3,449.84 crore versus Rs 2,612.63 crore.
Ebitda up 17% to Rs 4,795.44 crore versus Rs 4,116.19 crore.
Margin at 14.0% versus 15.2%.
CAMS Q1 FY26 Highlights (Consolidated, QoQ)
Revenue down 0.57% at Rs 354 crore versus Rs 356 crore.
Ebitda down 3.14% at Rs 154 crore versus Rs 159 crore.
Ebitda margin down 116 bps at 43.5% versus 44.66%.
Net profit down 4.38% at Rs 109 crore versus Rs 114 crore.
IndiGo Q1FY26 Highlights (Consolidated, YoY)
Revenue up 4.72% to Rs 20,496.3 crore versus Rs 19,571 crore.
Net profit down 20.18% to Rs 2,176.3 crore versus Rs 2,727 crore.
Ebitdar rises 0.66 at Rs 5,866.3 crore versus Rs 5,828 crore.
Margin at 28.6% versus 30%.
Yield down 5% year-on-year to Rs 4.98/km.
Maharashtra Seamless Q1FY26 Highlights (Consolidated, YoY)
Revenue down 0.5% At Rs 1,145 crore versus Rs 1,151 crore.
Ebitda up 35.4% At Rs 169 crore versus Rs 124 crore.
Margin at 14.7% versus 10.8%.
Net profit up 78.2% at Rs 230 crore versus Rs 129 crore.
Mahindra & Mahindra Q1FY26 Highlights (Standalone, YoY)
Revenue up 25.8% to Rs 34,142.96 crore versus Rs 27,132.76 crore.
Net profit up 32% to Rs 3,449.84 crore versus Rs 2,612.63 crore.
Ebitda up 17% to Rs 4,795.44 crore versus Rs 4,116.19 crore.
Margin at 14.0% versus 15.2%.
Jaiprakash Power Ventures Q1FY26 Highlights (Consolidated, YoY)
Revenue down 9.8% to Rs 1,583.16 crore versus Rs 1,754.70 crore.
Net profit down 20% to Rs 278.13 crore versus Rs 348.54 crore.
Ebitda down 24% to Rs 601.36 crore versus Rs 789.90 crore.
Margin at 38.0% versus 45.0%.
CESC Q1 Highlights Q1FY26 Highlights (Consolidated, YoY)
Revenue up 7% to Rs 5,202 crore versus Rs 4,863 crore.
Net profit up 2% to Rs 387 crore versus Rs 378 crore.
Ebitda up 133% to Rs 864 crore versus Rs 371 crore.
Margin at 16.6% versus 7.6%.
Hitachi Energy Q1FY26 Highlights (Consolidated, YoY)
Revenue up 11.4% to Rs 1,478.90 crore versus Rs 1,327.24 crore.
Net profit up 1163% to Rs 131.60 crore versus Rs 10.42 crore.
Ebitda up 223% to Rs 154.90 crore versus Rs 47.90 crore.
Margin at 10.5% versus 3.6%.
lndraprastha Gas Q1FY26 Highlights (Standalone, QoQ)
Revenue down 1.3% to Rs 3,913.85 crore versus Rs 3,966.43 crore.
Net profit down 11% to Rs 355.94 crore versus Rs 401.45 crore.
Ebitda down 50% to Rs 511.75 crore versus Rs 1,027.68 crore.
Margin at 13.1% versus 25.9%.
Navin Fluorine International Q1FY26 Highlights (Consolidated, YoY)
Revenue up 38.5% to Rs 725.40 crore versus Rs 523.68 crore.
Net profit up 129% to Rs 117.16 crore versus Rs 51.20 crore.
Ebitda up 106% to Rs 206.79 crore versus Rs 100.35 crore.
Margin at 28.5% versus 19.2%.
IIFL Finance Q1FY26 Highlights (Consolidated, YoY)
Impairment at Rs 512 crore versus Rs 252 crore.
Calculated NII declines 9% at Rs 1,295 crore versus Rs 1,431 crore.
Net profit declines 19% at Rs 233 crore versus Rs 288 crore.
ITD Cementation Q1FY26 Highlights (Consolidated, YoY)
Revenue up 6.8% to Rs 2,542.37 crore versus Rs 2,381.49 crore.
Net profit up 37% to Rs 137.22 crore versus Rs 100.19 crore.
Ebitda up 5% to Rs 232.85 crore versus Rs 221.43 crore.
Margin at 9.2% versus 9.3%.
Relaxo Footwears Q1FY26 Highlights (Consolidated, YoY)
Revenue down 12.5% to Rs 654.49 crore versus Rs 748.19 crore.
Net profit up 10% to Rs 48.90 crore versus Rs 44.37 crore.
Ebitda up 1% to Rs 99.45 crore versus Rs 98.90 crore.
Margin at 15.2% versus 13.2%.
HEG Q1FY26 Highlights (Consolidated, QoQ)
Adjusted for one off negative due to loss in Graphtec investment
Revenue up 13.6% at Rs 617 crore versus Rs 542.25 crore.
Ebitda 3.84% at Rs 105.43 crore versus Rs Adjusted Ebitda 101.53 crore.
Margin at 17.11 % versus Adjusted margin 18.72%.
Net profit 25.8 % at Rs 104.83 crore versus Adjusted net profit Rs 83.33 crore.
Tata Steel Q1FY26 Highlights (Consolidated, QoQ)
Revenue down 5.4% to Rs 53,178.12 crore versus Rs 56,218.11 crore. (Estimates: 51392 crore).
Ebitda up 13% to Rs 7,427.54 crore versus Rs 6,559.22 crore (Estimate: Rs 6862 crore).
Margin at 13.96 % versus 11.7%. (Estimate 13.40%).
Net profit up 60% to Rs 2,077.68 crore versus Rs 1,300.81 crore (Estimate: Rs 1751 crore).
JB Chemicals and Pharmaceuticals Q1FY26 Highlights (Consolidated, YoY)
Revenue up 8.9% to Rs 1,093.94 crore versus Rs 1,004.40 crore.
Ebitda up 7% to Rs 300.87 crore versus Rs 280.37 crore.
Margin at 27.5% versus 27.9%.
Net profit up 14% to Rs 202.38 crore versus Rs 176.83 crore.
Aster DM Q1 FY26 Highlights (Consolidated YoY)
Revenue up 7.6% at Rs 1,078 crore versus Rs 1,002 crore.
EBITDA up 26.8% at Rs 207 crore versus Rs 164 crore
Margin at 19.2% versus 16.3%.
Net profit up 22% at Rs 90 crore versus Rs 74 crore.
CAMS Q1 FY26 Highlights (Consolidated, QoQ)
Revenue down 0.57% at Rs 354 crore versus Rs 356 crore.
Ebitda down 3.14% at Rs 154 crore versus Rs 159 crore.
Ebitda margin down 116 bps at 43.5% versus 44.66%.
Net profit down 4.38% at Rs 109 crore versus Rs 114 crore.
ADF Foods Earnings Q1FY26 Highlights (Consolidated, YoY)
Revenue up 9.3% at Rs 133 crore versus Rs 122 crore.
Margin at 17.7% versus 16.1%.
Ebitda up 20% at Rs 23.5 crore versus Rs 19.6 crore.
Net profit up 1.4% at Rs 15.2 crore versus Rs 15 crore.
Ion Exchange India Q1 FY26 Highlights (Consolidated YoY)
Revenue up 2.8% to Rs 583 crore versus Rs 568 crore.
Ebitda down 3% to Rs 62.5 crore versus Rs 64.2 crore.
Margin at 10.7% versus 11.3%.
Net profit up 8% to Rs 48.7 crore versus Rs 44.9 crore.
GMR Power and Urban Infra Q1 FY26 Highlights (Consolidated YoY)
Revenue up 2.3% to Rs 1,648.45 crore versus Rs 1,612 crore.
Net loss at Rs 7.8 crore versus profit of Rs 1,225 crore
Ebitda down 23% to Rs 401 crore versus Rs 518 crore
Margin at 24.3% versus 32.1%.
Thomas Cook Q1FY26 Highlights (Consolidated, YoY)
Revenue up 14.3% at Rs 2,408 crore versus Rs 2,106 crore.
Margin at 5.3% versus 6.5%.
Ebitda down 7% at Rs 126 crore versus Rs 136 crore.
Net profit down 4.3% at Rs 72 crore versus Rs 75.2 crore
Sonata Software Q1 FY26 Highlights (Consolidated, QoQ)
Revenue up 13.3% at Rs 2,965 crore versus Rs 2,617 crore.
Ebitda down 10.7% at Rs 134 crore versus Rs 150 crore.
Margin at 4.5% versus 5.7%.
Net profit up 1.7% at Rs 109 crore versus Rs 108 crore.
JB Chemicals and Pharmaceuticals Q1 FY26 Highlights (Consolidated, YoY)
Revenue up 8.9% to Rs 1,093.94 crore versus Rs 1,004.40 crore.
Net profit up 14% to Rs 202.38 crore versus Rs 176.83 crore.
Ebitda up 7% to Rs 300.87 crore versus Rs 280.37 crore.
Margin at 27.5% versus 27.9%.
Kaynes Tech Q1 FY26 Highlights (Consolidated YoY)
Revenue up 33.53% at Rs 673 crore versus Rs 504 crore.
Ebitda up 134.44% at Rs 190.6 crore versus Rs 81.3 crore.
Ebitda margin up 1218 bps at 28.32% versus 16.13%.
Net profit up 46.27% at Rs 74.6 crore versus Rs 51 crore.
Fino Payments Bank Q1 FY26 Highlights (Consolidated, YoY)
Operating profit rises 1.2% to Rs 24.6 crore versus Rs 24.3 crore.
Net Interest Income rises 52.1% to Rs 32.6 crore versus Rs 21.4 crore.
Net profit declines 26.8% to Rs 17.8 crore versus Rs 24.3 crore.
SIS Q1 FY26 Highlights (Consolidated YoY)
Revenue went up 13.4% to Rs 3,548.49 crore versus Rs 3,129.86 crore.
Net profit went up 45% to Rs 92.95 crore versus Rs 64.22 crore.
Ebitda up 11% to Rs 152.08 crore versus Rs 137.39 crore.
Margin at 4.3% versus 4.4%.
V2 Retail Q1 FY26 Highlights (Consolidated YoY)
Revenue up 52.3% to Rs 632.22 crore versus Rs 415.03 crore.
Net profit up 51% to Rs 24.66 crore versus Rs 16.34 crore.
Ebitda up 57% to Rs 87.24 crore versus Rs 55.45 crore.
Margin at 13.8% versus 13.4%.
Indus Towers Q1FY26 Highlights (Consolidated, YoY)
Revenue up 9.1% at Rs 8,058 crore versus Rs 7,383 crore.
Ebitda down 3.4% at Rs 4,390 crore versus Rs 4,545 crore.
Margin at 54.5% versus 61.6%.
Net profit down 9.8% at Rs 1,737 crore versus Rs 1,926 crore.
Essential Business Intelligence, Continuous LIVE TV, Sharp Market Insights, Practical Personal Finance Advice and Latest Stories — On NDTV Profit.