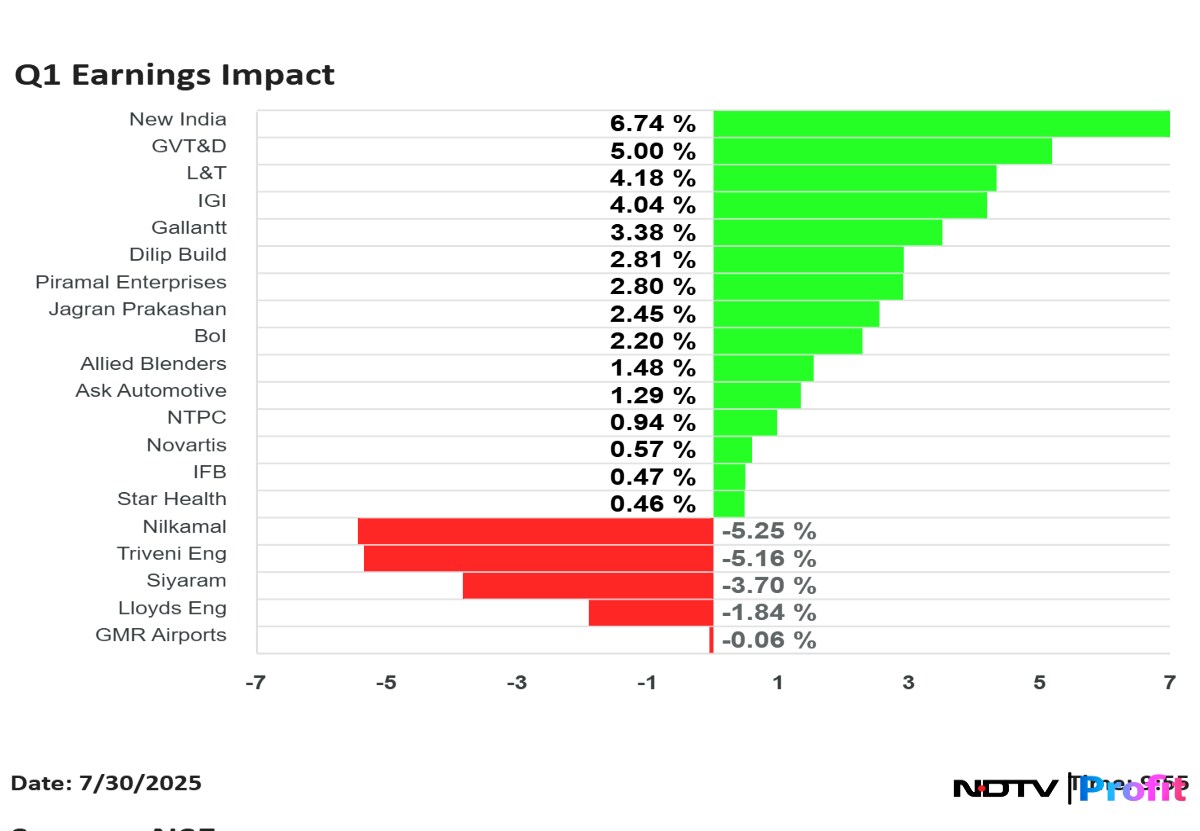
In Wednesday's session, Gallantt Ispat Ltd. and Allied Blenders And Distillers Ltd. hit record high after the companies reported an increase in their net profits for April–June period. Larsen & Toubro Ltd.'s share price jumped the most in two months after posting better profit than expected.
International Gemmological Institute Ltd. recorded the most gain among other companies which reported their first-quarter profit and loss statements post market hours. The share price advanced 8.63% to Rs 442 apiece. The stock extended gains to a second session.
The New India Assurance Co and Dilip Buildcon also clocked decent gains because of the first-quarter results. The share prices advanced 8.29% and 6.52%, respectively, so far today.
The New India Assurance Co snapped a three-day declining streak in Wednesday's session. Dilip Buildcon rose for second session in a row.
Meanwhile, Triveni Engineering Ltd. share price slumped the most as it reported as its net profit slumped 86% during the first quarter. The share price declined 7.93% to Rs 338.35 apiece.
Siyaram Silk Mills Ltd. and Nikamal Ltd. were second and third worst performers. The stock prices fell 7.24% and 7%, respectively, so far.
Share Price Movement As Of 9:56 A.M.
Earnings
Jagran Prakashan Q1FY26 Highlights (Consolidated, YoY)
Revenue up 3.6% to Rs 460 crore versus Rs 444 crore.
Ebitda down 2.6% to Rs 63.7 crore versus Rs 65.4 crore.
Margin at 13.9% versus 14.7%.
Net profit up 63.3% to Rs 67.2 crore versus Rs 41.2 crore.
Gallantt Ispat Q1FY26 Highlights (Consolidated, YoY)
Revenue down 2.8% to Rs 1,128 crore versus Rs 1,160 crore.
Ebitda up 15% to Rs 247 crore versus Rs 215 crore.
Margin at 21.9% versus 18.5%.
Net profit up 42.6% to Rs 174 crore versus Rs 122 crore.
Piramal Enterprises Q1FY26 Highlights (Consolidated, YoY)
Consol AUM up 22% YoY.
Impairment loss at Rs 227 crore versus Rs 488 crore.
Calculated NII up 23% to Rs 902 crore versus Rs 732 crore.
Net profit up 52.3% to Rs 276 crore versus Rs 181 crore.
Approves fundraise of up to Rs 1,000 crore via NCDs.
S.J.S. Enterprises Q1FY26 Highlights (Consolidated, YoY)
Revenue up 11.2% to Rs 209 crore versus Rs 188 crore.
Ebitda up 15.6% to Rs 55.7 crore versus Rs 48.2 crore.
Margin up 102 bps at 26.7% versus 25.6%.
Net profit up 22.7% to Rs 34.6 crore versus Rs 28.2 crore.
Bank Of India Q1 Highlights (Standalone, YoY)
Net interest income falls 3% to Rs 6,068.11 crore versus Rs 6,275.8 crore
Net profit up 32% to Rs 2,252.12 crore versus Rs 1,702.73 crore
Gross NPA at 2.92% versus 3.27% (QoQ).
Net NPA at 0.75% versus 0.82% (QoQ).
Operating profit rises 9% to Rs 4,009 crore versus Rs 3,677 crore
Provisions fall 15.2% to Rs 1,096 crore versus Rs 1,293 crore
Provisions decline 18% to Rs 1,096 crore versus Rs 1,338 crore (QoQ)
Triveni Engineering Q1 Highlights (Standalone, YoY)
Revenue up 22.9% to Rs 1,598.22 crore versus Rs 1,300.68 crore
Ebitda down 38% to Rs 53.50 crore versus Rs 86.24 crore.
Margin at 3.3% versus 6.6%
Net profit down 86% to Rs 4.41 crore versus Rs 31.27 crore
International Gemmological Institute Q2 Highlights (Consolidated, YoY)
Revenue up15.8% at Rs 301 crore versus Rs 260 crore
Ebitda up 36.9% at Rs 173 crore versus Rs 127 crore
Margin at 57.6% versus 48.7%
Net profit up 62.6% at Rs126.5 crore versus Rs 77.8 crore
L&T Q1FY26 Results (Consolidated, YoY)
Revenue up 15.52% at Rs 63,678 crore versus Rs 55,119 crore
Ebitda up 12.5% at Rs 6,317 crore versus Rs 5,615 crore
Margin at 9.92% versus 10.18% down 26 basis points
Net profit up 29.84% at Rs 3,617 crore versus Rs 2,786 crore
Received orders worth Rs 94,453 crore, up 33% YoY
International orders stood at Rs 48,675 crore, accounting for 52% of total order inflow
Order book stood at Rs 6.12 lakh crore, up 6% over March 25
Ask Automotive Q1FY26 (Consolidated, YoY)
Revenue up 3.4% to Rs 891 crore versus Rs 862 crore
Ebitda up 19% to Rs 120 crore versus Rs 101 crore
Margin at 13.4% versus 11.7%
Net profit up 16.3% to Rs 66 crore versus Rs 56.8 crore
Nilkamal Q1FY26 (Standalone, YoY)
Revenue up 18.9% to Rs 883 crore versus Rs 743 crore
Net profit down 16.7% to Rs 15.2 crore versus Rs 18.3 crore
Ebitda up 2.9% to Rs 58 crore versus Rs 56.3 crore
Margin at 6.6% versus 7.6%
New India Assurance Q1FY26 (YoY)
Gross premiums written up 13.1% to Rs 13,445 crore versus Rs 11,888 crore
Net premium income rises 10.3% to Rs 9,424 crore versus Rs 8,547 crore.
Underwriting loss at Rs 1,754 crore versus loss of Rs 1,576 crore
Net profit rises 80.2% to Rs 391.01 crore versus Rs 216.97 crore.
Combined ratio at 116.03% versus 111.59% (QoQ)
Combined ratio at 116.03% versus 115.90% (YoY)
Novartis India Q1FY26 (Standalone, YoY)
Revenue down 5.1% to Rs 87.6 crore versus Rs 92.3 crore
Net profit up 7% to Rs 27.6 crore versus Rs 25.7 crore
Ebitda up 14% to Rs 27.2 crore versus Rs 24 crore
Margin at 31.1% versus 26%
GE Vernova T&D India Q1 Highlights (Consolidated, YoY)
Revenue up 38.8% to Rs 1,330 crore versus Rs 958 crore
Ebitda at Rs 388 crore versus Rs 182 crore
Margin at 29.1% versus 19%.
Net profit at Rs 291 crore versus Rs 135 crore
Allied Blenders Q1FY26 (Consolidated, YoY)
Revenue up 21.8% to Rs 923 crore versus Rs 758 crore
Ebitda up 50.5% to Rs 112 crore versus Rs 74.1 crore
Margin at 12.1% versus 9.8%
Net profit at Rs 56.6 crore versus Rs 11.2 crore
Triveni Engineering Q1FY26 (Consolidated, YoY)
Revenue up 22.8% to Rs 1,598 crore versus Rs 1,301 crore
Ebitda down 38% to Rs 53.5 crore versus Rs 86.3 crore
Margin down 328 bps at 3.3% versus 6.6%
Net profit down 93.5% to Rs 2 crore versus Rs 31 crore
IFB Industries Q1FY26 (Consolidated, YoY)
Revenue up 5.4% to Rs 1,338 crore versus Rs 1,269 crore
Ebitda down 22.6% to Rs 63.2 crore versus Rs 81.7 crore
Margin at 4.7% versus 6.4%
Net profit down 30.3% to Rs 26.2 crore versus Rs 37.5 crore
Star Health and Allied Insurance Co Q1FY26 (Standalone, YoY)
Gross premium written up 3.7% to Rs 3,605 crore versus Rs 3,475 crore
Net premiums earned up 11.9% to Rs 3,938 crore versus Rs 3,520 crore
Underwriting profit down 48.8% to Rs 71.7 crore versus Rs 140 crore
Net profit down 17.7% to Rs 263 crore versus Rs 319 crore
Dilip Buildcon Q1FY26 (Consolidated, YoY)
Revenue down 16.4% to Rs 2,620 crore versus Rs 3,134 crore
Ebitda up 8.9% to Rs 520 crore versus Rs 478 crore
Margin at 19.9% versus 15.3%
Net profit up 91.6% to Rs 229 crore versus Rs 119 crore
Q1 Earnings Lloyds Engineering (Cons, QoQ)
Revenue down 6.5% At Rs 217 crore Versus Rs 232 crore
EBITDA down 23.5% At Rs 26.5 crore Versus Rs 34.7 crore
Margin At 12.2% Versus 14.9%
Net profit down 65.4% At Rs 30.2 crore Versus Rs 18.3 crore
Lloyds Engineering Q1FY26 (Consolidated, QoQ)
Revenue down 6.5% to Rs 217 crore versus Rs 232 crore
Ebitda down 23.5% to Rs 26.5 crore versus Rs 34.7 crore
Margin at 12.2% versus 14.9%
Net profit down 65.4% to Rs 10.2 crore versus Rs 18.3 crore
NTPC Q1FY26 (Standalone, YoY)
Revenue down 4.2% to Rs 42,572.6 crore versus Rs 44,427.5 crore
Net profit up 6% to Rs 4,774.7 crore versus Rs 4,511 crore
Ebitda down 17% to Rs 10,283.8 crore versus Rs 12,454.9 crore
Margin at 24.2% versus 28%
GMR Airports Q1FY26 (Consolidated, YoY)
Revenue up 33.4% to Rs 3,205 crore versus Rs 2,402 crore
Ebitda up 45.4% to Rs 1,306 crore versus Rs 898 crore
Margin at 40.7% versus 37.4%
Net loss at Rs 212 crore versus loss of Rs 142 crore
Board approves non-convertible bonds issuance up to Rs 6,000 crore
Siyaram Silk Mills Q1FY26 (Consolidated, YoY)
Revenue up 26.9% to Rs 389 crore versus Rs 307 crore
Ebitda at Rs 20.8 crore versus Rs 9.7 crore
Margin at 5.3% versus 3.1%
Net profit down 59.7% to Rs 4.6 crore versus Rs 11.5 crore
Essential Business Intelligence, Continuous LIVE TV, Sharp Market Insights, Practical Personal Finance Advice and Latest Stories — On NDTV Profit.