- Market dip seen as a buying opportunity following technical analysis signals
- Trade execution based on multi-timeframe chart analysis and momentum confirmation
- Current trade shows a 100-point gain with stop-loss moved to break-even level
We have been suggesting that this is a buy-the-dip kind of market and over the last week and more, we have got the dip. Did people buy? I don't know if they did. It is always easy to say, during uptrends (which you have missed) that you will buy the next dip.
Then when the dip does come, you end up thinking there is going to be more declines. Bearish patterns appear magically and suggest much lower levels. Or you meet some doomsdayers (such people are always around, unfortunately) and the declining market makes them sound believable. And then the market bottoms and rallies. And you miss the rally, again!
Sounds familiar? Story of our lives.
Instead, if you mark out the extend of the possible decline (something that all technical analysts can do for you), throw in some additional signals that need to occur when the levels are seen (something that good TAs can do for you) and perhaps some Time counts (a few TAs can do this) and then you put your own brain to use to study the conditions under which all these signals are happening to decide a buy on the dip. That is the way not to miss a dip-buy.
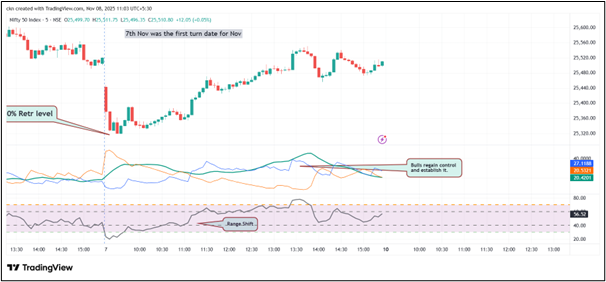
Will it work every time? Of course not. But you will know quickly enough if it doesn't. The key point is that you need to take a stance when the situation comes to hand. Here is the tweet I had sent on Friday. Made that post at 10.41am when NF was at 25439. It went on to record a high at 25551 within the next couple of hours.
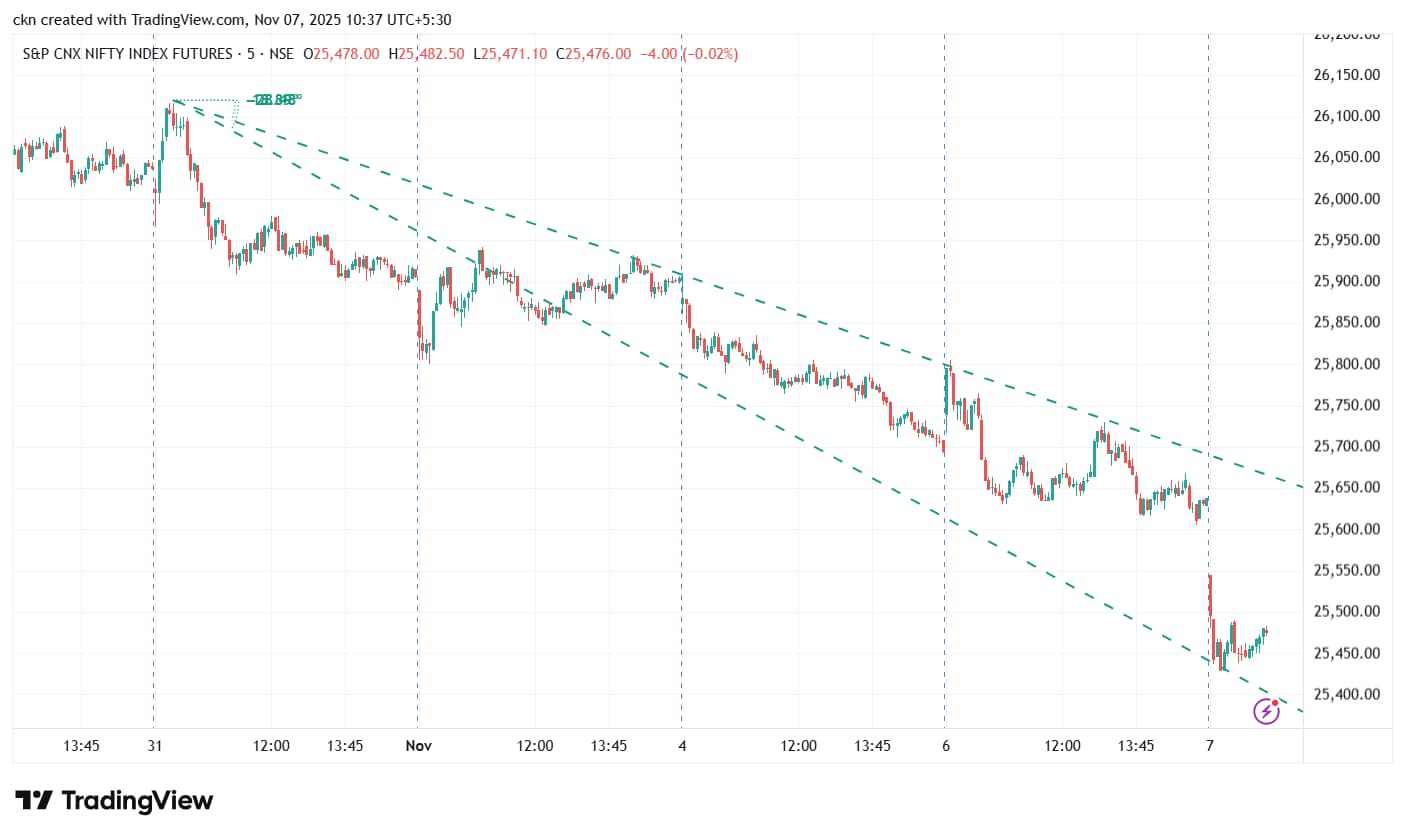
This was using some esoteric Gann stuff. But there were more obvious signals as well. Sixth successive declines into 50% retracement of the last advance. Formation of a green candle there. Nov. 7 was the first of the turn dates for the November series. Intraday charts show formations of Range shifts and bulls seizing and establishing control. All these can be seen in chart 2.
The trade comes to the prepared. You don't have to chase after them. Provided, you prepare the grounds for them. It is like laying the foundations of a building before you actually build one. People see the end product but seldom the preparation that went into the final product.
Analysis is done at the higher time frame. The buy the dip decision was from there. The set up is identified using a lower time frame. The retracements and green candles are checked in one time frame lower. The execution is done on the lowest time frame. That is where the price and momentum signal came from. This is a process that I follow. It needs some patience, to allow the whole thing to develop. Can't jump the gun any time. But when the set up appears you cant hesitate either. It may work out or it may not. But we cannot second guess.
So, we bought the dip. Now what? We wait. I have been rewarded with a 100-point run after my buy but I haven't taken trade off. Why? Because I don't have a sell signal. I have to now set it up. There are multiple ways to do so. Let's check a few.
First and easiest is target based. For that, those 100 points are good for a start. Provided I have bought some 500-1,000 shares of NF. Then I bank a decent amount for my six-day wait for a trade to arrive. You see, every target-based exit should have a meaning. If I did this kind of trades, then even a couple of trades in a month is enough to make a decent living.
Note that when I took this trade, my stop was about 120 points away (below the day's low). So there was little point in taking money off in a small advance. At least now it is a 1:1 type trade. Furthermore, it now allows me to move my stop to just below my cost, thereby derisking the trade completely. I can, therefore, now shoot for higher targets. If you time it right with the correct analysis, such situations will present themselves more often than not.
Now I have to get back into analysis to see further prospects. The first of the analysis (using daily and other time frames has got me my entry). Now, I shall check prospects on the 60-min chart, which shall tell me whether or how the trade can progress from Monday. Chart 3 is Nifty 60m.
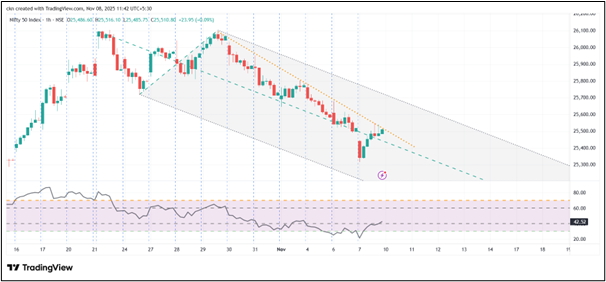
I have essentially used tools that most readers should by now be familiar. The moves allow me to draw a pitchfork and I find prices have crossed the median line. I can also draw a resistance trendline using recent price pivots. Continuation higher from Monday will put these signals in good shape. So that is something I want to see. If it doesn't happen, well, too bad. But if it does, then I may consider adding to my long positions as the Rsi is also shaping for a range shift.
So, now I know what the market needs to do on Monday and beyond and I don't need to guess. I know. That should always be the point of analysis. When you know, you can also check for whether the market does what you need it to or not. So, you are ready for anything that the market may do and are seldom caught by surprise. If things work out as expected, then I can look for the top of the pitchfork channel that lies near the 25,700 area.
That's the chart area. Derivative indicators show that 26,000 Ce is the call concentration zone. It has been added to earlier and not on Friday, where we saw more Put additions. So, even though the PCR is near 1, I feel there is a bullish bias to the data. So, look for PCR to increase as a signal that the bulls are flexing their muscles further.
The FII got back to their activity of shorting index futures once again. Down to 1.52 lakh contracts once again, after having reached about 94,000 contracts short.
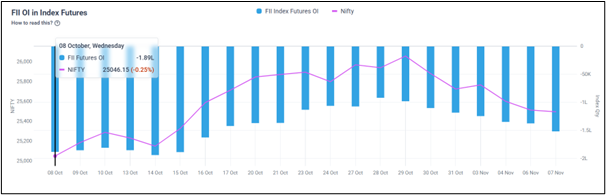
Can't understand what their beef is. Since local results and events have been largely positive, these may well be some hedge shorts and not directional. I would leave it at that. Pro traders have gone long as of Friday and I would rather tend to follow them. They were net short from Oct. 24 till Friday. They seem more clued on to the shorter-term trends.
So, we shall leave it there. The new range, as had been described in the last letter, is still on. Within that, we may experience a rally. If we get more, we shall remain happy. Q2 results flow in the first round were better than the second round. Still, not bad and certainly somewhat the lowered expectations hither it its commencement. The big news shall of course be the trade deal with the US. That is something that we need to respond to once it happens. Difficult to anticipate it. Till then, we shall play a bit of index and a lot of stocks. The only sector that shone last week was PSU Bank and the Metals (briefly). Will they continue? No idea. But if they do, we should continue to patronise them. If they don't, the market will signal us the new area of interest. We shall have to move there.
CK Narayan is an expert in technical analysis, the founder of Growth Avenues, Chartadvise, and NeoTrader, and the chief investment officer of Plus Delta Portfolios.
Disclaimer: The views and opinions expressed by experts and investment advisers on NDTV Profit are of their own and not of NDTV Profit. NDTV Profit advises users to consult with their own financial or investment adviser before taking any investment decision.
Essential Business Intelligence, Continuous LIVE TV, Sharp Market Insights, Practical Personal Finance Advice and Latest Stories — On NDTV Profit.