- Market showed minor weekly gain after six weeks of decline but momentum remains weak
- Smallcap index peaked mid-July and has since declined, indicating limited rally triggers
- Support zone near 24,500 is crucial; a fall below may signal further declines
After a decline of six weeks on the trot, the market showed a green candle for the week ended Aug. 14. Relieved? Maybe not. The range for the week was just about the same as the previous one and there were no plays on sectors to carry us through into the next week. Looking at the moves of the truncated (by a day) week, this is what we find:
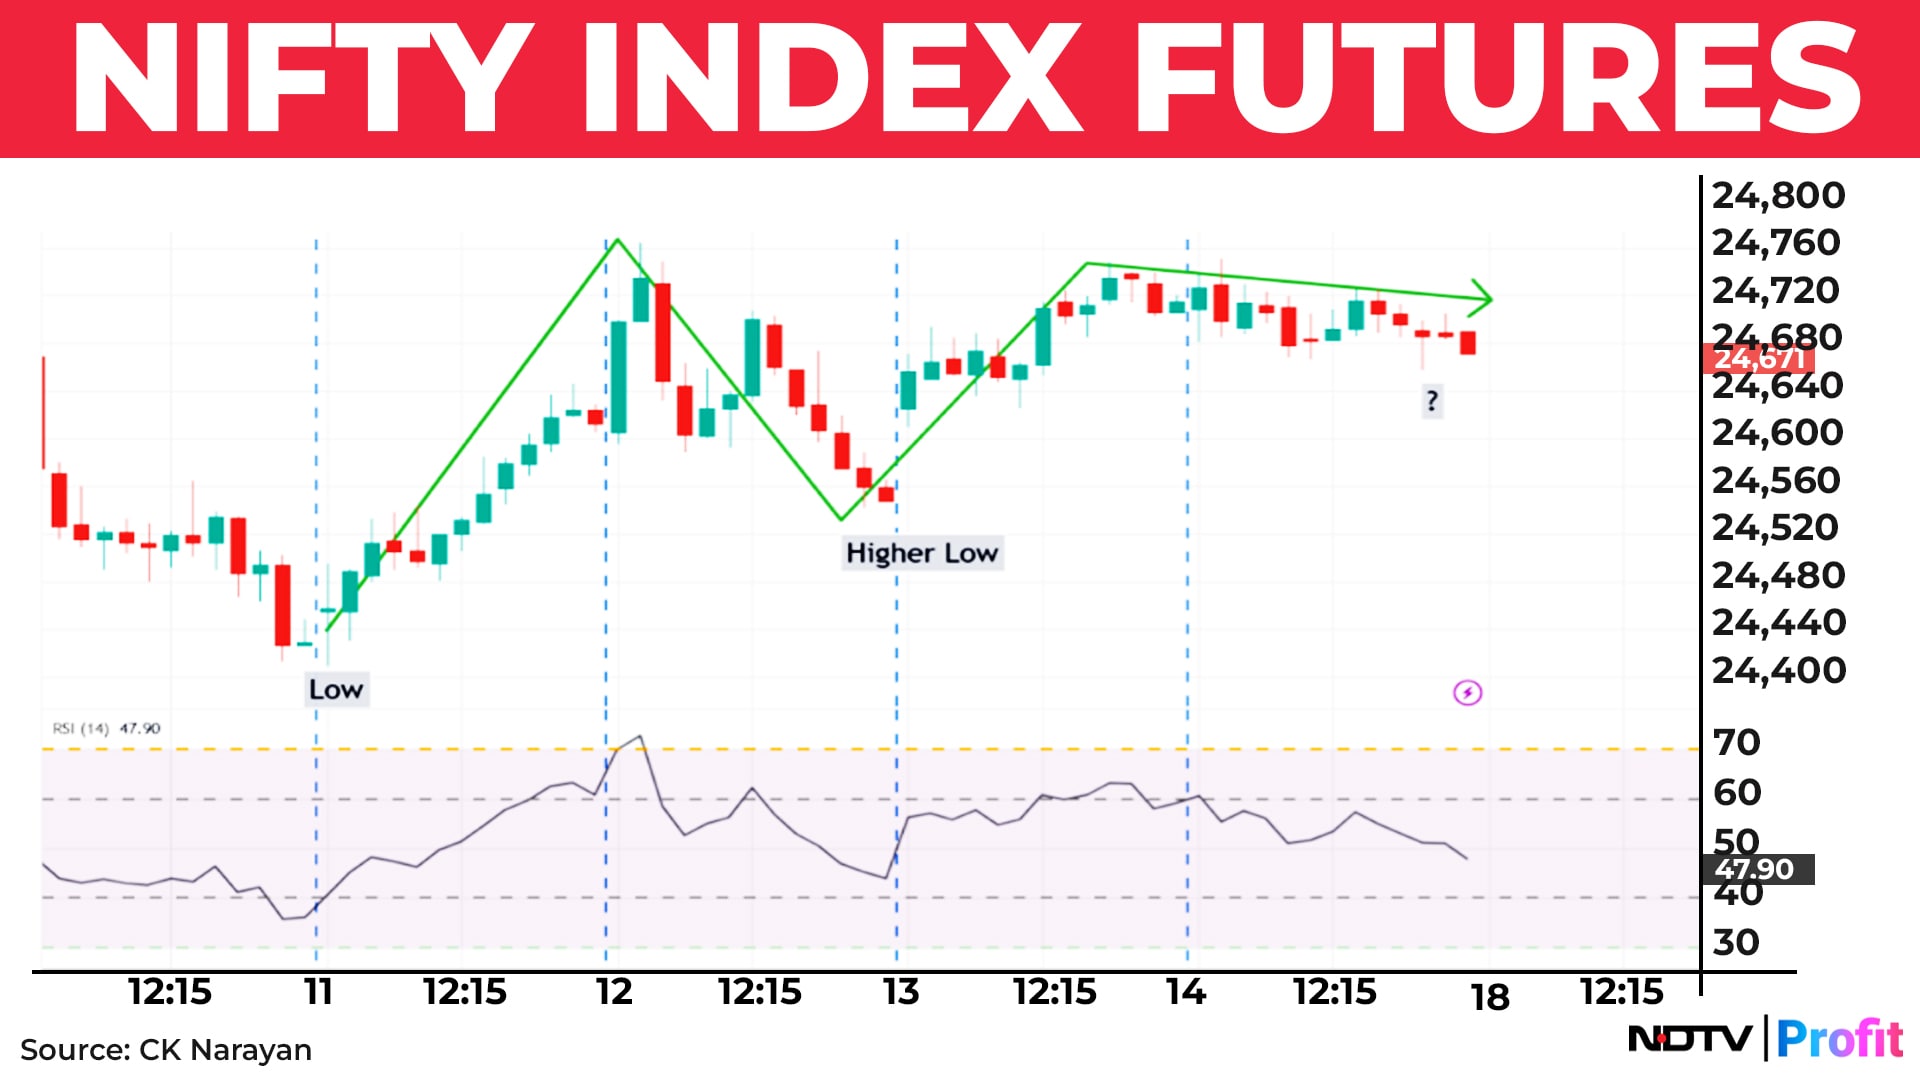
What do we have? Last week low held and a rally unfolded once again. There was a pullback on Tuesday that formed a higher low for the week and the rise continued (but no newer high for the week, note) and ended uncertainly. This is not a strong rally on the charts and the same is being borne out by the tepid momentum readings shown in the chart. Ergo, last week, has done nothing to change the situation that we have been discussing for a while.
And what have we been saying over the recent letters? Here is a snippet from two weeks ago: “Hence, the default short term setting for the week ahead is for continued bearishness or resistance at higher levels.” Followed up with, “As discussed last time, the main trend is still up even as the smaller trend is shedding ground. The only way to play this is to short weak stocks if you are into the short term”.
In both cases I have been speaking about shorting weak stocks. Now, there have been weak results creating opportunities in many leading stocks where one could play the short game and profit even in this market. Examples are stocks from private banks and many from consumer staples sector, among others.
Then, writing a view point for the swing trader or positional player, I had stated “it has been a waiting game, waiting for the market or some stock to come into the right price area. But that is a patience game. Not the long suit of many”. That situation has still not come about, even as of last week.
Commenting further on this matter in an effort to finding a possible reason for the persistence of the decline, I wrote, “One more reason for some discomfort with the current decline among people is that the small cap index was sliding. The rally, that began here from the same June 20th had moved rather nicely, holding its levels even during the periods when the large caps faltered in between. The rally seems to have peaked finally on 17th July and since then we see a slide”. Chart 2 shows the updated Smallcap 250.
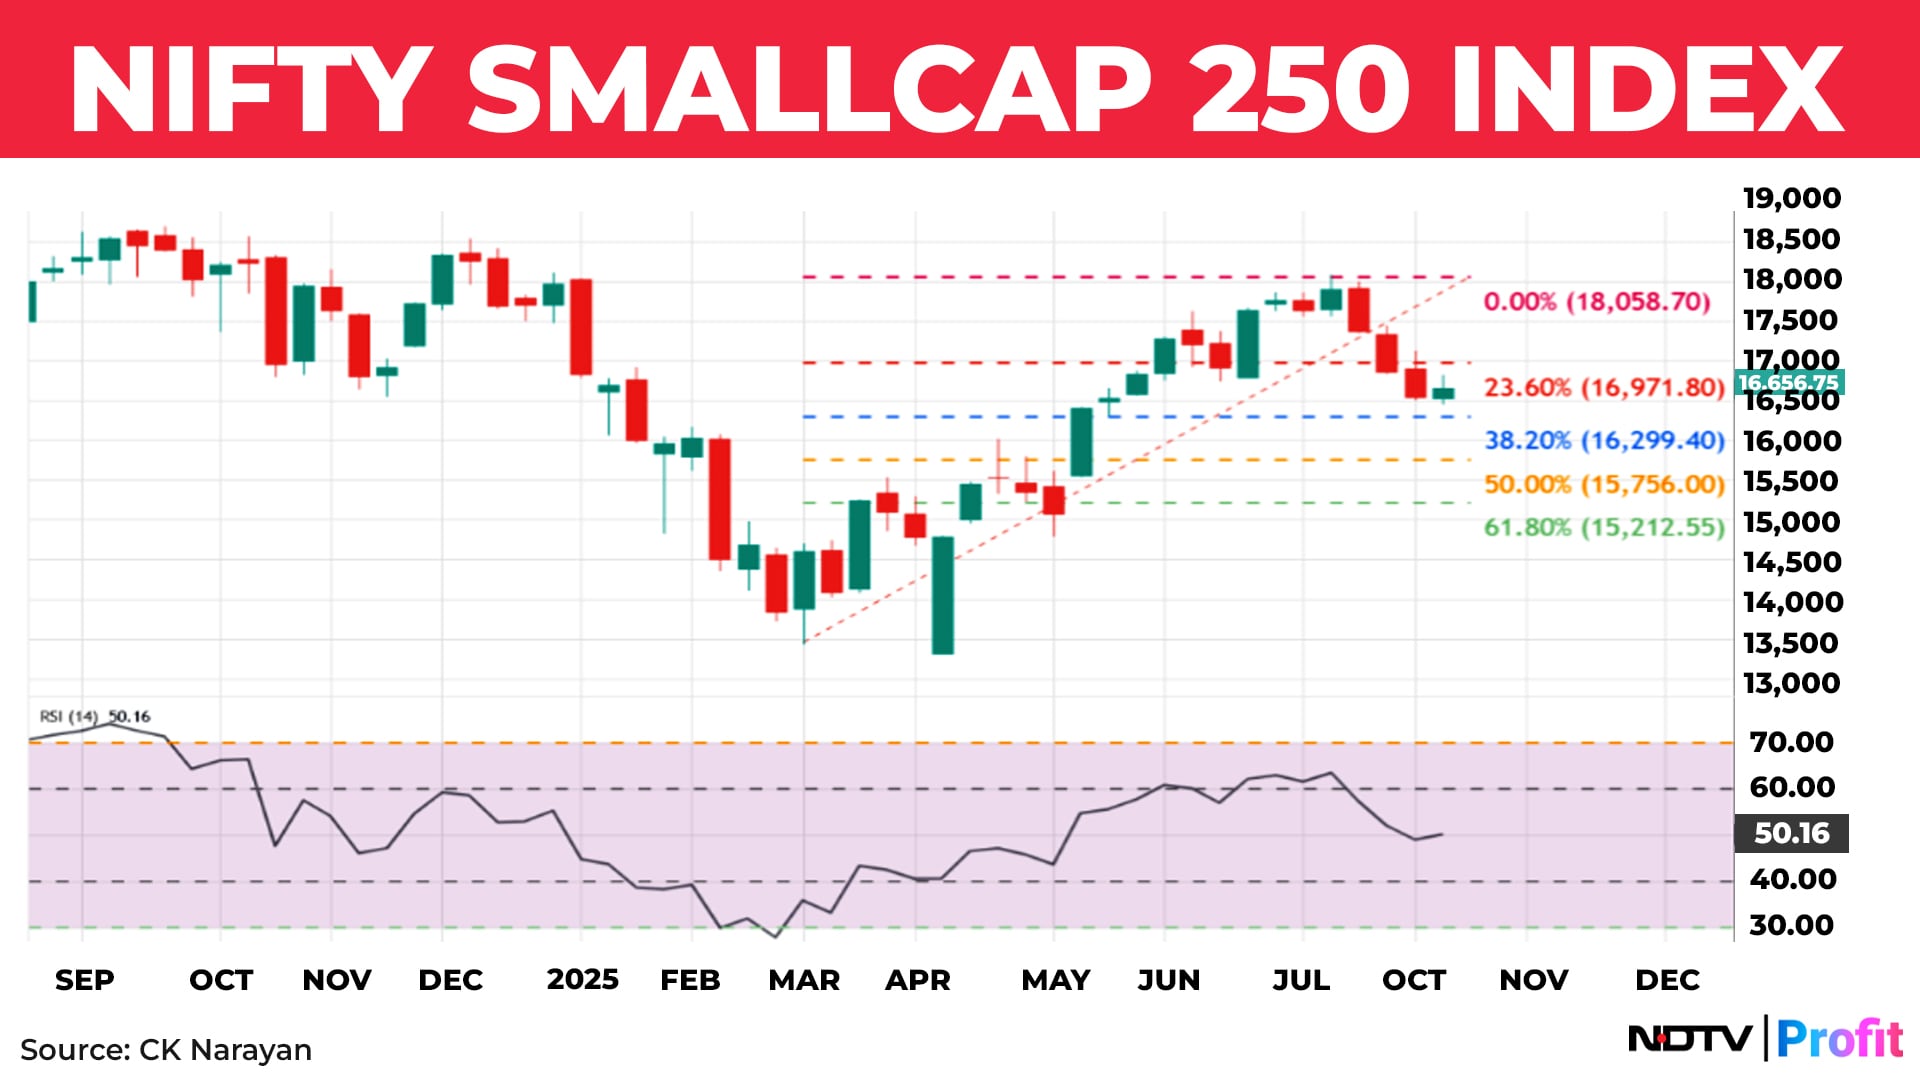
This chart shows that the rally into mid-July lacked momentum strength and is more likely to slip if there are no good news inputs. With the earnings season now more or less ended, the likelihood of triggers is limited and so, we should be looking for continued down drifts rather than rallies. If portfolio values of players keep decreasing or if they don't make any money on their investments, then the sentiment takes a hit and that leads to declines at the first sign of resistance.
Further we looked at time counts, falling around 5th of August as we were nearing the support zone near 24,500 too. I wrote, “So, it seems like we are having some time counts coming up in the next week and bunching up near the support zone in price @24500. That is nice and it gives us something to look forward to in the week ahead to spot some kind of reversal”. But no reversal came of it as the index slid further (though not by much) and hit some further lows lower.
We tried to see some supportive evidence from the other indices and here I wrote, “The other indices too are in similar situation, so the job of reversing from support is going to be tough. Hence, it would be more prudent to expect some consolidation to occur rather than reversals from the upcoming price and time nexus.”
We carried on thus - rallying a bit, where it seemed like we were holding on to the support- it still does- but with follow up attacks on the base. This inability to carry higher is indicating weakness of bulls and some renewed determination of bears. Given this situation, I had written in the last week, “This would mean that we may have to continue with a sell the rally approach in the index even as one tries to find some diamonds in the rough of quarterly numbers for investing. It will require a move past 24900/56150 (on spot) for the down drift to get arrested any.”
And there it rests now. If you go back to Chart 1, you may see a small attempt to form a Range shift pattern on the RSI. Hence the higher low marked at 24500 area now gains some importance. This fledgling pattern of the bulls will fail if the Nifty future recedes below that level in the week ahead. So, for short term players who may be harbouring some bullish intent, that should be kept as a stop level. Equally, for bearishly inclined traders, the same 24500 level will act as a trip level for more declines ahead.
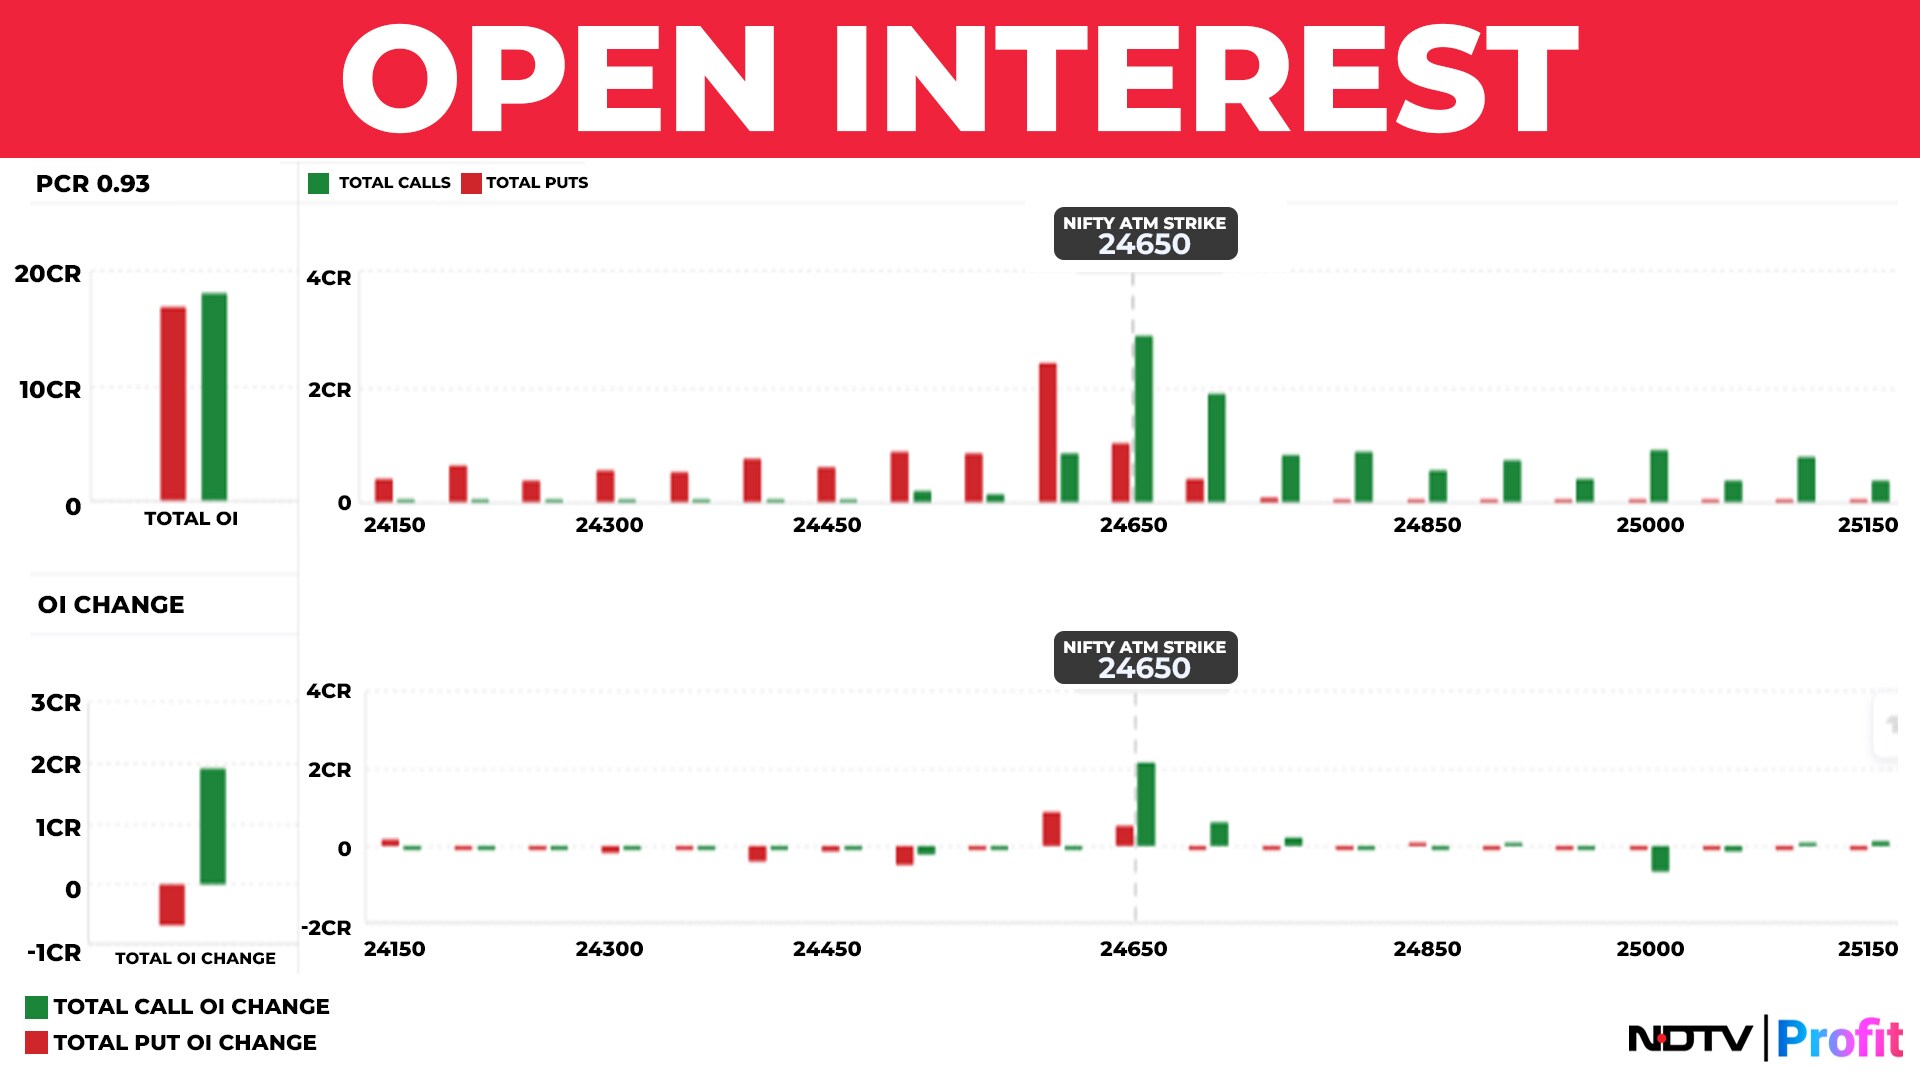
On the options front, we continue to see frequent flips, that are lasting maybe a day or two at the maximum. As of Friday, Chart 3 shows the situation of calls ad puts. With PCR at 0.93, it is kind of split in the middle but call shorts dominate a bit. Call additions appear to have occurred on Friday. Note that there is no significant Put short position below the current levels as well, to act as a cushion. Hence, it seems like traders are going to play it as it comes in the next week rather than take up any pre-determined positions.
FII selling continues and their position in Index shorts stays around 1.82L contracts. So, no change in their views evidently.
High SIP flows keep money coming into DII coffers and hence they will continue to remain buyers in the market, absorbing FII selling. IPO market is brisk and some of the FII money is going in here so their interest in our markets persist through the primary market route even as they sell out in the secondary markets.
Margin Trading Funding (MTF) reached a record high in August, exceeding Rs 96,000 crore, reflecting strong investor confidence despite market fluctuations. This surge indicates a growing appetite among retail investors to borrow for stock market investments. The figure for July was around Rs 88000 crore, while at the peak in September 2024, it was Rs 85,400 crore. Now, this is a very contrary indicator to what is visible in other indicators of the market.
The increase in the MTF shows that the sentiments towards the popular stocks is still very positive. For example, the top counters where MTF was at work include HAL, TCS, and Tata Motors, among others. Trends are not exactly very bullish in these names and therefore it could also mean that these MTF positions may get pressured if there are fresh declines in the market. Remember that one of the biggest reasons for the sharp decline in the past Sept 2024 high was unwinding of MTF positions.
Summing up, we continue with a sell-rallies approach. There are too many imponderables in the air at the moment so unless we see some new evidence to the contrary, we don't want to change our approach just yet.
Disclaimer: The views and opinions expressed by experts and investment advisers on NDTV Profit are of their own and not of NDTV Profit. NDTV Profit advises users to consult with their own financial or investment adviser before taking any investment decision.
Essential Business Intelligence, Continuous LIVE TV, Sharp Market Insights, Practical Personal Finance Advice and Latest Stories — On NDTV Profit.