


Last week was a curtailed one with just three days of action. So, perhaps not enough new material to work with, given that we had one big down day (Tuesday) followed by two inside sessions after that. That is, like, quite neutral with a down bias.
On a weekly candle basis, we had the second lower low candle, making that a continued change from the past. I am labelling it a down bias because we have been unable to cross even the midpoint of the long body candle of Tuesday.
Technically though, it is the first weekly candle down. A typical correction, runs about 3-4 weeks. So, if you combine the above three findings, we have to conclude that we are still in the middle of a correction that has been set off from the highs of Jan. 15. Given that, that too was a time count zone where the price target also had been met, we have enough evidence to expect the reaction to continue. Chart 1 shows the progress to be in line with the forecasts made in the earlier letter.
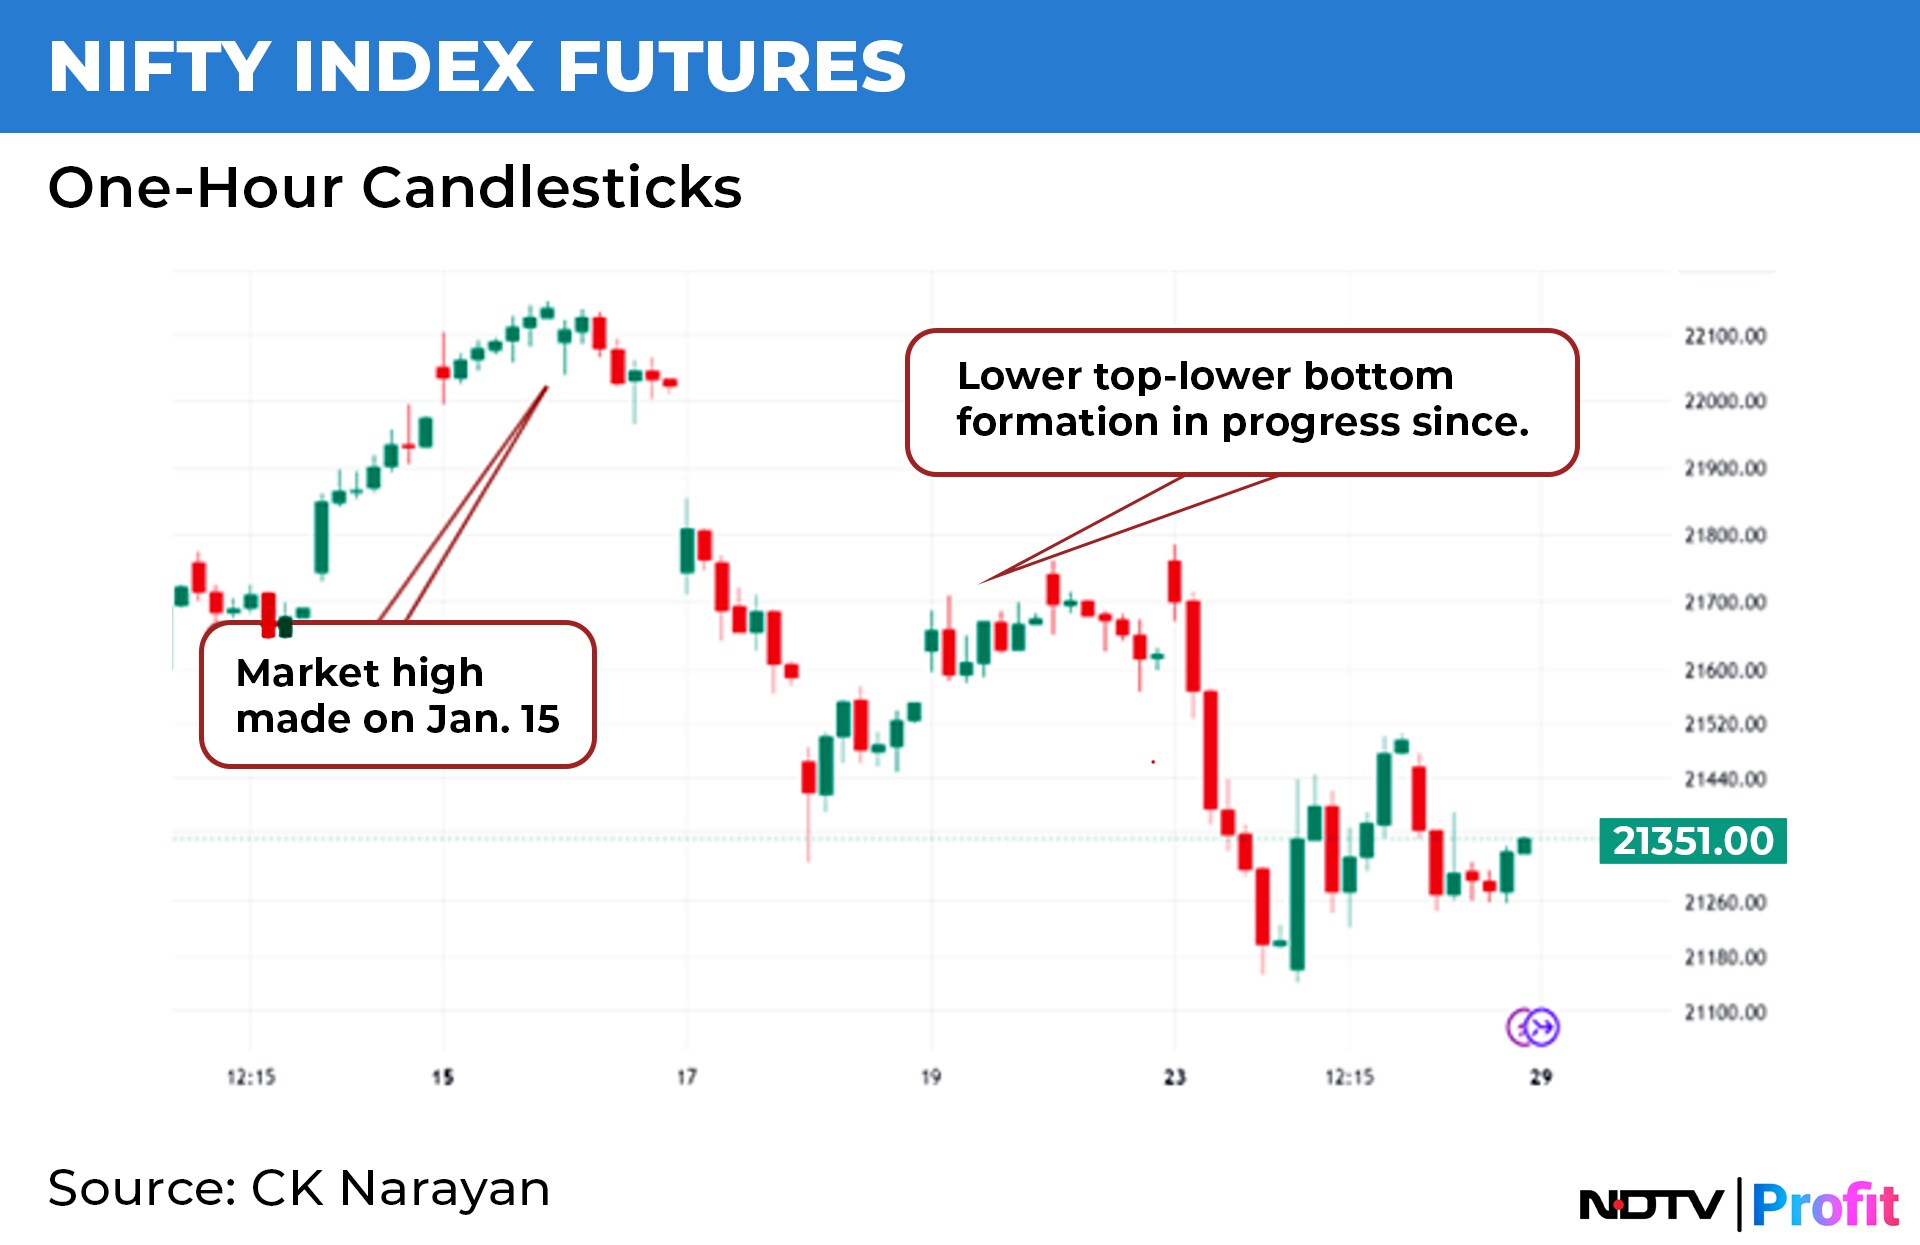
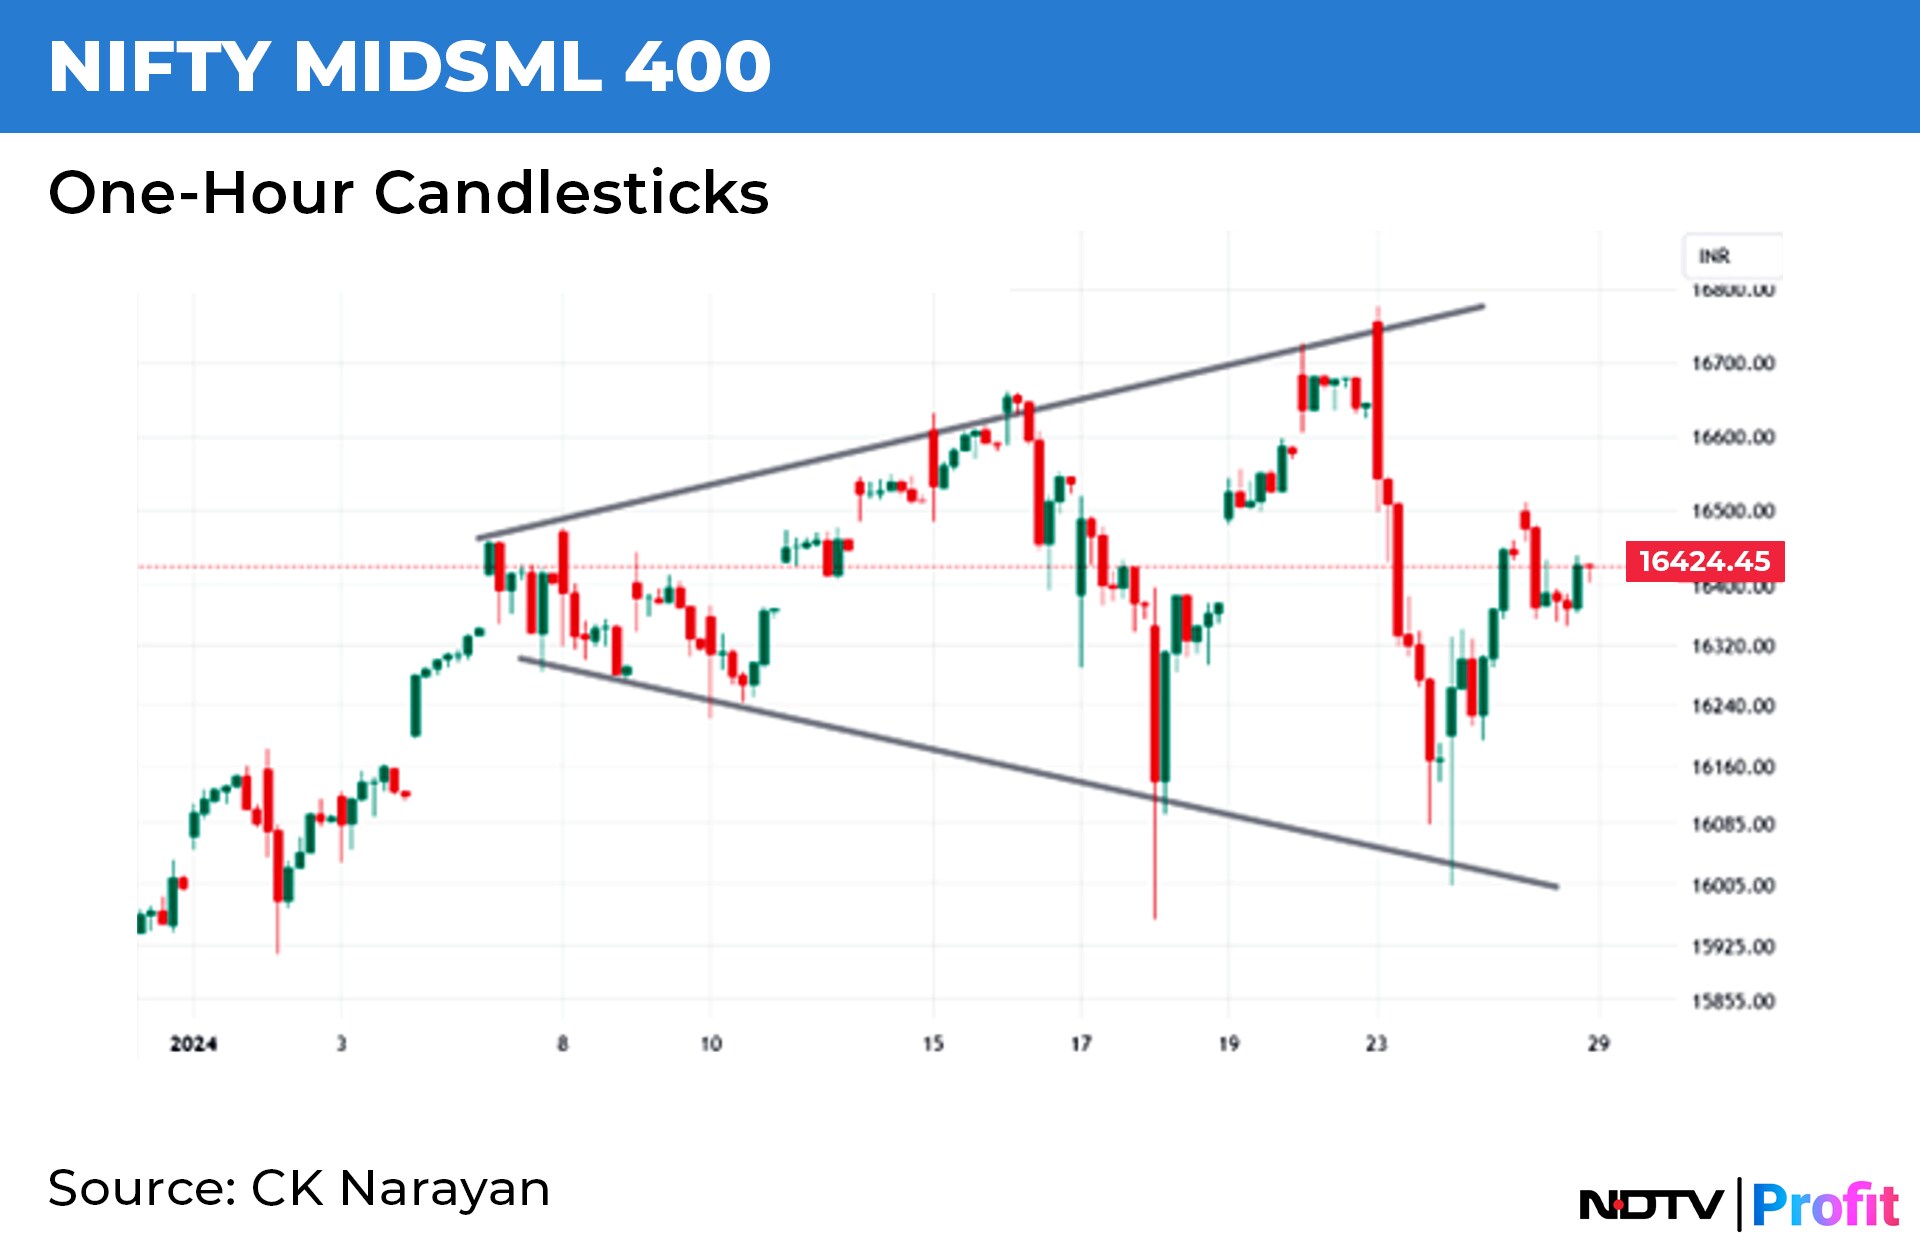
The other forecast that had been made was that then top would get a bit spread out and hence, a window up to Jan. 15 had been given for a topping out action. Chart 2 shows the broadening formation in MidSmall400 index, the representative of the next run of the market where there was major amount of action.
I had stated earlier that the presence of high momentum coupled with a strong sentiment would ensure that a high would not be an A-type correction, which usually require an event to get triggered. Instead, the market was experiencing a consistency of positive news flow that kept the score ticking on the sentiment board, enabling different sectors and stocks to create some localized highs.
Also, the earnings season had just commenced and market would allow for some leader names to come out with their numbers before making up its mind. The numbers have not been able to flip the sentiment back to bullish. HDFC Bank Ltd., set the ball rolling for the bulls to bail out and other private banks' results could not undo that damage, despite ICICI Bank Ltd.'s results being much better than expected. PSU banks tried their best to keep the flag flying for the financials. IT held up owing to low expectations but that may not help too much.
So, everything panned out as per the forecast as events played in line with the pattern expected. Chart 2 shows the set-up in MidSmall400. A clear expanding triangle is visible and this has continued bearish implications.
So now, where we have reached is a point where the main index is struggling and slipping into a reaction and the broader market is showing some bearish set-up. Let's see the situation in the Bank Nifty charts. See chart 3.
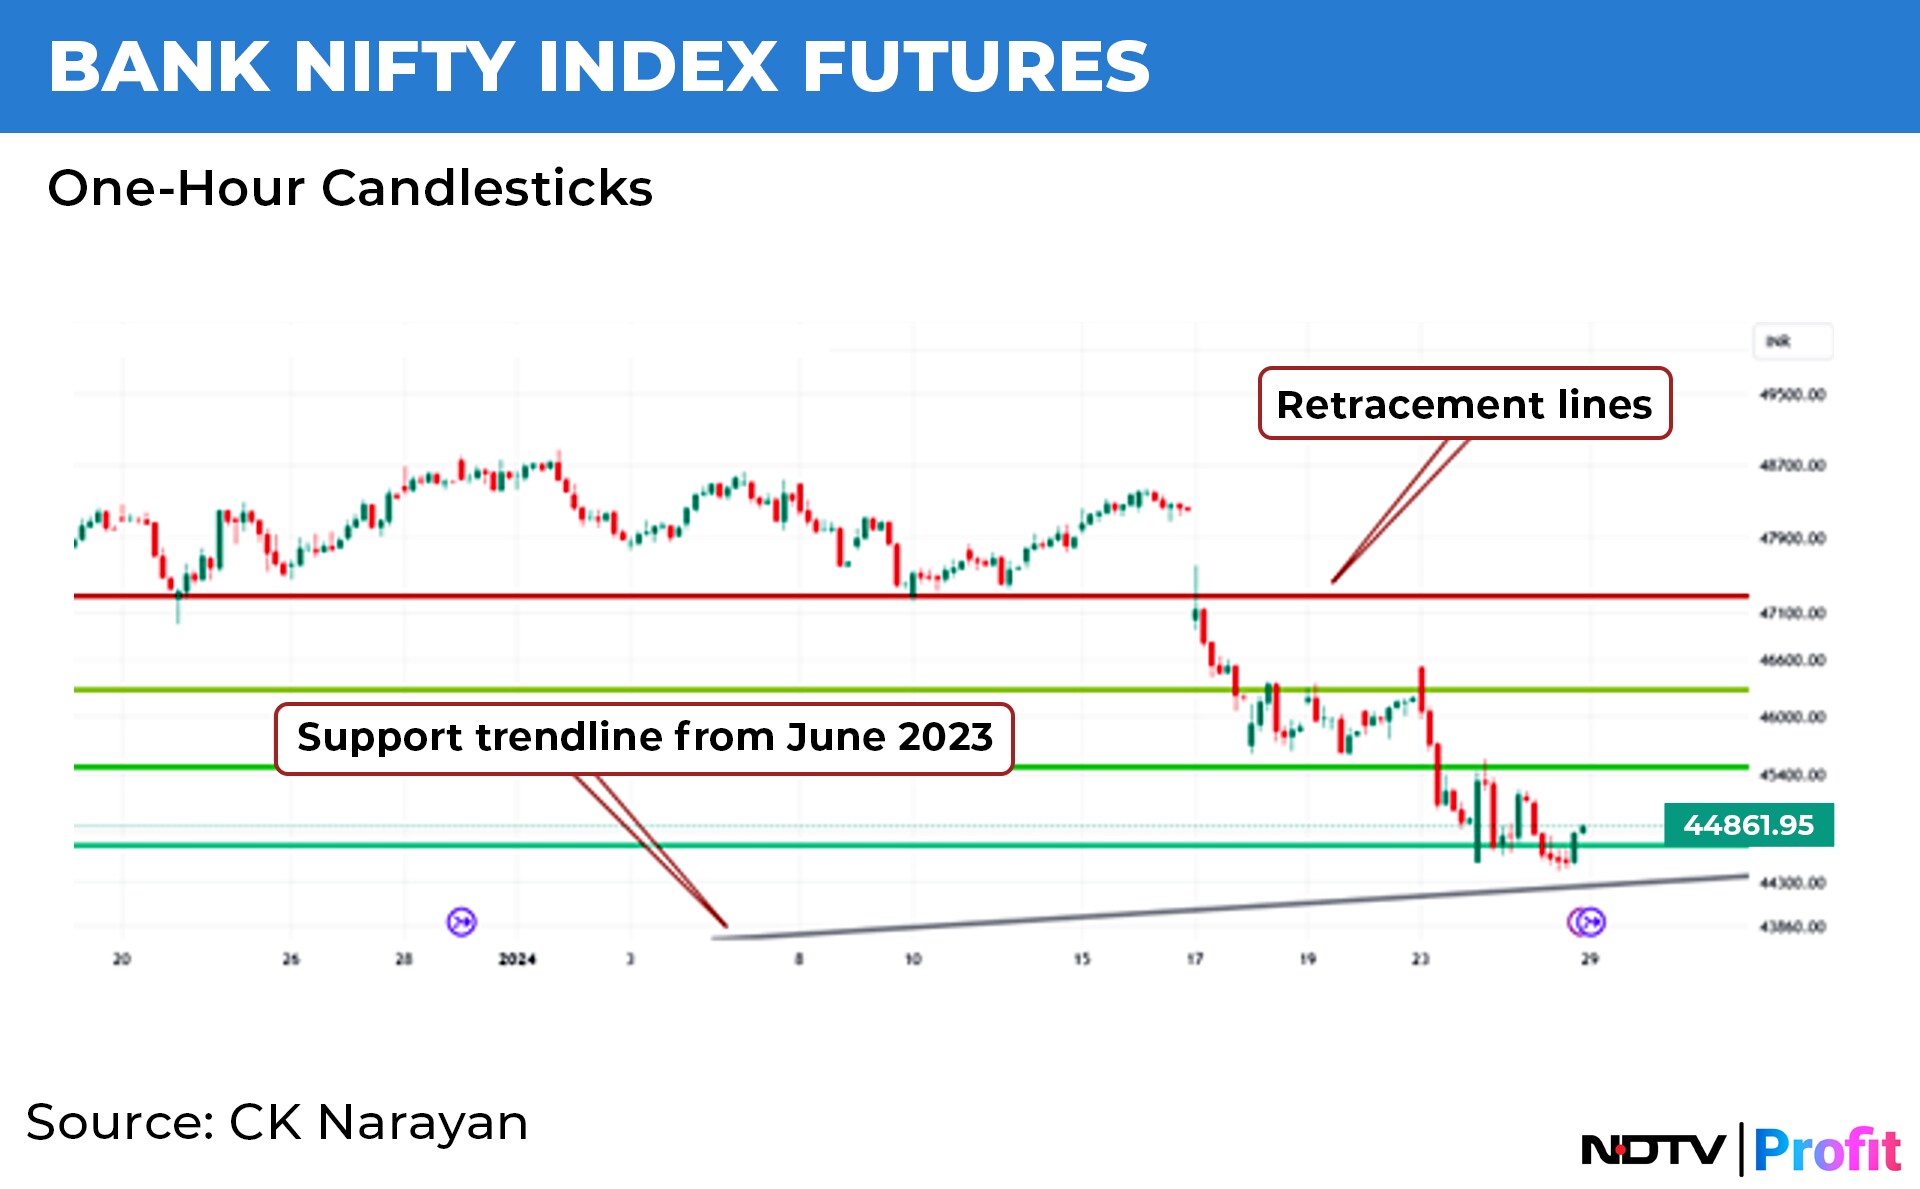
Here we note that the Bank index has fared much worse than the Nifty and that may have caused a lot of problems since majority of day traders are present here. We see that the prices have slipped to 62% retracement of the upmove since the Oct. 23 low (in comparison, the Nifty is not even down 25%) and the prices have nearly reached the main support trendline coming up from the major low back in June 2023. In fact, a break of this support could well mean more trouble for the banking pack.
So, this important area of the market is also supporting the bearish bias that is currently visible in the markets.
Where does all this weakness fit in with our overall expectations of the markets for the year? Well, on that count, it fits in perfectly. This reaction was expected and warned. Some evasive action was necessary to protect portfolios and contain losses. The long-term forecast has the market remaining down through much of February and hence, this too is in line with the earlier statement that we can look for continuation of the correction for about three weeks more. We will be going on to make the low for the year in the month ahead.
Therefore, it is not one to be feared but more of one to be handled properly. Long-term investors need not bother as there is plenty of advance in balance for the rest of the year or more to look ahead to. If anything, they should be looking at the decline with welcoming eyes. Medium to short-term investors may need to adjust their portfolios and/or buy some protection or partially stay in cash to hunt again at lower levels that may present themselves ahead.
Momentum investors were advised to continue to be in the hunt for opportunities in this month as well, as a stretched out topping formation would offer good opportunities, particularly in light of earnings season playing out. Traders have the freedom for going either way, depending upon the weather of the day or week. These had been pointed out across different letters in recent weeks.
As things stand, at the end of the week, nothing much has changed and we can continue to hold on the approaches as described above.
The Bank Nifty may be reaching some support zones and has potential to rally. However, the results for the major banks have all played out and views taken, so it may have to be something specific by way of news that may trigger any upmove.
Even then, we would be looking only for a rally from oversold zones. The PCR on options has moved down to near the 0.60 levels and there may not be much room to slide further. As mentioned earlier, the better results of ICICI Bank should probably help that stock to lead any revival. PSU bank charts are still well-placed to be a performer across the whole of 2024, but they lack the power to move the needle for the Bank Nifty. But, they should be part of any upsides that may occur in bank sector across the whole year.
Readers may keep note of this expectation as a sector play for the year. One of the trades that I will be playing in line with this view is to have a core long position in stocks like Bank of Baroda and Canara Bank across the year and then keep managing that position using a mix of profit-taking and option writing.
What about the other heavyweight sector—IT—where some hopes have been rekindled? See chart 4 of the weekly IT index.
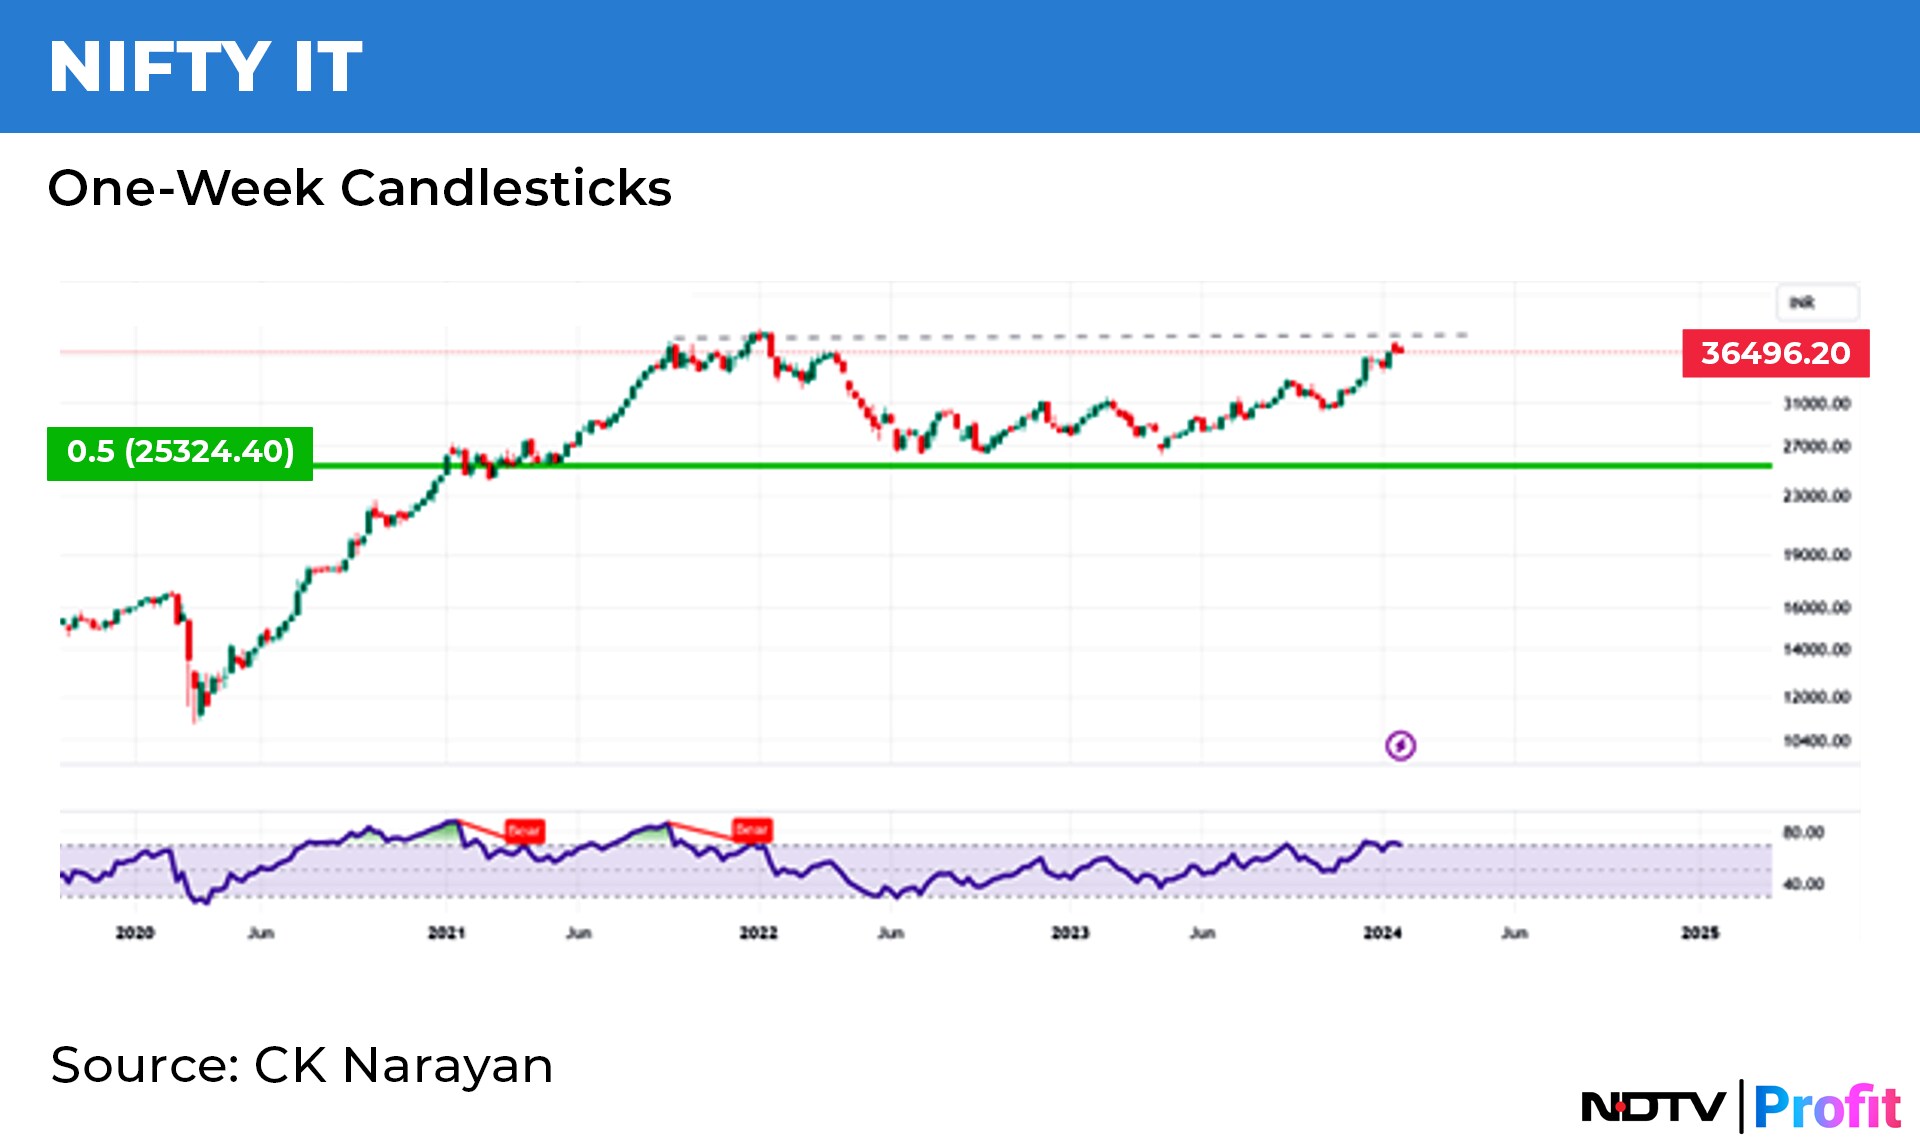
What we see here is a nice pullback to 50% of the larger uptrend from 2020 low. The rally since then has been a gradual one and prices are now about to trade into former consolidation tops—a natural resistance area. Note that as the top is being approached, the momentum readings are not keeping up. Not an encouraging signal for a thrust to new highs.
The results of the majors were not anything significant. It is more the second rung of stocks (Persistent Systems Ltd., Birlasoft Ltd., etc.) that appear to be now flying the flag for the sector. They have been running well and hard for a while and it is difficult to see them drive the index to new levels.
So, chances are, this area of the index representation, too, is not going to help the cause much either.
Putting together all these, I would expect the corrective phase of the market to continue further into the coming weeks. The way to approach it has been indicated in earlier part of this letter. Use rallies to short (for traders). Investors, wait for mid-February or later to revisit for candidates. Momentum investors ease off a bit and hold cash. Option shorters look beyond the day, across multi-days if you can afford the margins and the M2M.
No major slides unless some big triggers from overseas. But at the same time, no big rallies to be expected either. Be a trader. If you can't be one, just stay by the sidelines.
CK Narayan is an expert in technical analysis, the founder of Growth Avenues, Chartadvise, and NeoTrader, and the chief investment officer of Plus Delta Portfolios.
The views expressed here are those of the author and do not necessarily represent the views of NDTV Profit or its editorial team.
Essential Business Intelligence, Continuous LIVE TV, Sharp Market Insights, Practical Personal Finance Advice and Latest Stories — On NDTV Profit.


