The govt came through yet again - modifying the GST structure as promised by Modiji in his Independence Day speech. Initially, there was some ecstasy, that this was it, now the market should go up. But that soon turned to dismay - on the same day, verily, as the price action surrendered the gap formed at the open on the day after the announcement.
The FIIs continued to pound the markets with more sales (16 billion so far this year) and that kept the sentiments under check. The additional tariffs kicked in. Trump continued to sound negative about India and our cosying up to Russia and China was not taken kindly by the US.
No fire and brimstone yet from the US, but we can probably let go of any immediate expectations of pushback of these additional levies, even as the Indian government continues to comfort us that ‘trade talks' are still ongoing. I guess we need to sum up the current status of the market a bit here, as there seems to be a lot of confusion.
Trend: Uncertain. We had a strong rally (above 78.6% retracement of prior decline) and then a quick surrender of gained ground over six successive weeks, followed by three weekly candles of absolutely uncertain movements. No one has a clue where we are, with any degree of certainty.
Sentiment: A bit all over the place. So, lets see it through the lens of time frames. The short term is one of confusion and a deep sense of dismay, with most people wondering what more does this market need to go up? The mid term was holding up but the inability to hold on to gains is creating a dent in the positivity, created by the May-June rally.
Now, many are beginning to question the sustainability of the rally itself. The longer term is still holding up nicely, as the DII buying combined with rising SIP figures, government action on structural reforms etc is helping people keep their hopes up that it is just a matter of time before the corporate results improve.
Bias: Is getting built on news flow. The day the news flow is good, markets are up nicely but a small news or two that says otherwise, and the markets are down the next. So, difficult to call the bias as of now. Need to be just nimble to profit in such markets.
Momentum: Leaning towards the positive on the daily charts, as a range shift pattern develops and a slight rise is seen on the RSI, now reaching around 50 levels. More robustness is required here.
Breadth: Has been improving a tad and last week was probably a good one, as can be seen in chart 1 (weekly sectoral breadth). Barring IT, every other sector index sprouted a green. Can this convert into something better in the weeks ahead?
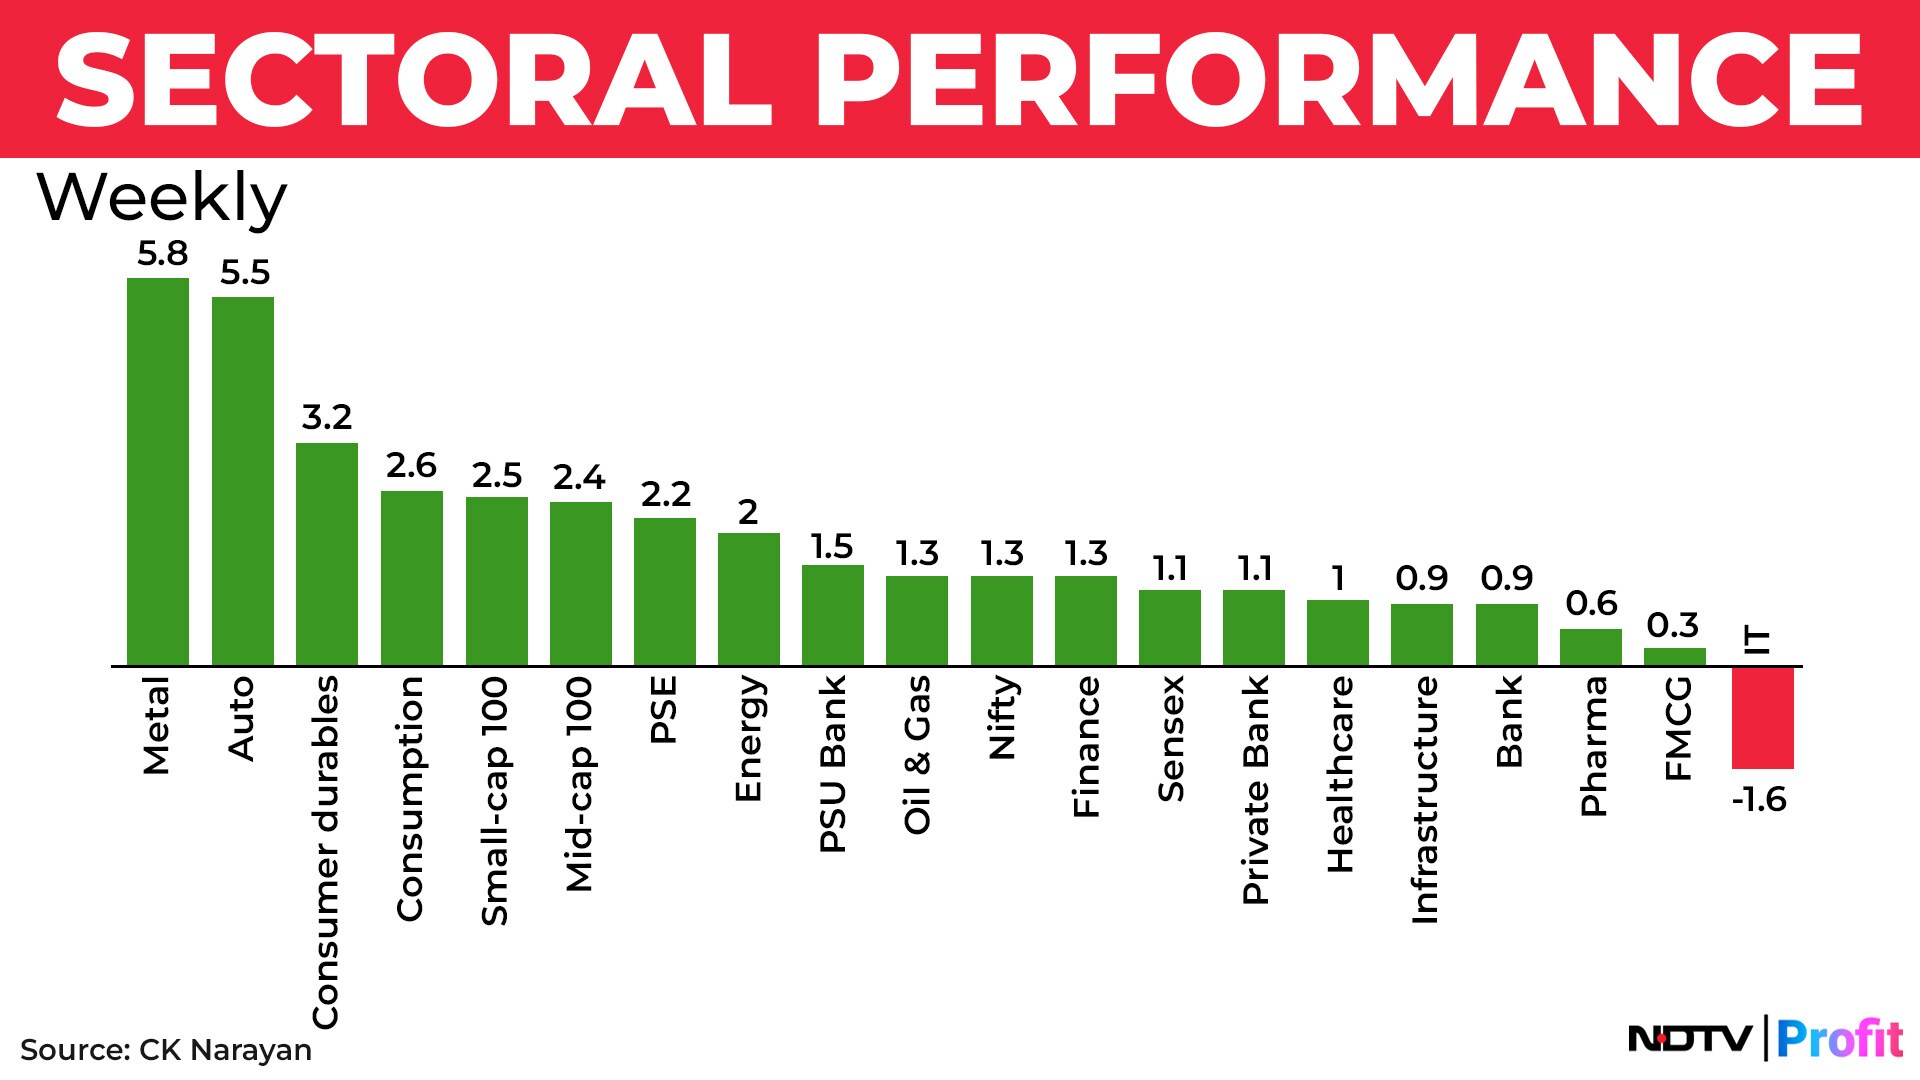
Considering that the sentiment was not so positive across the week, the wide positive breadth is a bit surprising.
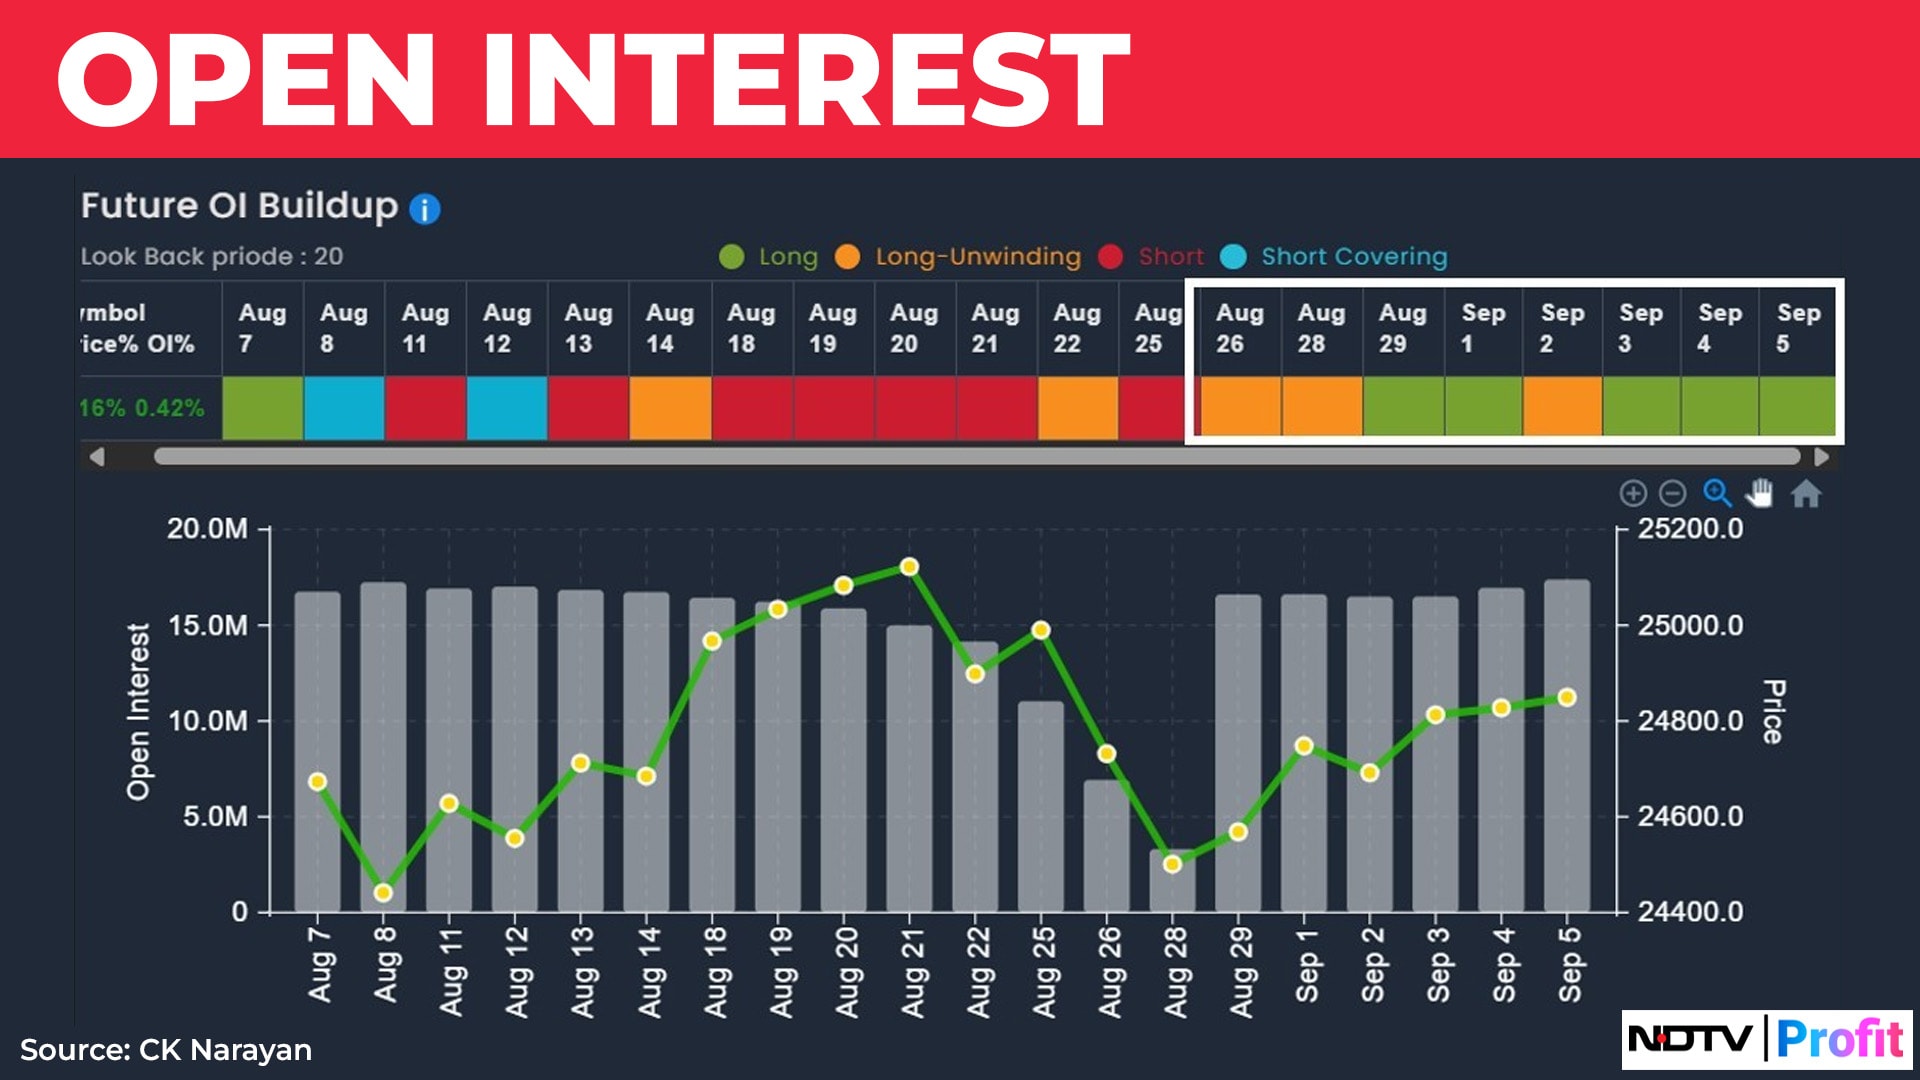
Something similar was also visible on the Futures OI build up of the Nifty. See chart 2. From the turn of the new series, there has been fresh long build up (largely), even the quantum of the build up is not too large.
Can these two now team up (equity and F&O) and create something positive in the week ahead? That would be something to watch.
But all these are not really prompting the FIIs to shift from their pathway of Index shorts. They continue to build or extend their positions, with the net index short contracts now reaching 1.91L contracts for a 92% short position.
We have seen that the overall FII ownership has dwindled, through the years, from around 21% to around 15% now. Could it be possible that this large FII short position, that refuses to be shaken by any development locally, is a hedge short against the equity long? With earnings not coming through and the currency declining, this is quite possible too.
I would think of doing it if I were a fund manager of a large India book, Mark Mobius views notwithstanding! This is a thought that I wanted to share. No idea if this is along the right lines, though.
But if it is a hedge, then we can relax slightly as it doesn't mean some collapse of the markets lies ahead of us. However, at the same time, it may also mean that there won't be any large-scale short covering without there being some solid news flow. A bit of a pickle, there.
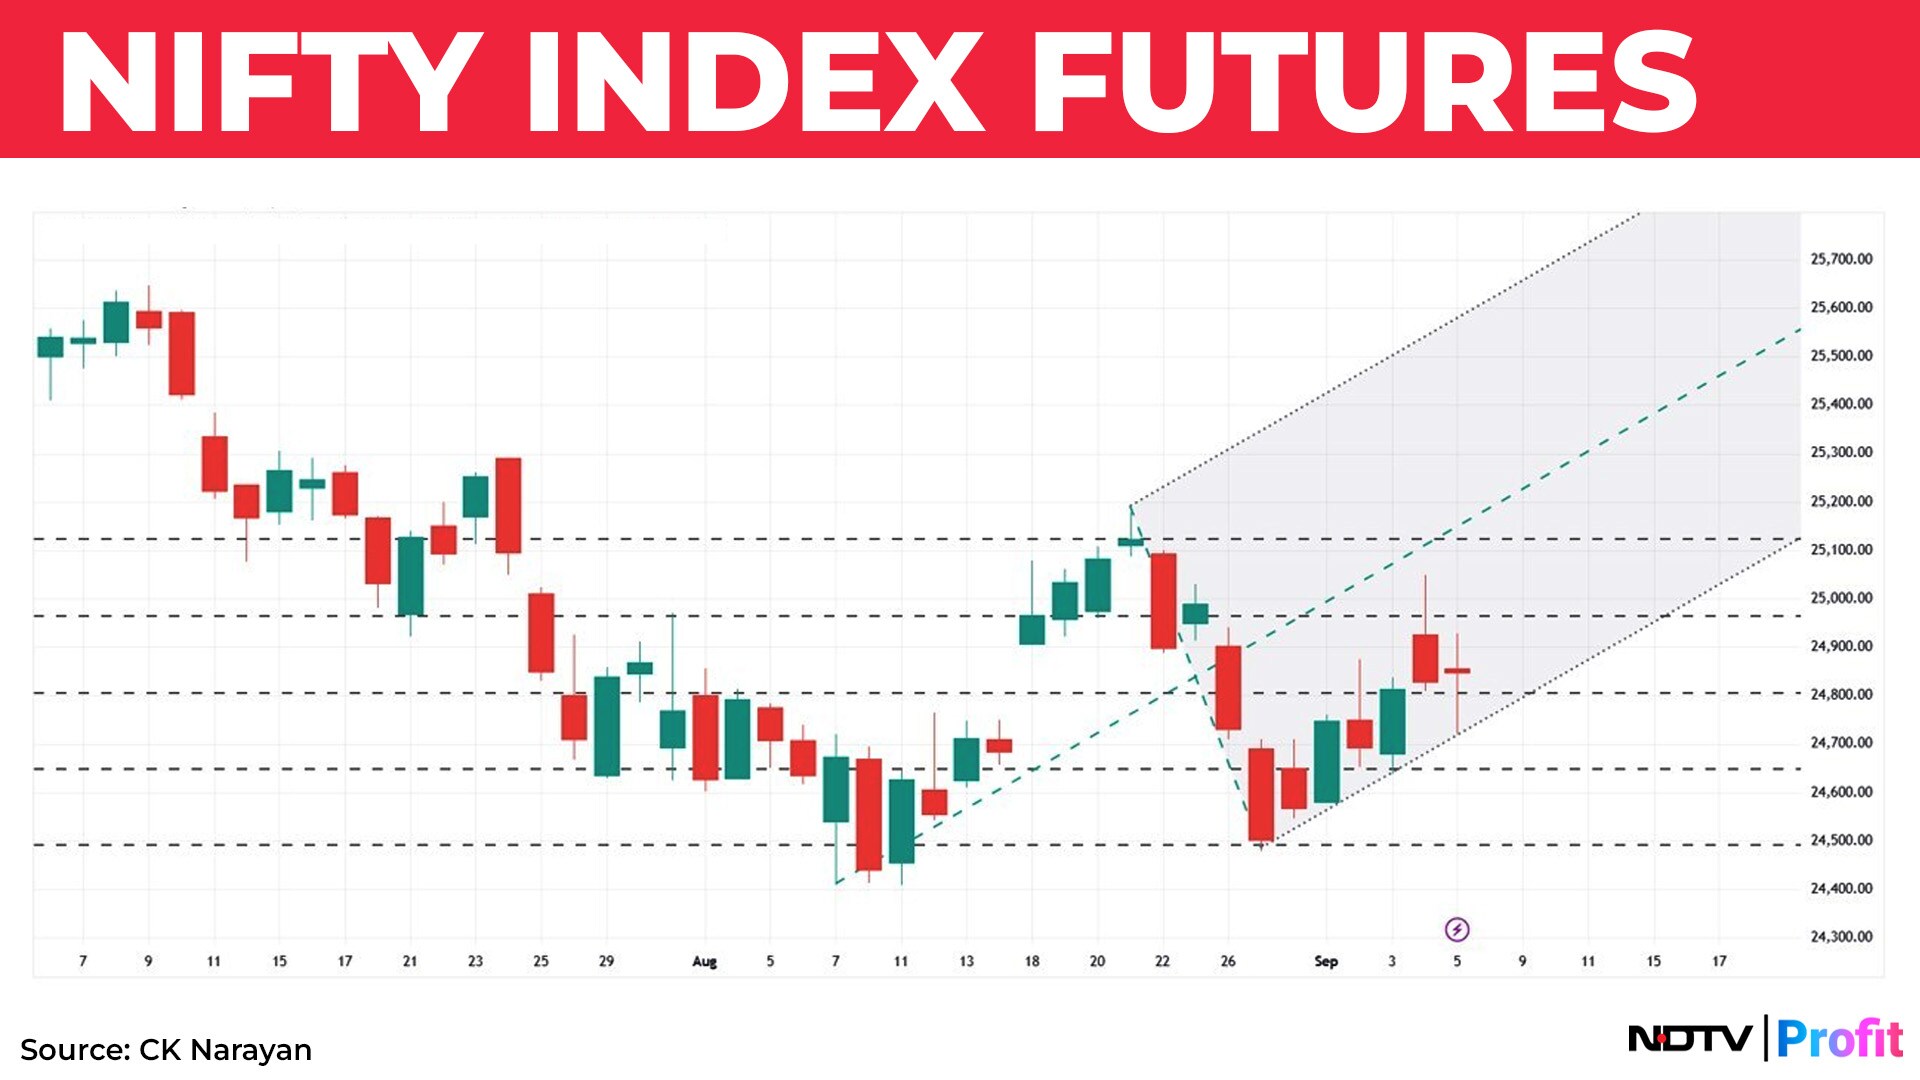
Given all these vacillations, where and what is the price doing? Nothing outside of the expected, really but certainly nothing that is desired either. Chart 3 shows the weekly set up of the Nifty future with Gann price cycle lines.
When prices are moving a bit erratically, it is natural law method that can be relied upon and two of them are shown here. The second method is the Andrews Pitchfork channel. The chart also shows the progress of momentum through the RSI indicator.
The June rally high was made against a Gann price line and the six-week decline from there bled thru lower cycle lines and the most recent rally (to 25,179 on 21st Aug), too was to a price cycle line.
A slightly higher bottom was made on 28th Aug (also on a Gann price cycle line) and assuming a possible unfolding of a new rally, a pitchfork has been drawn using the pivots formed in this phase of price action. This channel now provides a support nearby for more aggressive traders. Others can follow the Gann lines for setting stops and targets, if they wish.
It can also be noted that the prices formed a range shift pattern with the dip of 28th Aug, which makes 24,500 closing prices of that date a reference close for measuring momentum shifts in the coming days.
Using Neotrader Ichimoku scores, we find a general deterioration of the score values. Recall that earlier scores had fared well for weekly and monthly time frames but these have whittled over the past several days of uncertain moves. Table shows the scores for Nifty and Midcap indices.
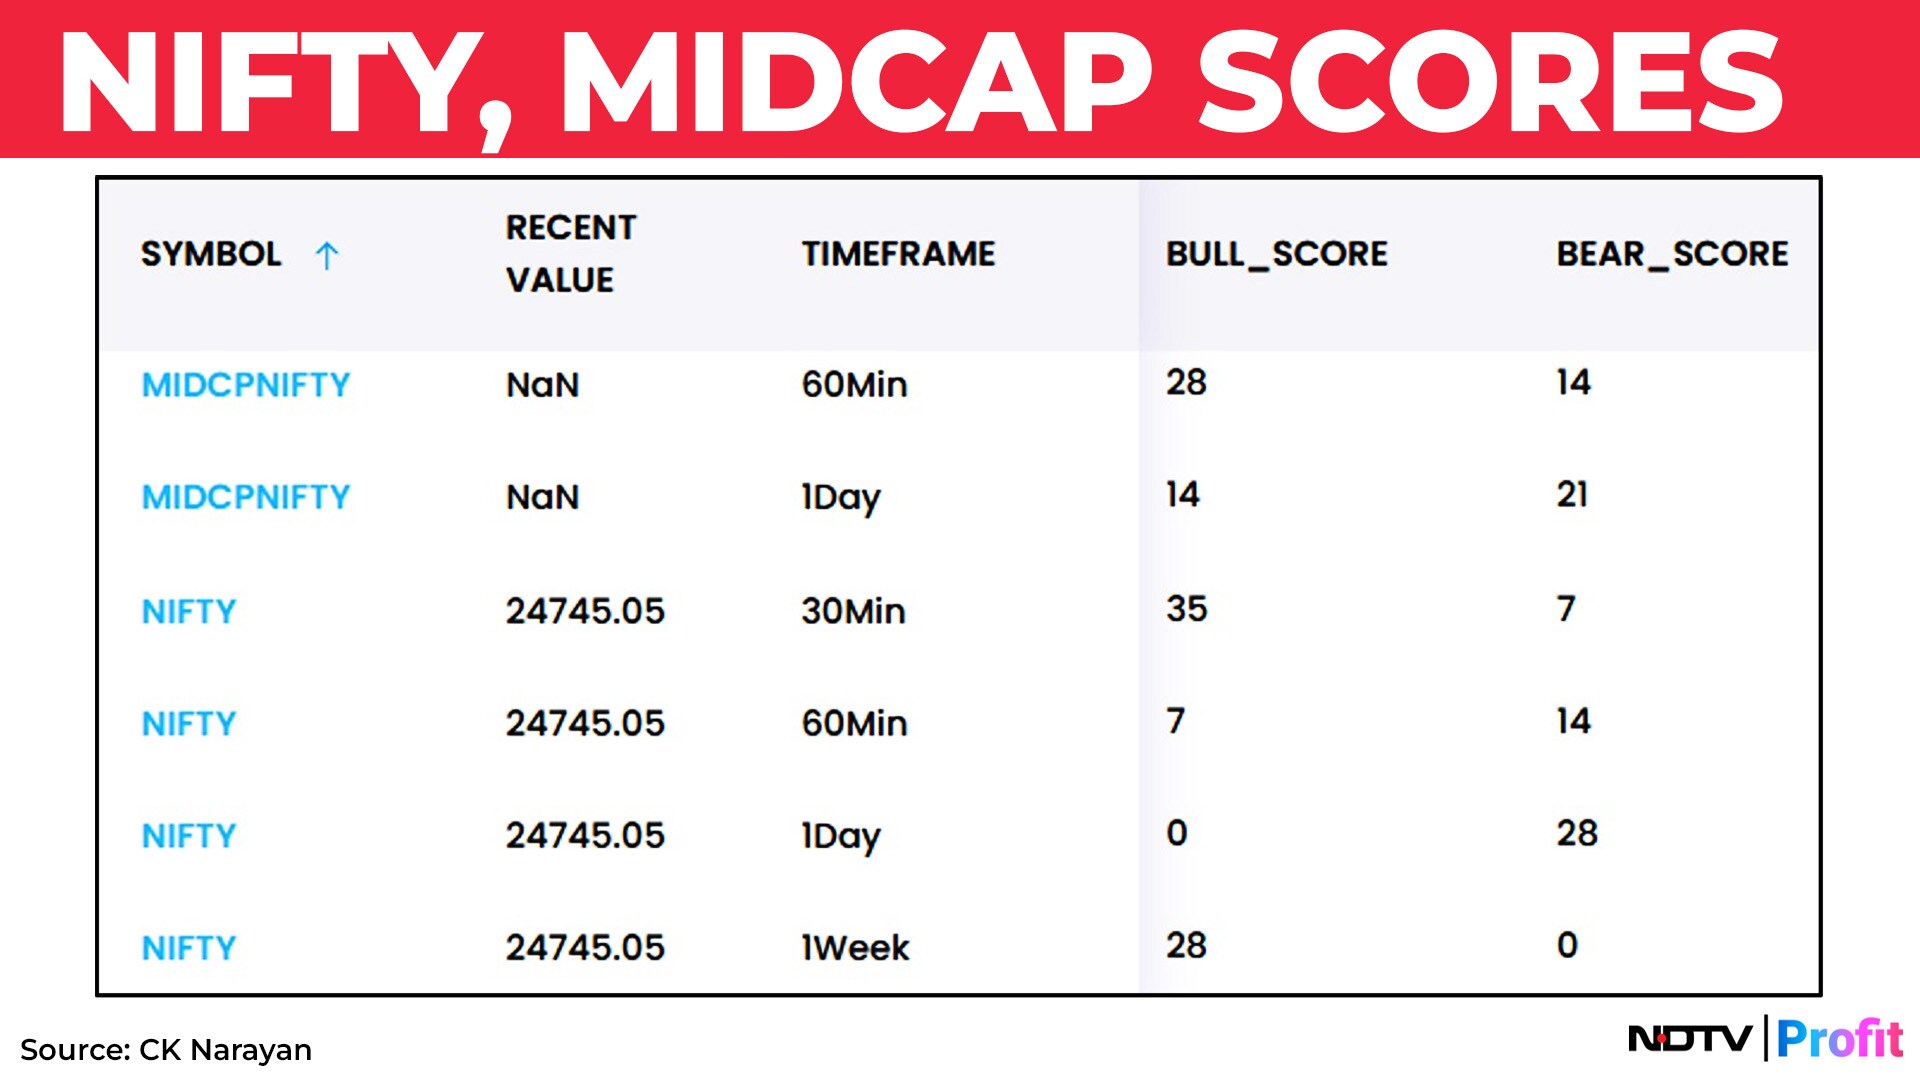
The erosion in the daily plot of Ichimoku is particularly notable and possibly explains the pain we are experiencing owing to the loss of trendiness in the short term.
The only solace is that there is no concomitant rise of bearish scores in any time frame, so we can take it that only the bullishness has retreated, without the onset of bearishness. Hence, the bulls are down but not out yet! The Bank Nifty scores are quite similar to that of the Nifty as is the FinNifty.
So, where we do go from here? Very tough to say. Everything is all over the place and market is getting whipsawed by news. Clearly, overnight positions for traders remains a risky affair, prompting us to be (largely) day traders.
At the same time, it is not as though in certain stocks trended price action is not happening. Finding of such stocks is facilitated by the Active Stock section in Neotrader. See below the set up for the coming week.
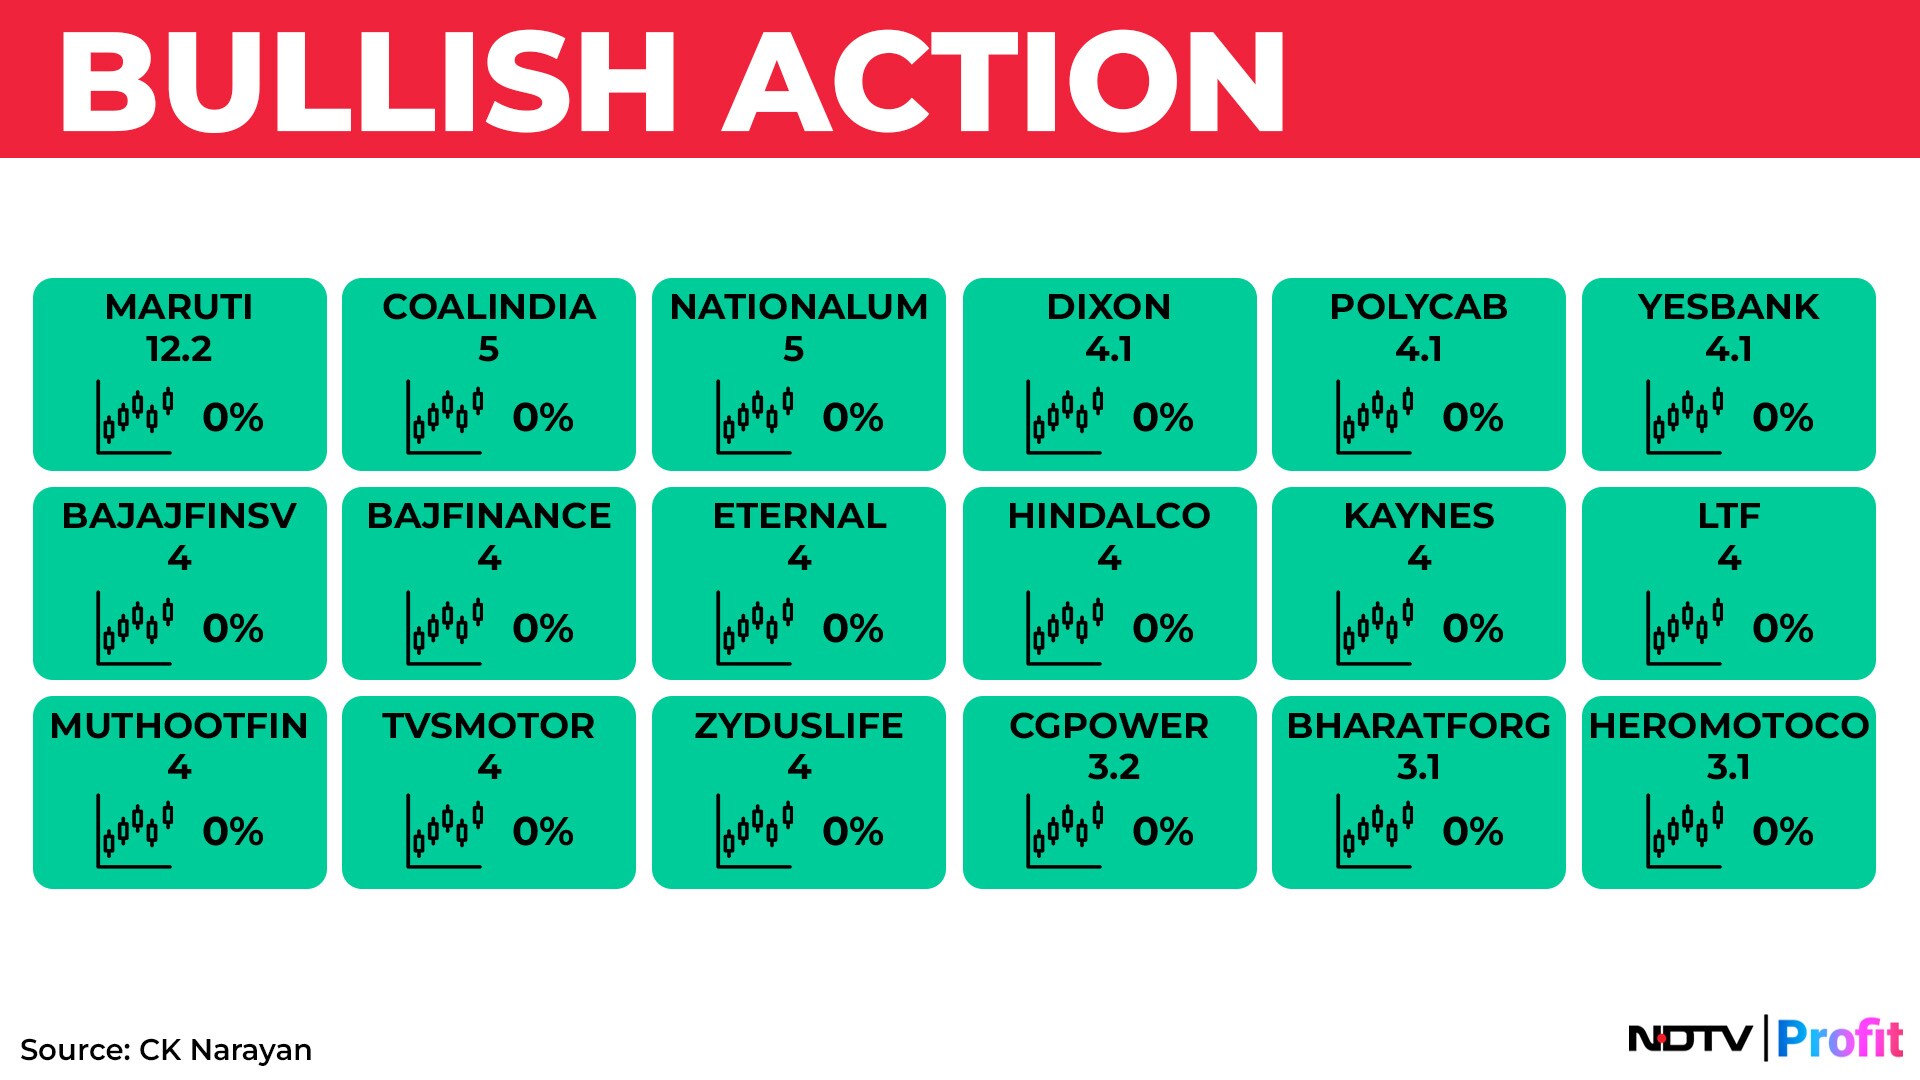
This is just a few names (bullish) and if one looks up the charts of these names, one would find them to be in the midst of some nice upmoves that seems to be spilling over successive days.
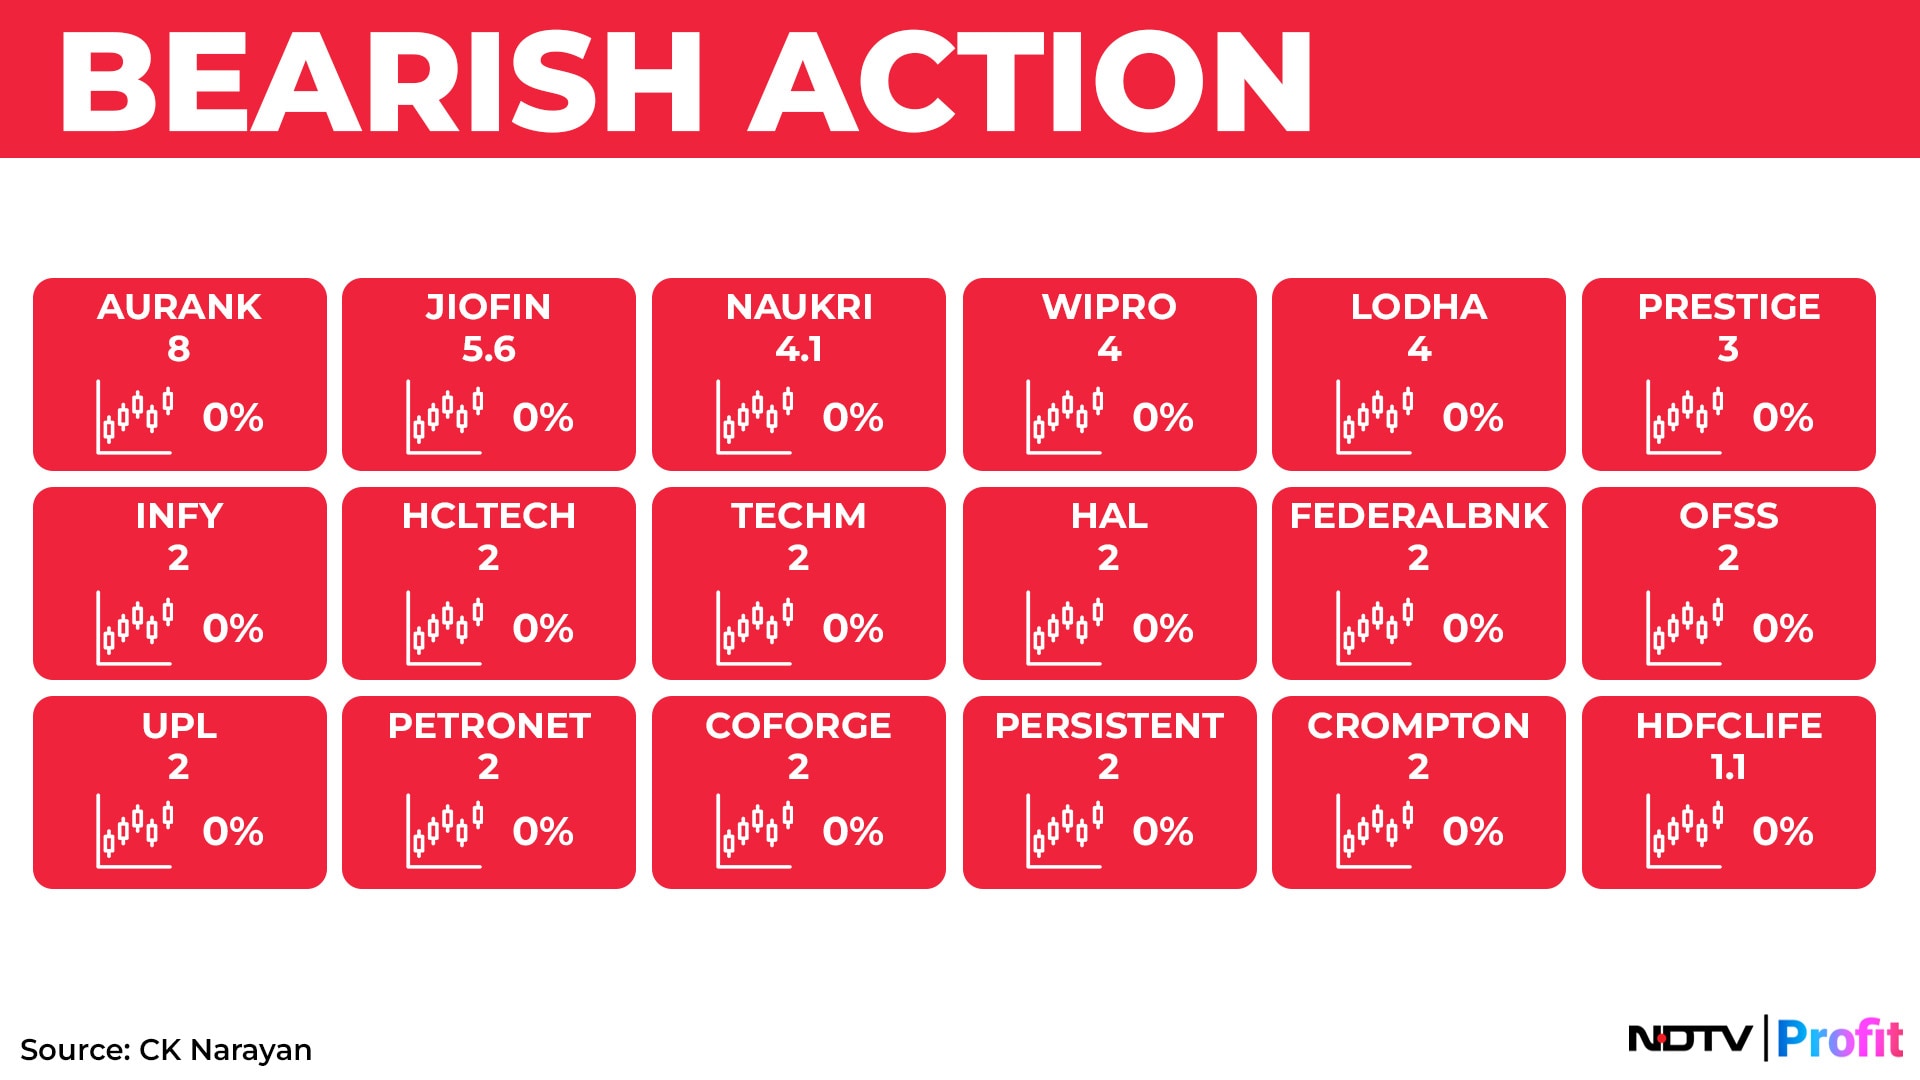
Similar would be the situation if one wished to track bearish tracks. Charts of the names mentioned here would witness some consistency in downmoves!
Thus, Neotrader is a software that indicates not just the trends and their strength of the indices but also picks out stocks that are in different phases of their trends, rates them by their trend strength, creates an aging list of the length the trend and much more.
In these days of uncertain trends, an objective trading companion like Neotrader is indispensable! Check it out if you have not done so. Those that may have done so earlier, can take a relook as we have added such powerful new sections into it.
Therefore, with trends remaining unclear, one may need to trade both the sides of the market and the reliable candidates for that can be found by some careful selection. While the recent GST 2.0 rollout can certainly be something close to revolutionary, there is no use if only we think so and the market doesn't!
For sure, efforts like these (and others too) will ensure that the trends will not collapse, the market wants, perhaps, some evidence that the corporate sector is also stepping up to the plate to support the govt's efforts to create a better environment for investing and trading.
Until then, it is still sell-rallies in the very short term even as it remains a buy-dips over the mid-term.
CK Narayan is an expert in technical analysis, the founder of Growth Avenues, Chartadvise, and NeoTrader (https://neotrader.in), and the chief investment officer of Plus Delta Portfolios.
Disclaimer: The views and opinions expressed by experts and investment advisers on NDTV Profit are of their own and not of NDTV Profit. NDTV Profit advises users to consult with their own financial or investment adviser before taking any investment decision.
Essential Business Intelligence, Continuous LIVE TV, Sharp Market Insights, Practical Personal Finance Advice and Latest Stories — On NDTV Profit.