


Leaving aside the powerful start of Monday, the week's trading was totally range bound. On Thursday the dip filled the gap of Monday but managed to pullback a wee-bit. Therefore, aside from the election result gap and its filling, we had no other price associated event. But the beauty of technical analysis is that even in quiet times, price action leaves other foot prints. And, that is what we are going to study this week.
Chart 1 shows the picture up to last week and the important points marked on it.
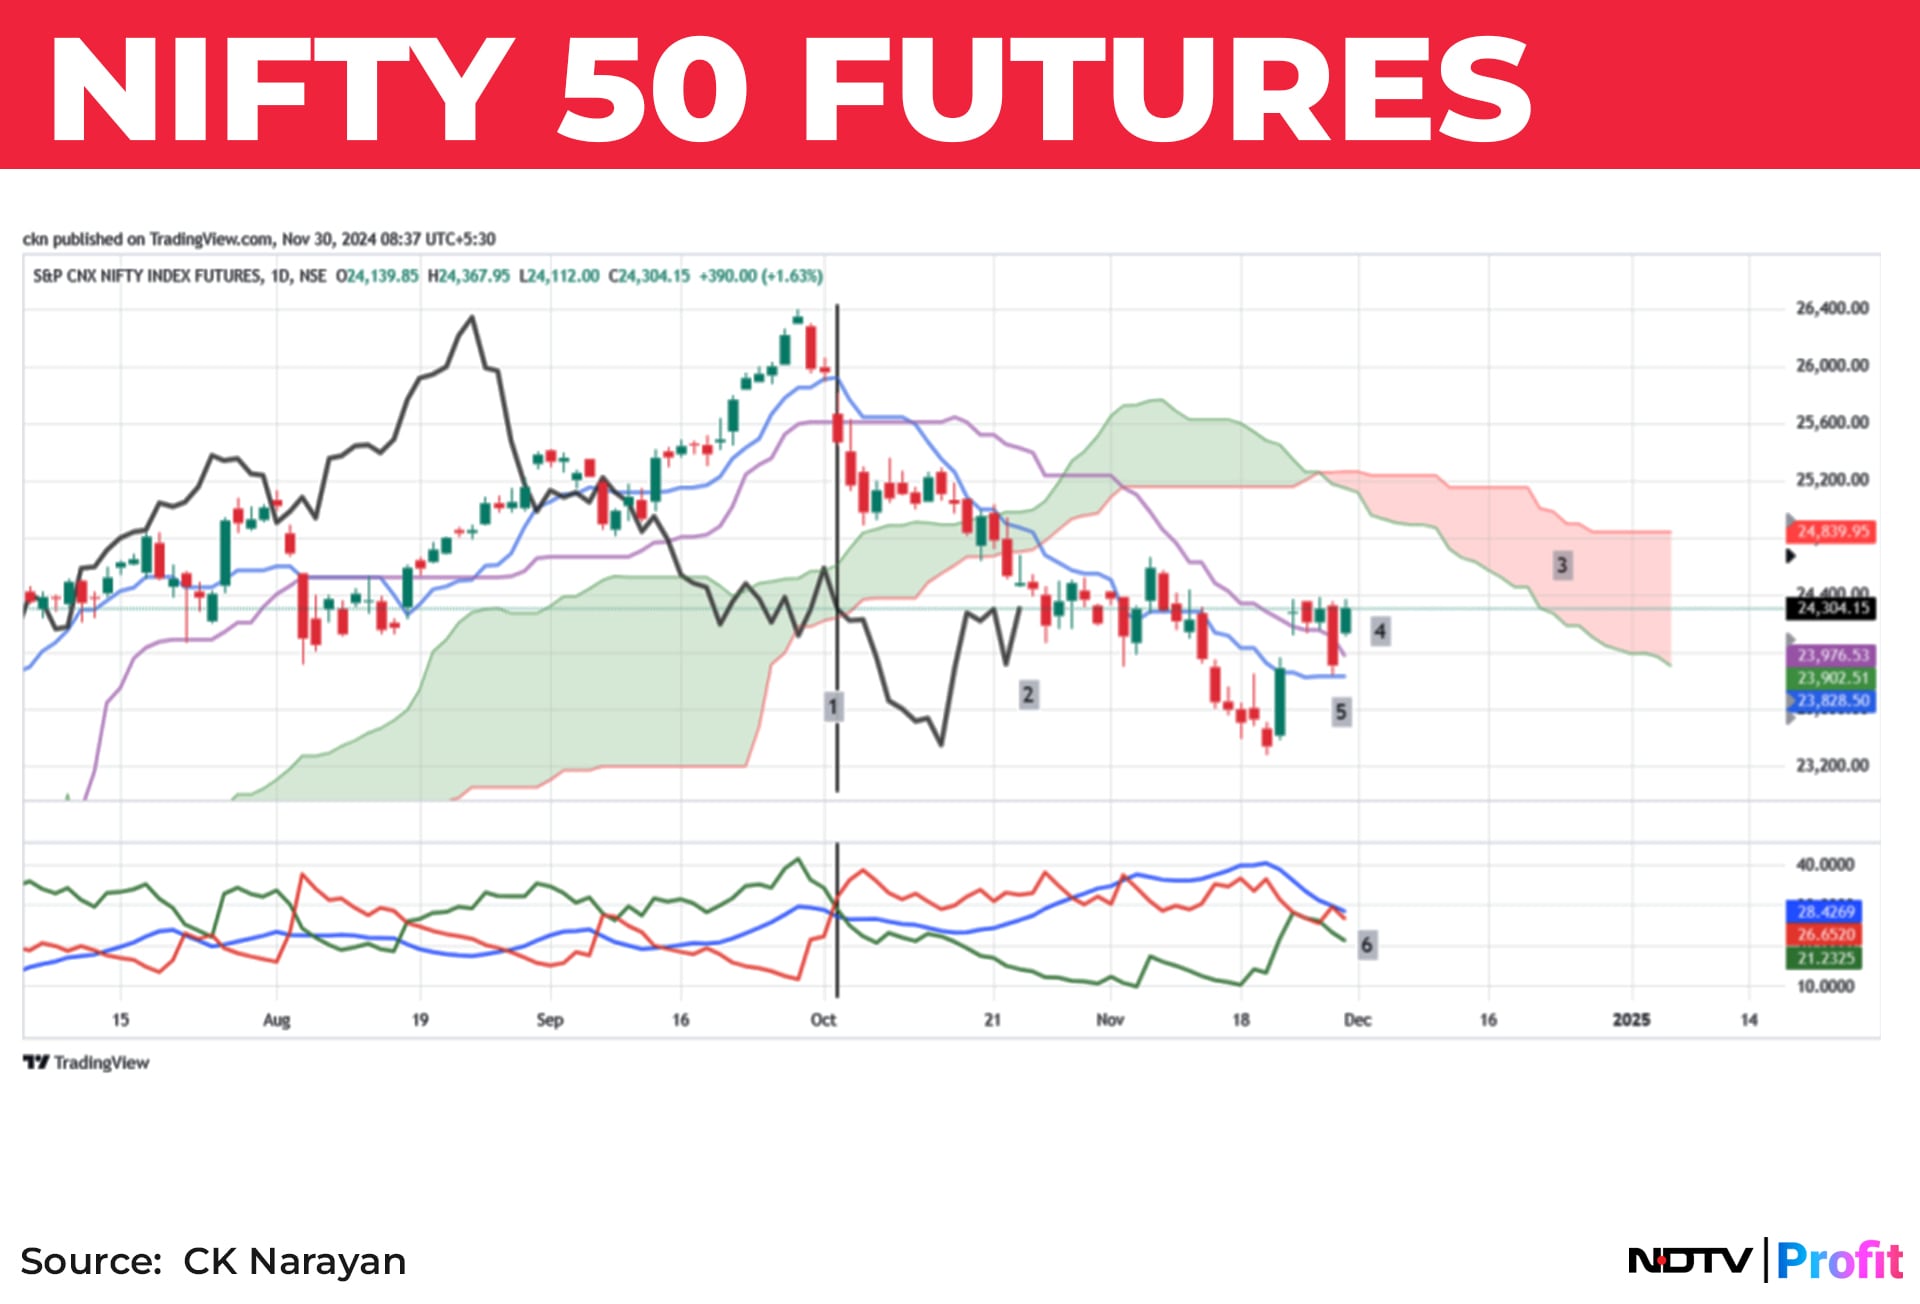
#1 is the point (3rd Oct) from where the trend started declining. You can notice the negative crossover of the DI lines from that date, confirming the shift in the trend. Let's jump straight to #6 where we can see that the fledgling rally of the last week could not produce the required amount of upside thrust to create a positive crossover of the DI lines again. In fact, the DI lines had a ‘kiss' and parted again, which, many times, is a reconfirmation of the earlier trend. So, that is certainly not an encouraging sign for bulls. The ADX line is on the decline and hence the trend strength is absent as yet and it is only price action in the week(s) ahead that can set the pathway once again.
Let's now jump to #4 which points to the price action of the last week. It is pretty ranged with a well defined high around 24350 area. So, that clearly sets up the breakout level for the coming week. Given the multiweek decline many people are ready for the resumption of the uptrend but is price action and associated indicators in support of that expectation? Afraid not, yet. See #2- it is the CS line of the Ichimoku that is still clearly below the prices and below the cloud. So, much to do by prices before bulls can breathe easy once again.
Pt #3 is the overhead Cloud which will provide resistance. Note that the cloud is thick and is also bearish so it will take a lot of effort by the prices to achieve its crossing. The TS and KS line (at #5) are not holding out for bulls- they are negatively poised as yet.
So, the net of the above evidences are that the Nifty fut MUST force its way higher in the coming week or two if the bulls have to succeed with the rally attempt. That is, if we want to see the upside emerge from here.
The alternative is that the thrust doesn't appear and markets get into a drift, maintaining a range of 23800-24500 across the coming weeks. This will lead to the overhead resistances dropping closer to the prices and making it easier later for their penetration with a smaller thrust.
One of the persisting problems is the selling by the FIIs. This is not just in cash equity but in the futures space as well. See chart 2 for a view of the positioning of the FIIs are in the Index futures space. The Cyan lines are for Long Index futures while the Gray lines denote Short Index futures.
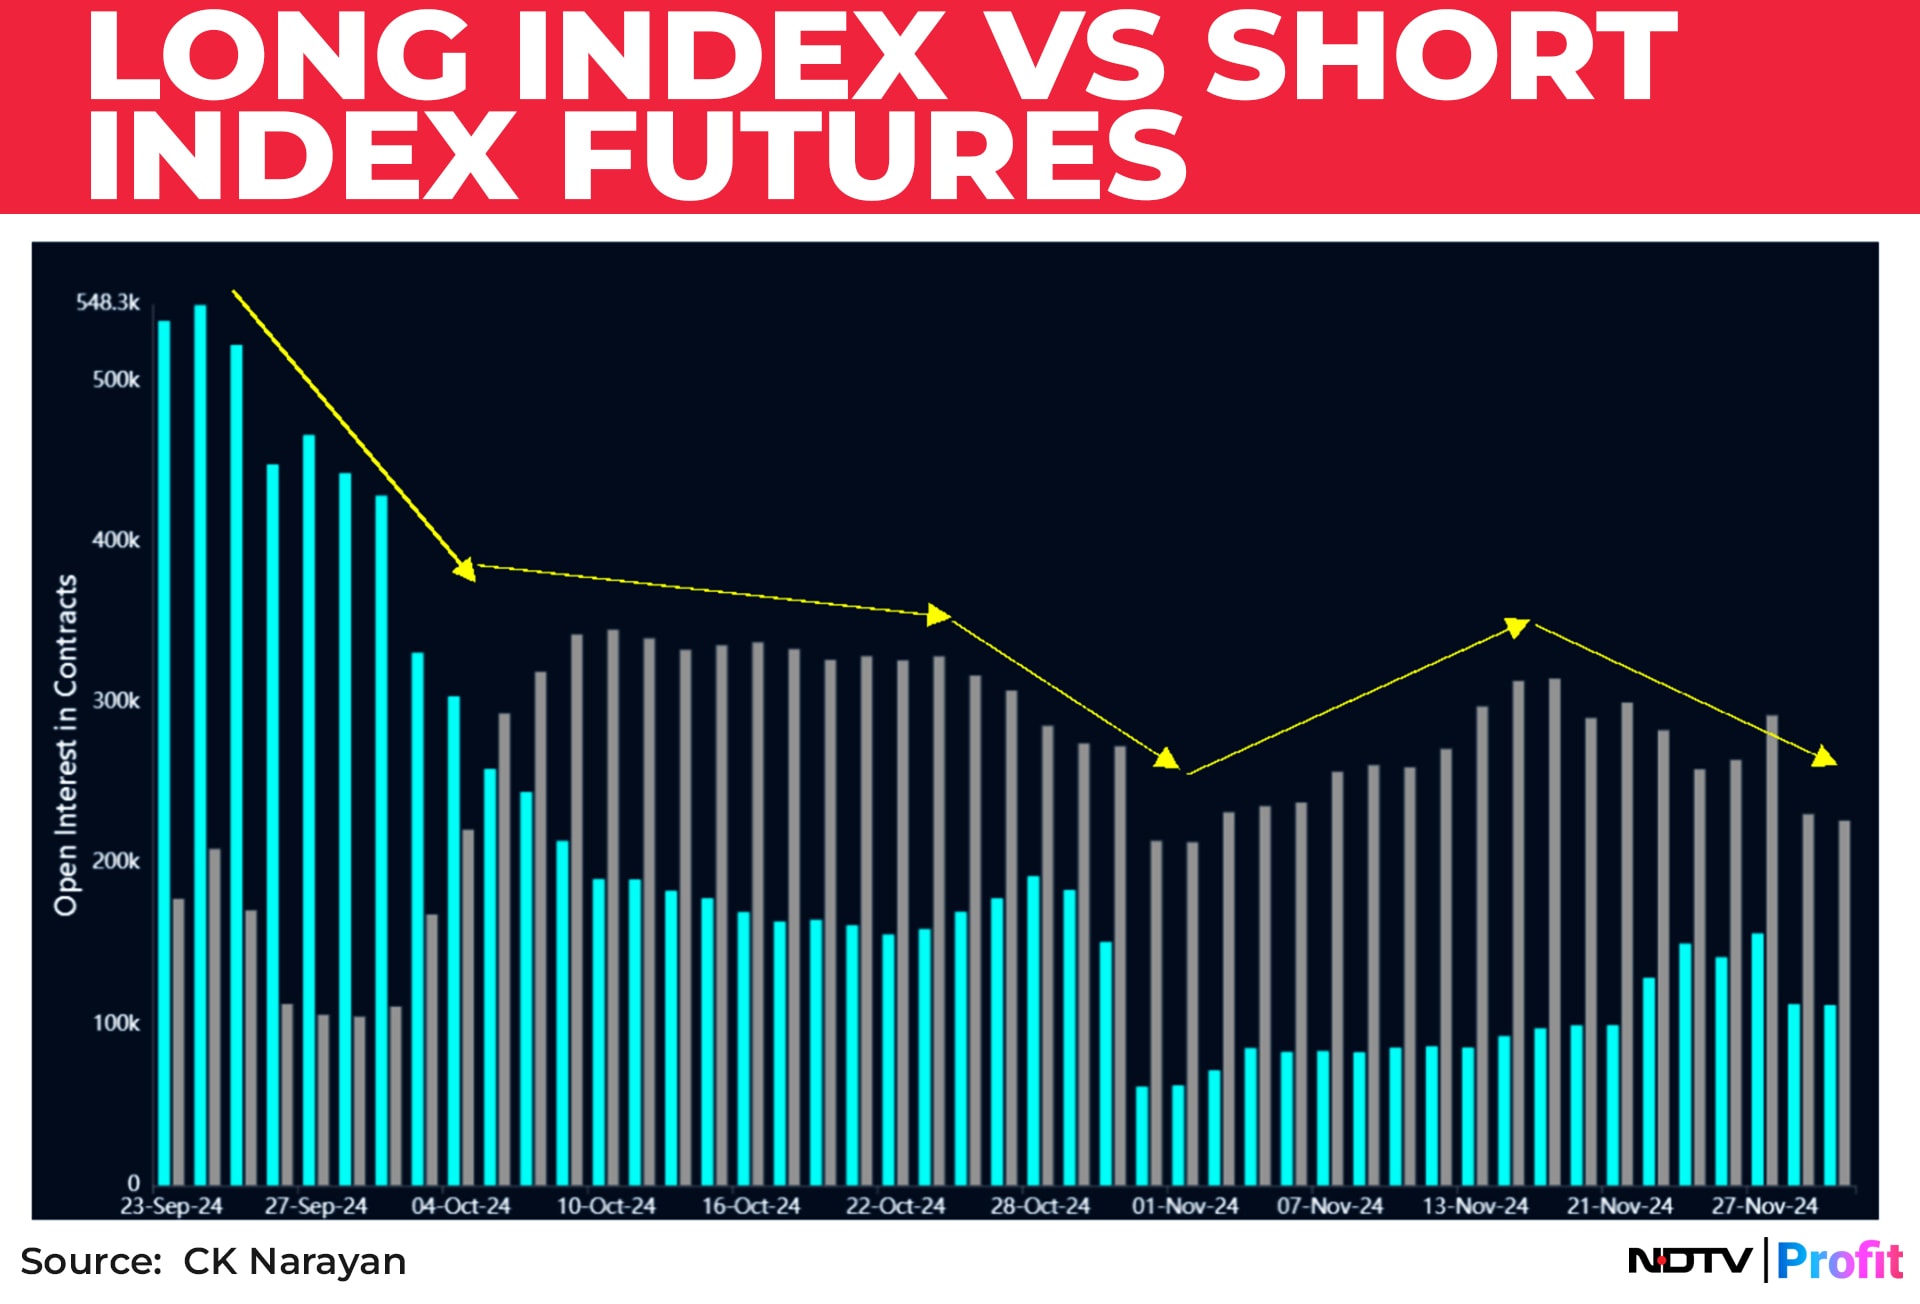
It can be noted from the chart by end of Sep 24, the FIIs began rapidly unwinding their long future positions. By Oct 4th, their long index positions have crossed under their short index positions. This was in perfect coincidence along with the price action shown in Chart 1. After that date, the grey lines have been continuously in force right into Friday. It had briefly dipped as Oct expiry was reached but has picked up again in Nov, implying that shorts were rolled into Nov. Now, once again, we are seeing the shorts drop as Nov expiry was reached. It will be interesting to watch how this chart progresses as Dec expiry rolls ahead. Notice too, the very limited increase in the cyan bars implying that the FIIs are still net short in the market. In Dec, if the rally has to unfold further, we will have to see Cyan line go up and concomitantly, grey lines to come down.
So, along with Cash data selling, the FIIs are positioned negative on Indices too. Until we see some changes in this situation, the rally will continue to be a struggle. Even in the Options space, they are more on the short side than long. The other smart set in the market- the PRO traders- too are net short in this market for index futures.
Coming into derivative action over the week, then we find that the Nifty futures saw long addition to OI but not on a consistent basis thru the week. But the main point that was notable from the data was that bulls that had stepped in from Monday have not yet let go of their positions yet. So, again, we MUST see that situation sustain in the coming week i.e. we should be seeing long build ups or short covering signals across the coming week. This will give a boost to price action. The PCR levels also came up by end of the week and that is suggesting that a rally attempt is being made.
So, several things to watch as we move ahead in the next week. One, cross and hold above 24350; two, FII index future positions should continue to see short positions unwind and/or long future position build afresh; PCR to keep Improving, OI build of Nifty fut to continue with either long build ups and/or short covering to continue. The more of these signals we see, surer we can be that rally shall continue. But if signals become mixed, then look for some small range volatile trade to emerge across the week.
We can pause here to take a look at the other region of the market- the mid and small cap space. Chart 3 is Nifty MidSmall400 index.
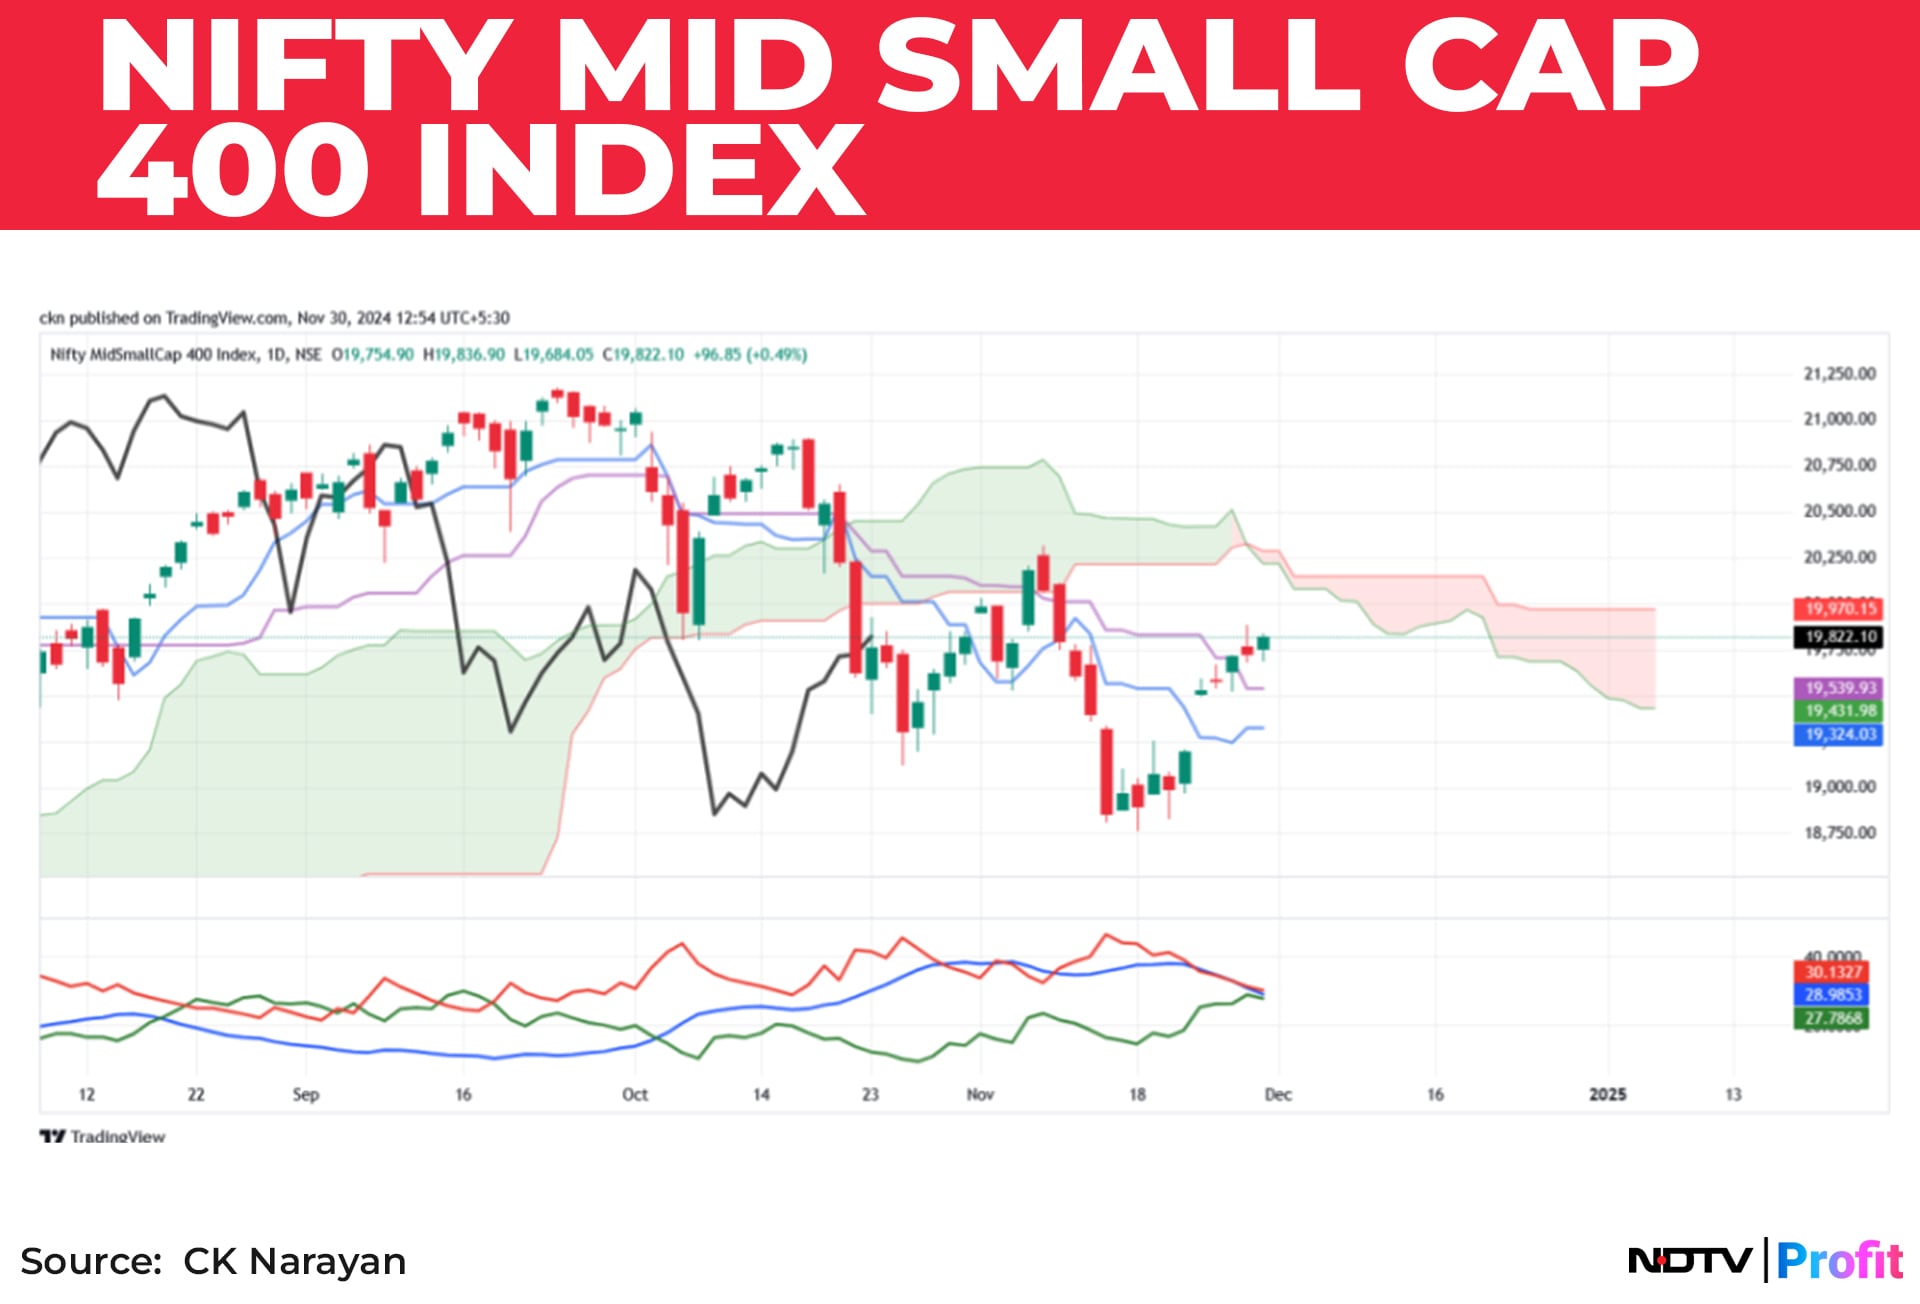
Although wearing a similar look as the Nifty chart, we note that over the last week, this index plotted rising days all through. This would suggest that the retail trade was perhaps active in the market buying into stocks, sensing value after a steep decline in many names. The indicator situations remain the same though and hence, here too we will want to see action continue into the next week for relief to get restored. The point to remember is that retail money is a more impatient one but it can drive the trends only in concert with the Institution money. Therefore, not to get swayed by the recovery of some of the names in the mid and Smallcap area.
After those dismal set ups, here may be something that holds out some hope. Chart 4 is Bank Nifty daily with annotations.
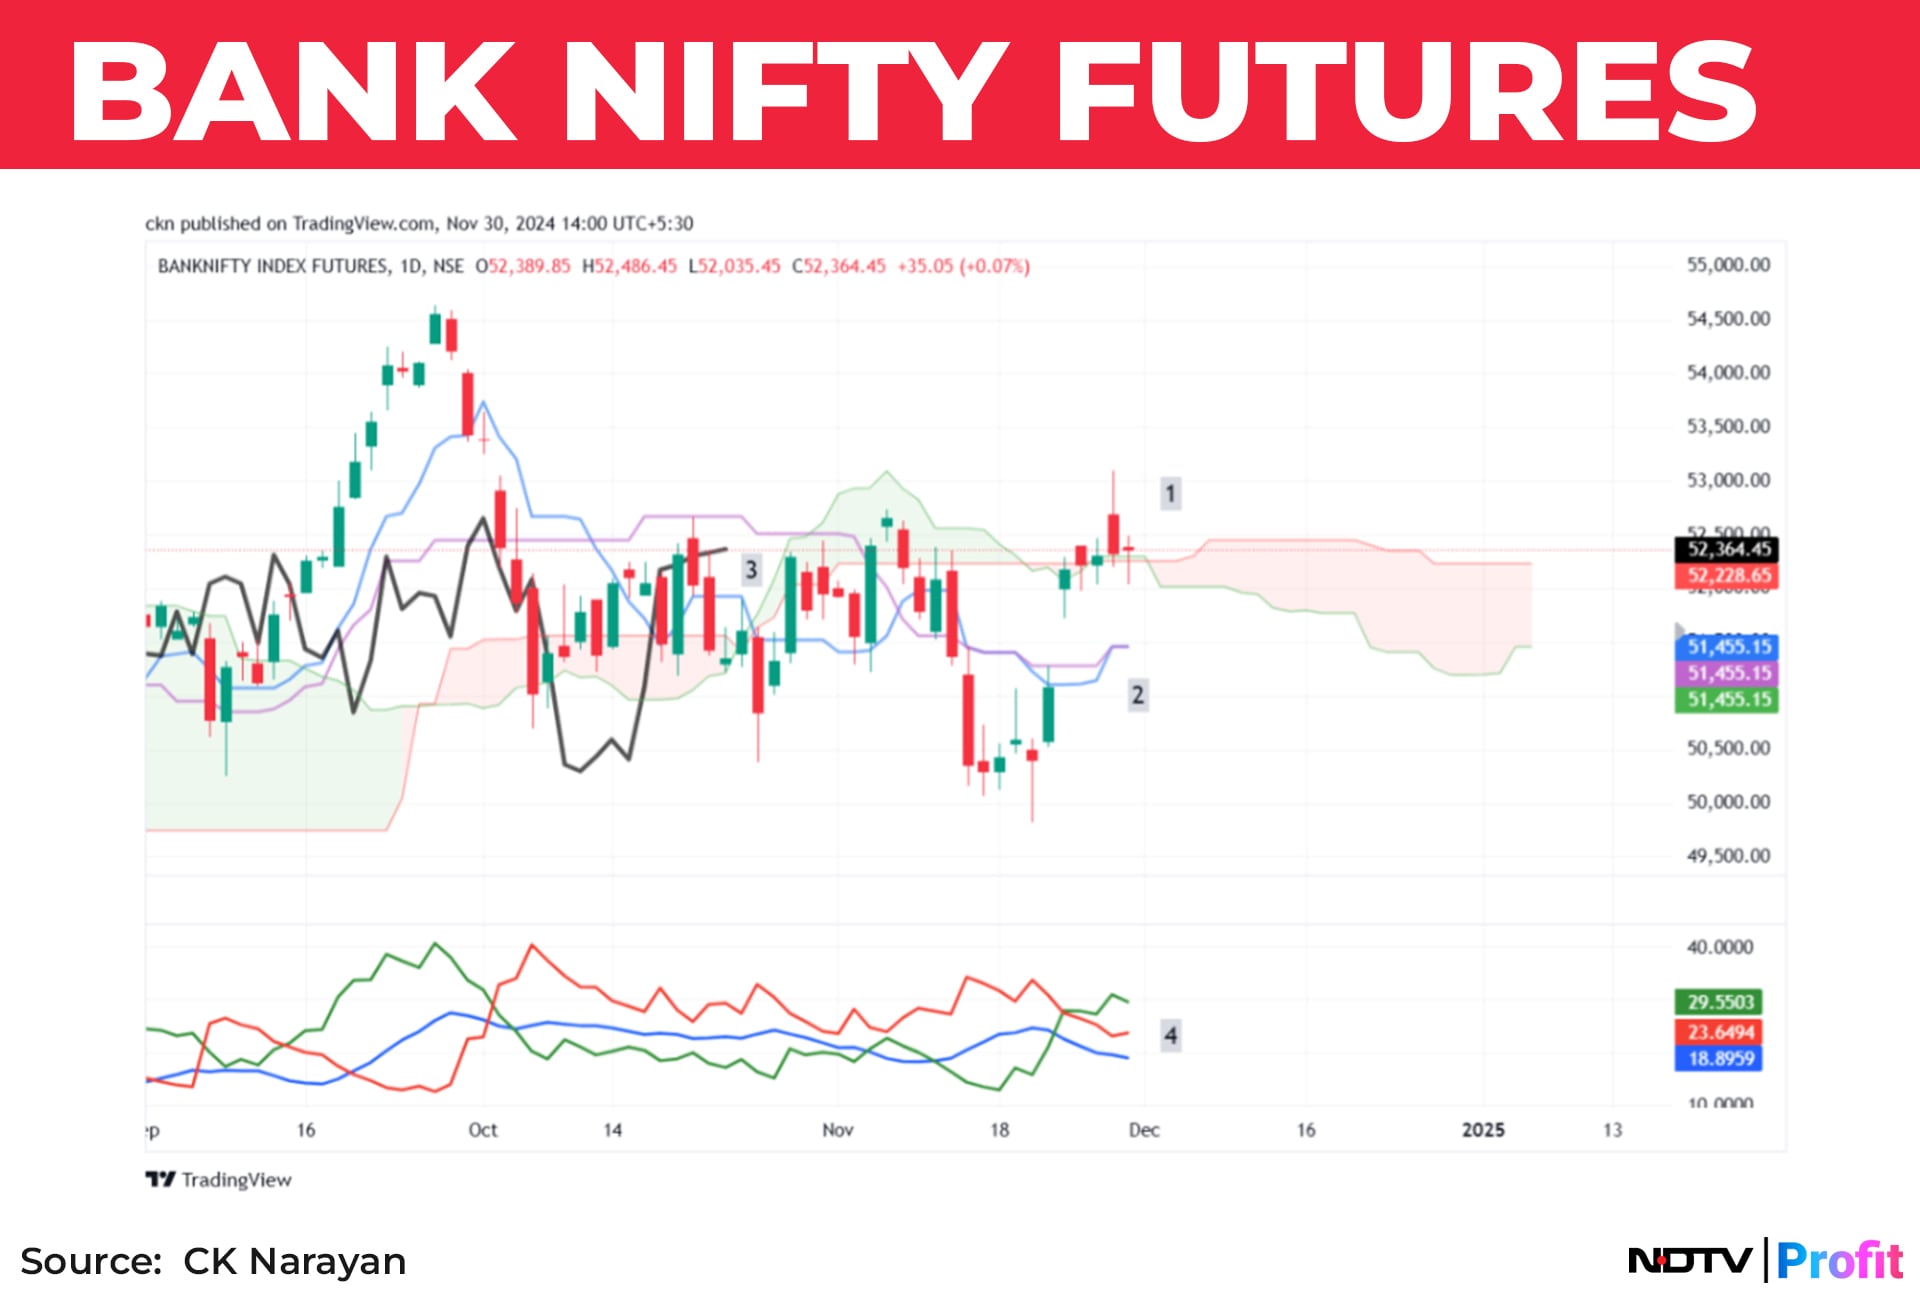
In contrast to the Nifty, the prices have managed to cross the cloud and closed above it in the last week (#1). The TS-KS lines are about to cross positive, though still below the cloud. Partially positive at #2. The CS line is just a short distance from breaking out from under the cloud, already having cross above the prices (#3 to the left) and finally, at #4, we can note that the DI lines have crossed positive, suggesting momentum in play possible.
Thus, the Bank Nifty, if it were to continue higher, could possibly drag the Nifty up with it too. So that is the next item to watch. Positive moves in Hdfc Bank made that possible but it is also important that we see Hdfc Bk continue to perform during this week, and alongside of that, other private bank stocks too.
Derivative data shows short covering in Bank Nifty and decent rollovers. Since long build up is visible in futures after 21st Nov, it can be presumed that a decent chunk of longs have been rolled over too.
So, we have a tricky week ahead for us. A decent rally has emerged from the lower levels of support that we tracked almost precisely (about a 1000-points from 23300 area). Since we were ready for the reversal, we could take advantage of it. Now, we have some uncertainties for the week ahead and we have therefore placed many demands on the index to perform. Let's see how it comes through. We have some small hope held out from the Bank Nifty as well. Therefore, it is a look before you leap type of week ahead.
For those who would want to keep up with intra week analysis, they could visit my website https://cknarayan.com/insights for updates. And for some stock views as well. It is free. So, give it a whirl.
Essential Business Intelligence, Continuous LIVE TV, Sharp Market Insights, Practical Personal Finance Advice and Latest Stories — On NDTV Profit.


