What Hindustan Zinc's Long-Term Charts Say About Market Timing
Can price action run ahead of fundamentals for years? Hindustan Zinc’s long-term chart offers one answer.

Recently, I read an article online that stated Hindustan Zinc was a poor candidate for timing the market. The main reason given was that a large portion of its silver production is hedged at lower levels. As a result, the company may not benefit fully from a surge in silver prices. That argument is fair. But the market does not appear to hinge on that alone.
This is where technicals diverge from fundamentals.
I have tracked Hindustan Zinc since the 1990s. Over that period, the chart exhibited one of the longest accumulation patterns, in the form of scalloped bottoms. That long-term chart is difficult to access in current software. However, anyone who examines it closely can see how accumulation can persist for extended periods and why rounding bottom patterns should not be mistaken for immediate breakouts.
This pattern formed because the Anil Agarwal group accumulated the stock for several years before concluding a deal with the Government of India. Hindustan Zinc was partially privatised in 2002, when the government sold a controlling stake and management control to Sterlite Opportunities and Ventures Ltd, a Vedanta Group company. Prior to this, accumulation continued for nearly a decade and was clearly visible on the charts.
A close reader of charts could have identified this pattern and invested with reasonable confidence that higher prices lay ahead. The duration, which extended beyond a decade, remained unknowable. However, the consistency of the pattern would not have prompted an early exit. Only fatigue might have done so.
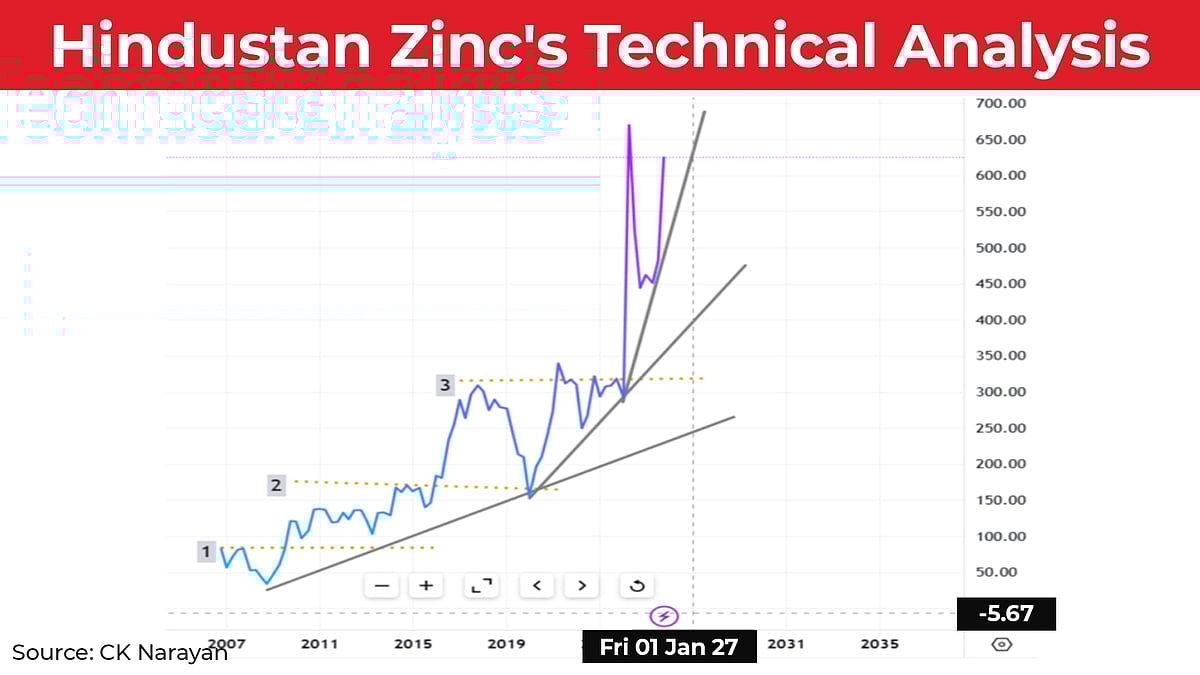
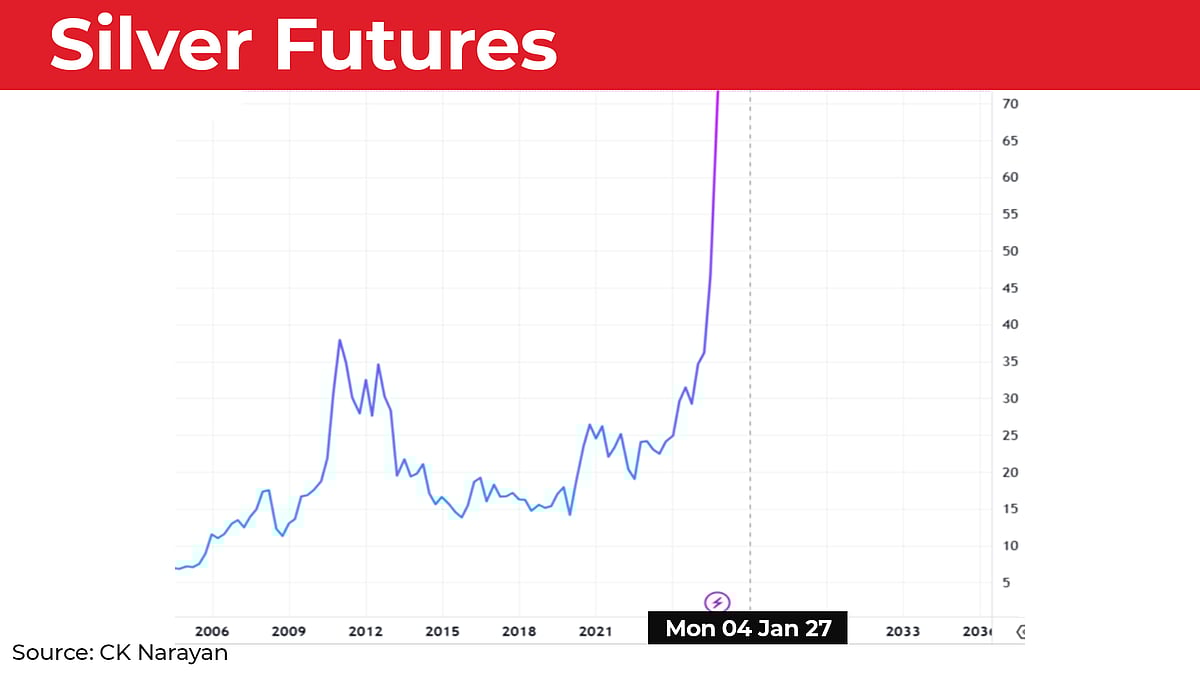
The chart presented here begins in 2007, as this is what is available on TradingView. By then, the breakout from long-term consolidation had already occurred. The chart also includes a comparison with silver prices over the same period.
A comparison of the two charts shows that the global surge in precious metals produced a strong high in silver in 2011. Hindustan Zinc also broke out to a new high at that time, marked as point one. After that, however, the stock diverged from the metal’s trend. It entered a phase of lateral consolidation, broke out again in 2014, consolidated once more, and then broke out in 2016. It reached a strong high by 2017.
From a chart perspective, the stock formed a clear stair-step pattern. Prior price pivots acted as support during each decline. This reflected classic bullish price behaviour. The trend also differed sharply from silver, which remained in a prolonged correction from 2011 to 2020.
The stock chart shows three consolidation breakout trendlines, marked one, two and three. The sharp fall in 2020 found support at the previous swing high. That preserved the sequence of higher tops and higher bottoms.
Silver reversed direction and moved into an uptrend. It broke above its 2011 high by October 2024. Hindustan Zinc moved earlier. It surpassed its 2017 high and the double high of 2021 by January 2024.
Throughout this period, Hindustan Zinc’s trend remained ahead of silver.
After reaching a high in May 2024, the stock fell sharply and lost about 50%. This likely reflected the company’s decision to hedge silver production to manage price volatility. Silver had not crossed its 1980 high of $50, even as gold tripled. Market scepticism was therefore justified.
In November 2024, the government sold another tranche of its stake. Price consolidation may have reflected expectations of additional supply. Although the Cabinet cleared the sale of the government’s entire holding, only 1.6% was sold from its roughly 29.5% stake.
The trend in Hindustan Zinc stabilised once the government clarified that it did not plan to sell further stake. The stock then resumed tracking silver, which had begun a more sustained rise.
Silver finally broke the $50 level by October 2025. It subsequently reached a new all-time high of $72. Hindustan Zinc did not match silver’s pace. From the August swing low, the stock rose about 50%, compared with a 93% rise in silver over the same period.
The focus here is not correlation, but clarity in price action. Pullbacks driven by anticipated supply are normal. When prices retreat to prior swing highs and stabilise, they provide a signal. When the initial decline is steep, subsequent declines tend to moderate.
After the March 2025 low, the stock recorded a modest bounce followed by a shallow dip, forming a higher bottom. This created a clean A-B-C corrective structure. The rally from the August 2025 low unfolded as an impulsive move under Elliott Wave analysis. That structure set the stage for the next advance.
At this point, correlations with silver reasserted themselves. Hindustan Zinc now appears to be in the third wave of a new uptrend.
The monthly chart includes three rising trendlines. The current trendline is the steepest. Typically, price trends persist for three or four such repetitions. Hindustan Zinc may therefore be approaching the end of a wave three advance and could enter a corrective phase. Silver also appears close to projected targets in the $78–81 range and may see a pause.
Investors who have benefited from the recent rise in Hindustan Zinc may consider partial profit booking and wait for the next correction. A subsequent move to a new high remains possible, potentially above the previous peak near 800. Silver may also consolidate after its rapid rise and offer renewed buying opportunities at lower levels.
The lesson is clear. Market timing remains possible when price action provides sufficient clarity.
Disclaimer: The views expressed in this article are solely those of the author and do not necessarily reflect the opinion of NDTV Profit or its affiliates. Readers are advised to conduct their own research or consult a qualified professional before making any investment or business decisions. NDTV Profit does not guarantee the accuracy, completeness, or reliability of the information presented in this article.