It was mostly about tariffs in the last week. Trump continued to waffle, from 25% to 500% on various items. It didn't matter whether you were an ally or not, he is on this trip and no one seems to be able to deflect him from this path. But he seems to have the support back home as his Big Beautiful Bill cleared both houses. India, in the meanwhile, seems to be acting tough, with Modi leaving it to minister Piyush Goyal to answer. Maybe like Brazil's Lula, India is also ready to declare that tariffs wont matter? I don't know but the body language seems that way. Perhaps the reason for the delay in finalising with India so far? In any case, this can is being kicked further down the road, to August 1, so now people are wondering whether all these were only negotiating factors. The fact that pharma stocks in India didn't react to the pronouncement that there may be a 200% tariff levy on India on pharma also speaks of some complacence of the industry.
Will this sense of complacence spread to other industries and to countries? Jamie Dimon certainly seems to think so and he held that out as a warning. He was speaking more specifically about the US markets of course, as they surged to new highs. But it would impact the rest of the world too. Will we all, one morning, wake up to some rude shocks?
The charts don't seem to suggest that. They read the minds of people and their action and right now, their action says they want to buy stocks rather than sell them. Sure, we had dips for two weeks now. But look at the price damage- it is still so minimal! We are not even below the upward thrusting candle of two weeks ago. See chart 1. Further, the upward trend resumption signalled by a simple Kalman filter applied to the prices kicked in from mid-April and is still very much intact. When you are analysing the index for trends, it is better to be looking at trend filters rather than trade filters. Such filters always track the trend from a little distance away, allowing the market to breathe.
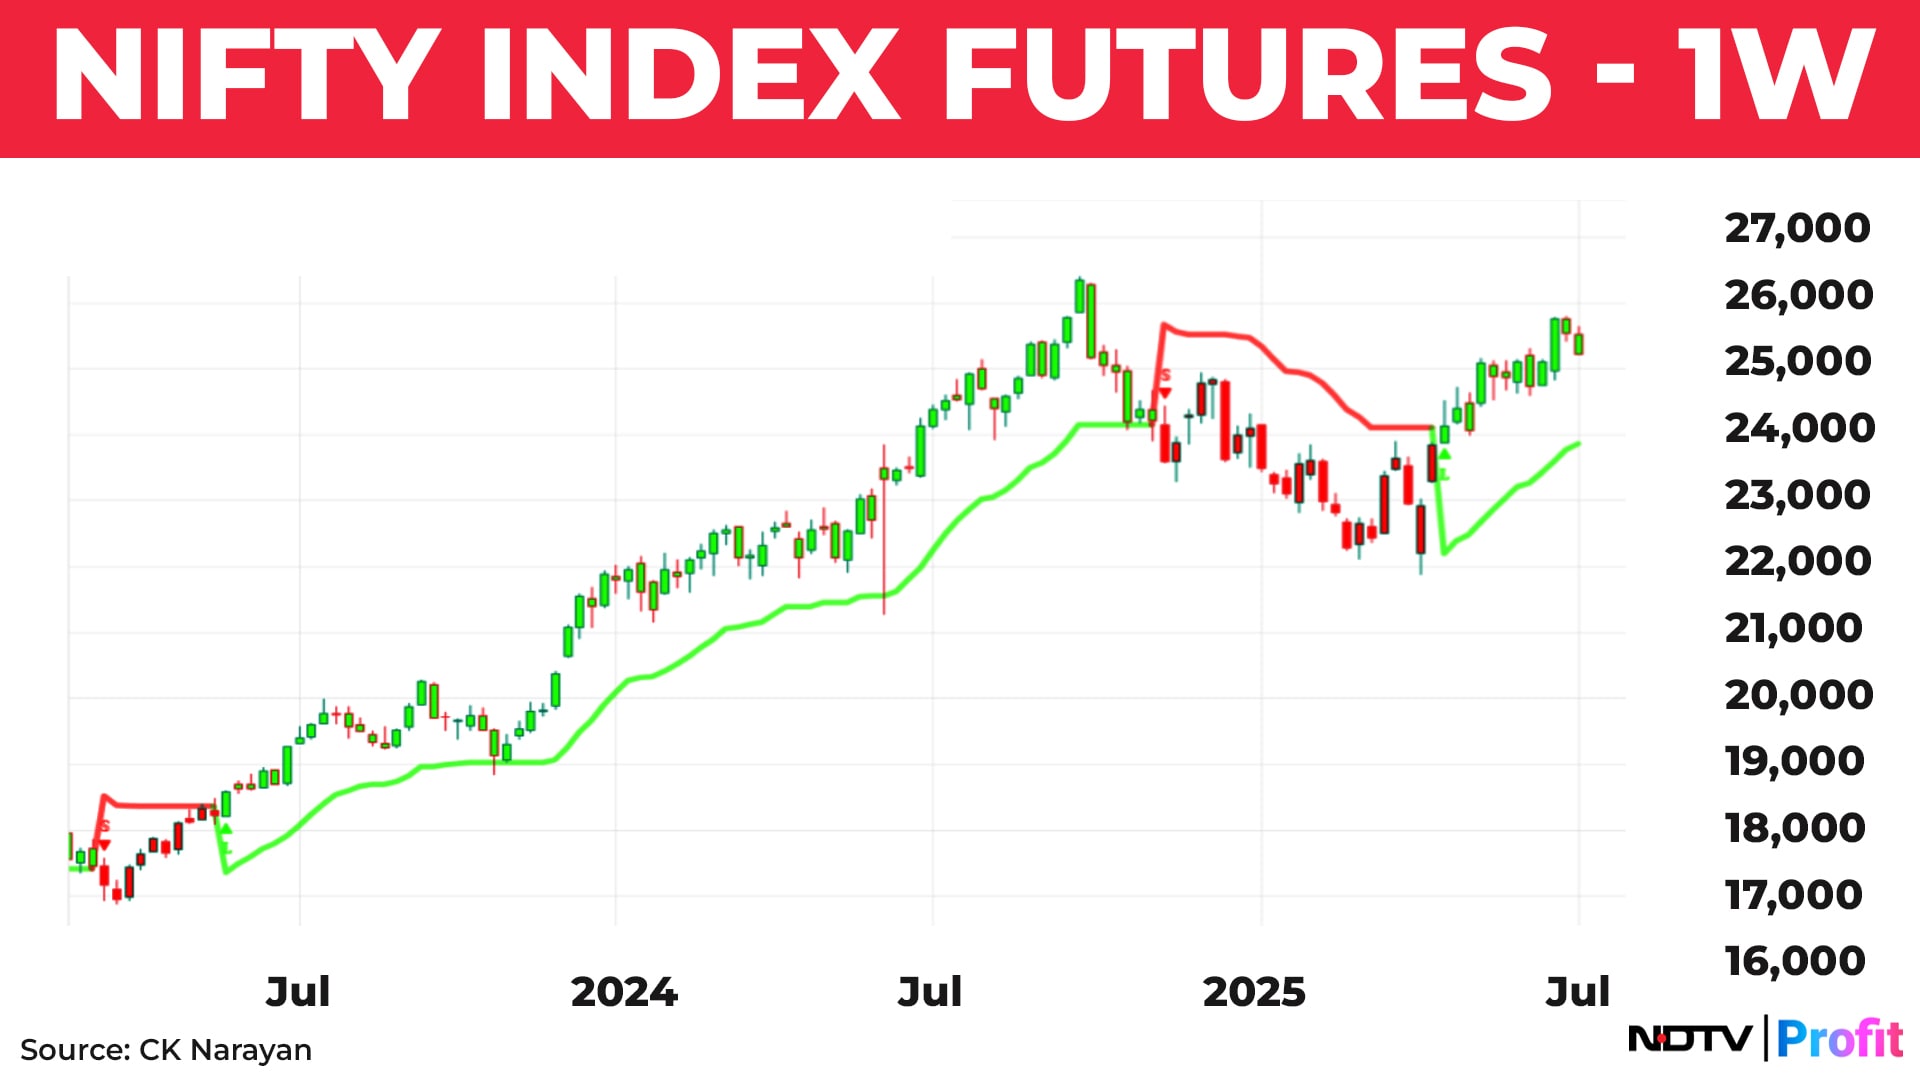
Will there be some pullbacks within such trend filters? Of course there would be. If you look back, then even the devastating post-election drop could not dent the trend filter and the market carried on as though nothing had happened.
So, pressing panic buttons just because the Nifty broke some minor support levels would be foolish to those who follow the bigger trends. Yes, they may be relevant to within-the-week players and that ought to be addressed as well. But it will be good to remember that all moves over the short term are subservient to the moves in the longer term. Hence, the coverage on that first.
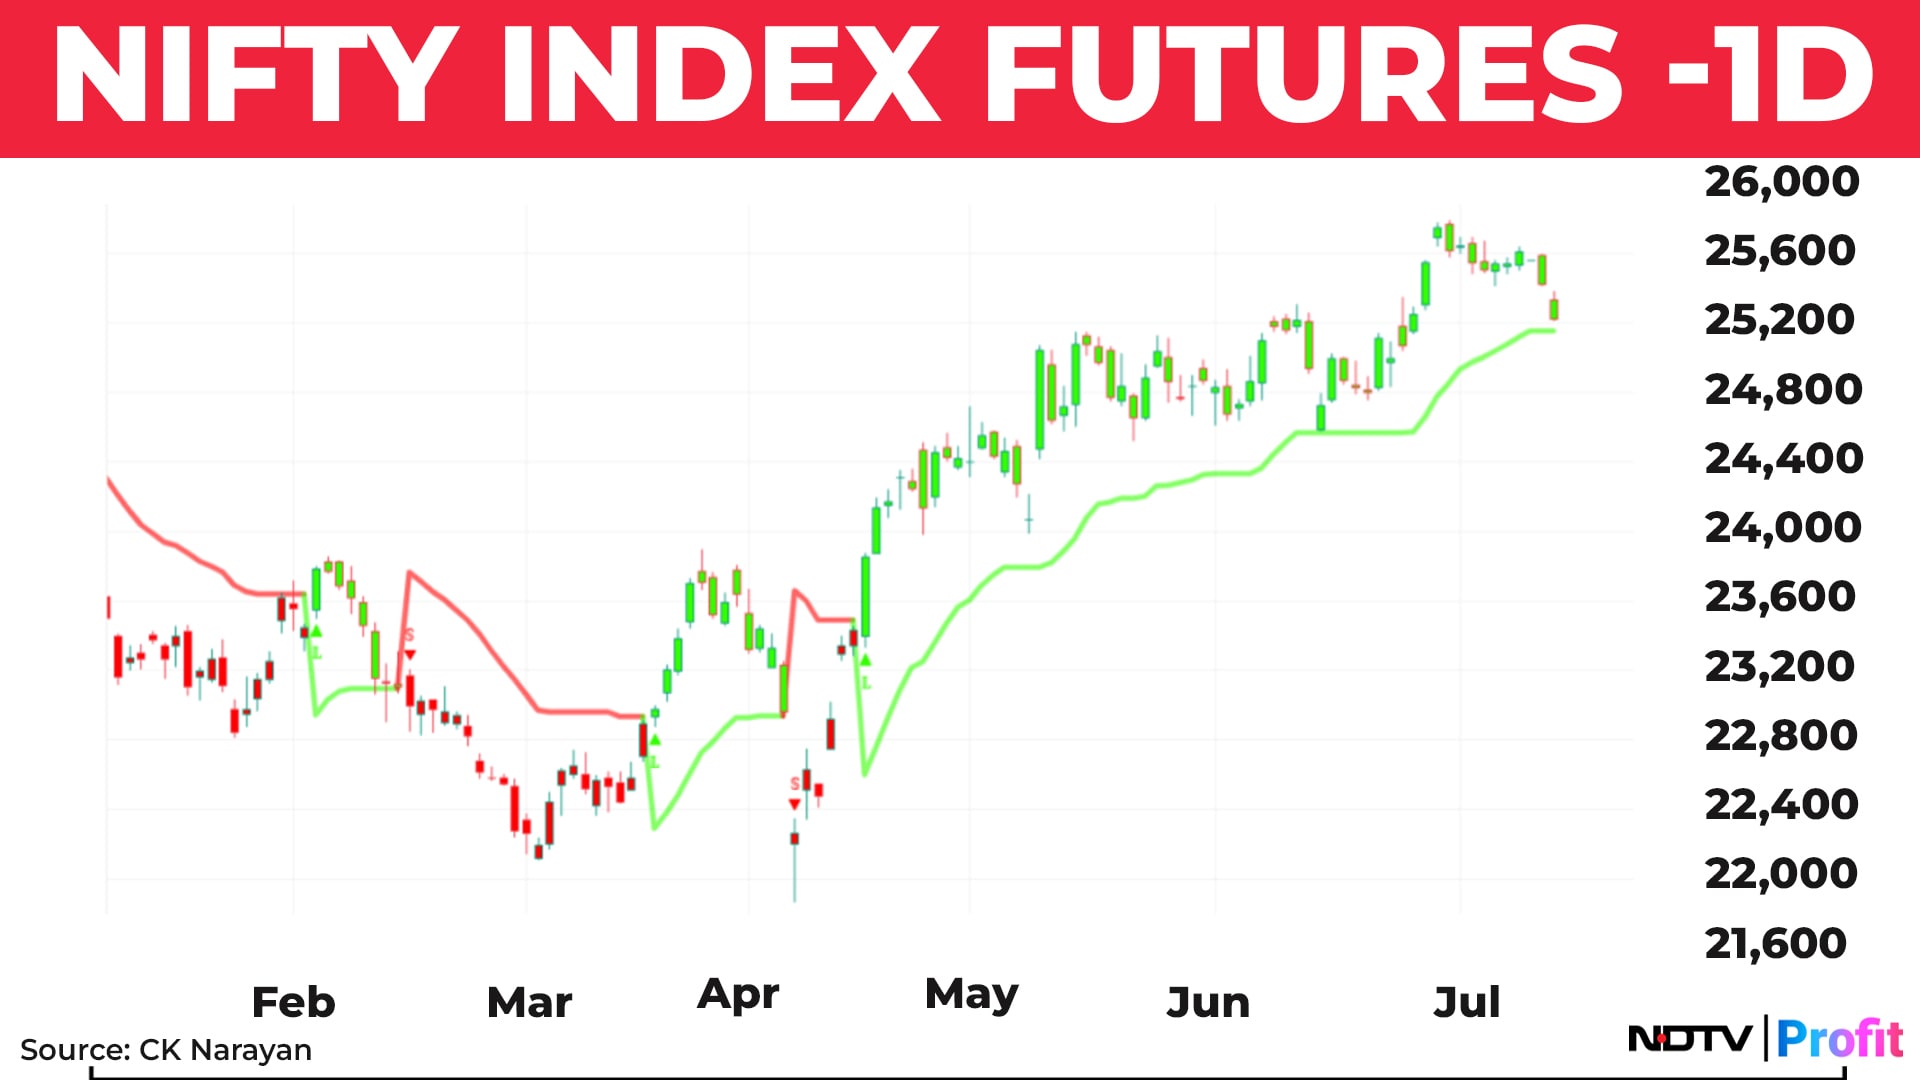
Chart 2 details the same indicator applied to daily charts. Here too, we find that the trend status is not disturbed! So, panics, if any, are in the mind only.
But for those who are thinking ahead about more declines in the short term, chart 3 may be of help.
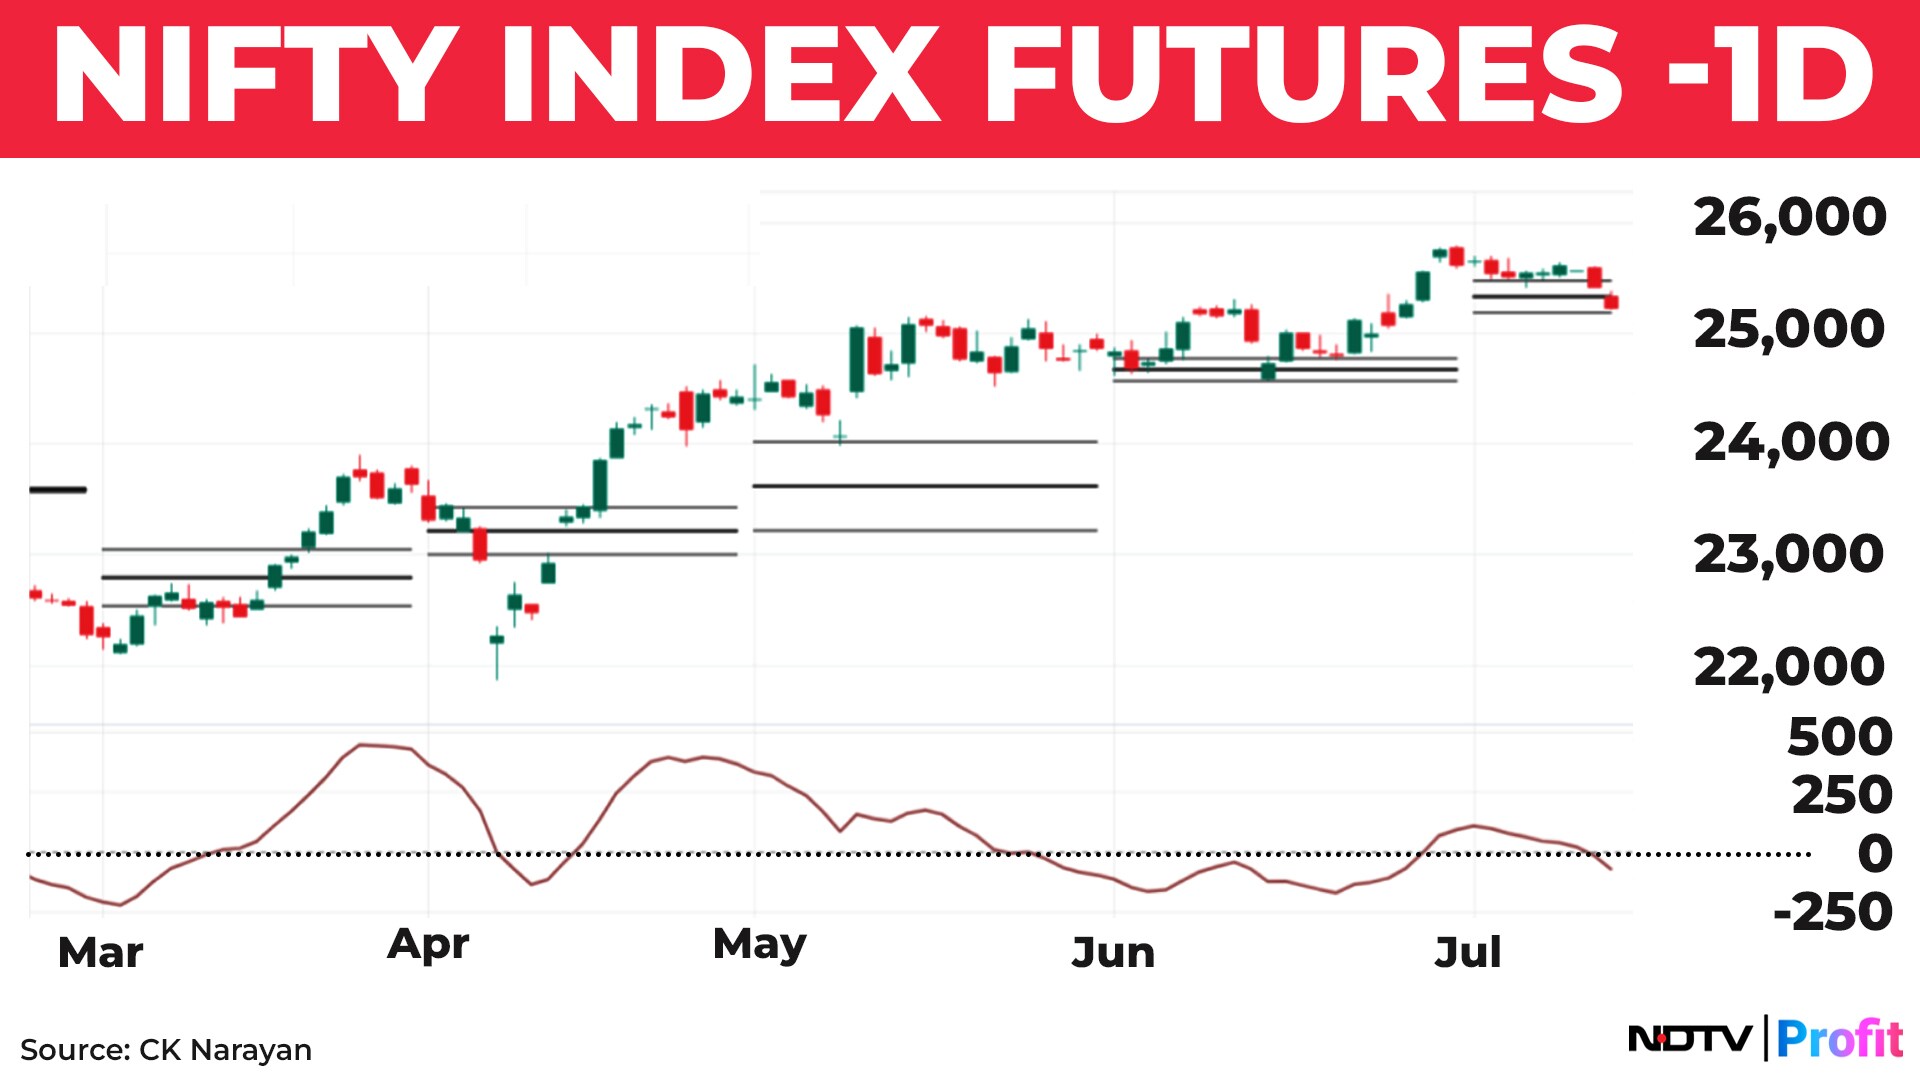
This shows that the prices are challenging the lower end of the Monthly Cpr. A break of that in the coming days would be indicative of some further weakness. The lower panel shows a modified Macd indicator where the line has already crossed below 0, implying weakness has set in. So, this is a chart I would track for a view on the shorter term.
So, it is really a question of which term the reader is following. The beauty of technical analysis is that it has a tool set to address any time frame that you wish to look at. The critical point here, though, is do you know which you want to look at? I will supply you a simple answer- look at the chart of the time frame that you trade/invest. The rest of them are for background information. All of them are necessary because all of them are happening simultaneously! This is an important point that eludes most people when they analyse or decide. Just because you are a longer-term investor, it does not mean that you will not be disturbed by the smaller time frame noise. Similarly, it also doesn't mean that if you are a trader, you will not be influenced by what is happening over the longer term!
Lets shift gears to the supporting actors. Bank Nifty first. It is in a very similar situation as the Nifty with the sole difference that all of these are happening at new high levels. So, in here, declines will have stronger supports that defend the trend, as compared to the Nifty.
Nifty IT. See chart 4. Markets went down on Friday as TCS and Tata Elexi results were soft. Not the best way to start the Q1 results season
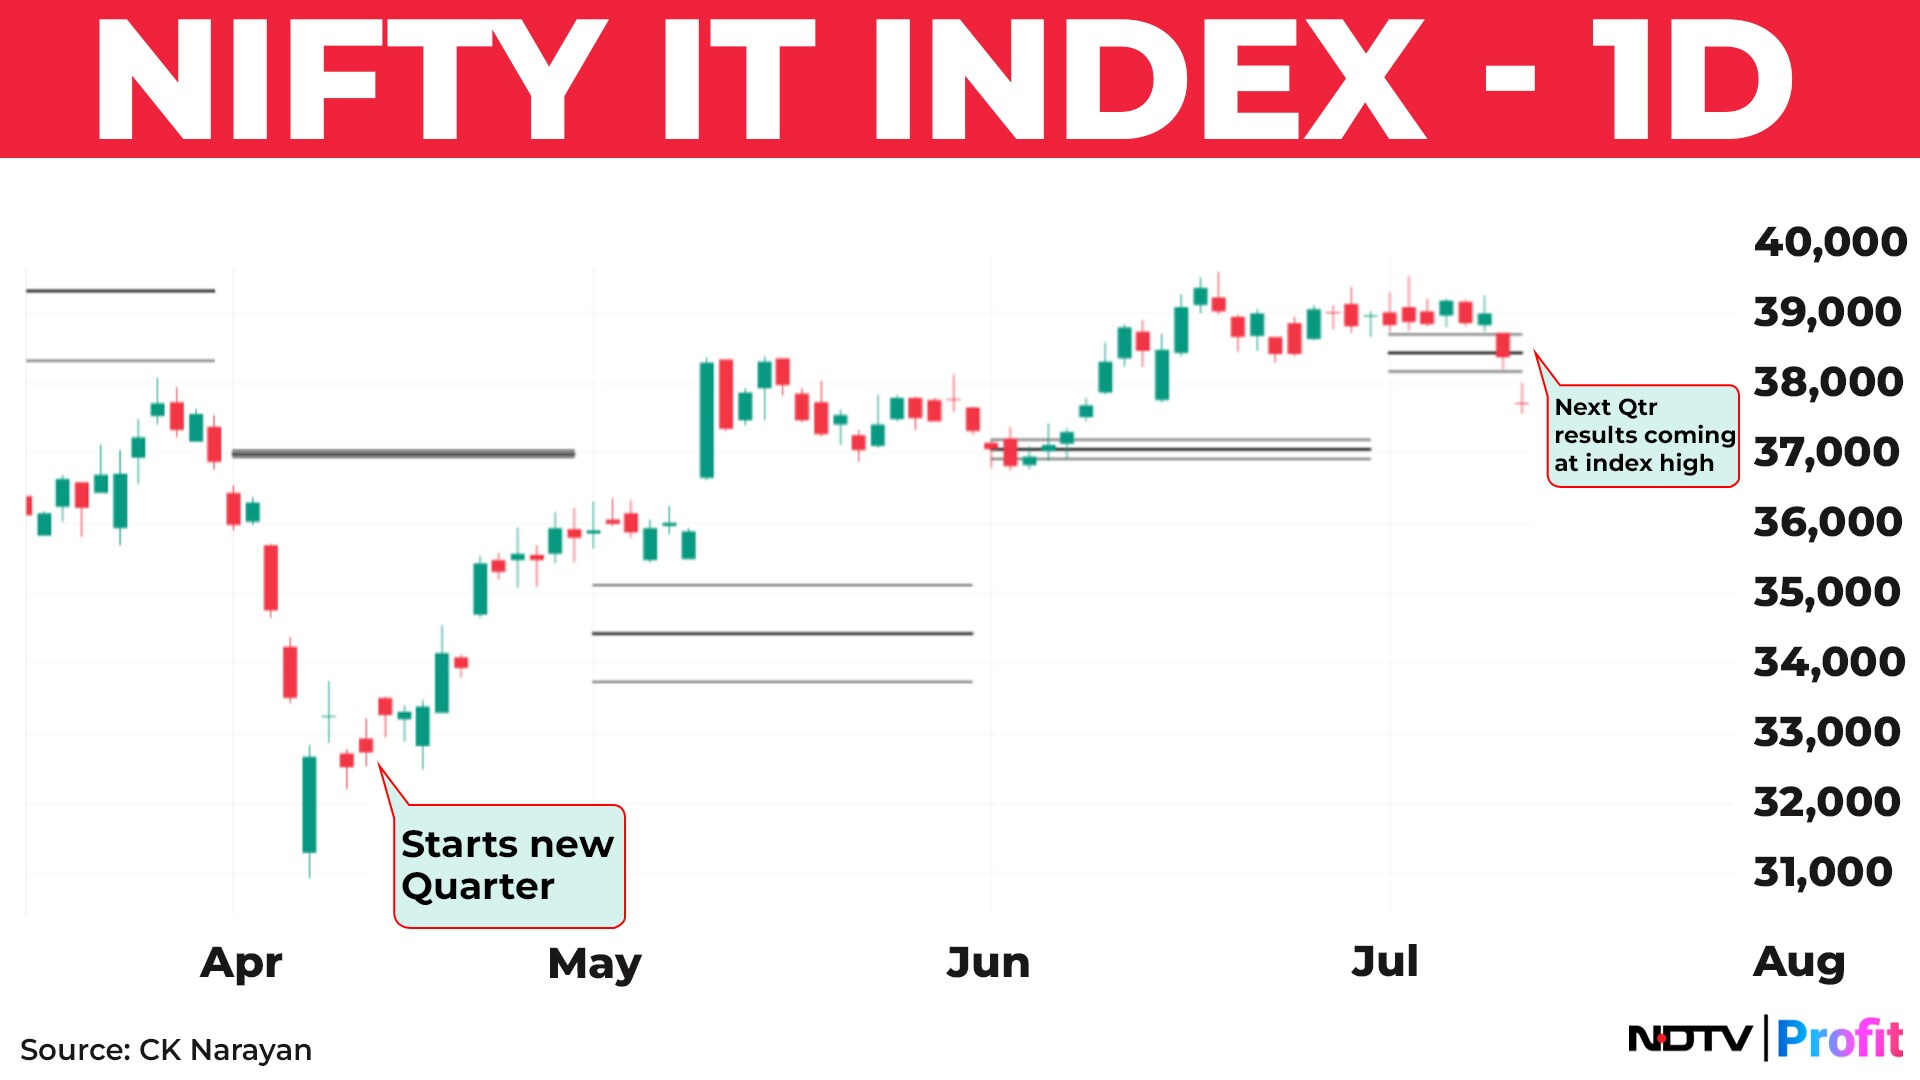
A glance at the IT index chart shows us that when the results for the last Q4 results came, the index was already on an upward path. Therefore, there was a positive tailwind for the stocks. This time around, the results are coming through when the index has moved a decent bit and possibly some headwinds are being experienced- which means that poor numbers will get punished and only some very good numbers from companies may get the backing of the market. Hence the weakness in TCS (a heavyweight on Nifty) and the impact it had on the other Tech stocks on that day. This can possibly extend into the coming week as well and it would be good to remember that as a situational aspect for reading news flow and the signals.
Disclaimer: The views and opinions expressed by the author are his own and not of NDTV Profit. NDTV Profit advises users to consult with their own financial or investment adviser before taking any investment decision.
Essential Business Intelligence, Continuous LIVE TV, Sharp Market Insights, Practical Personal Finance Advice and Latest Stories — On NDTV Profit.