


Readers were warned to look before they leapt. But, on the face of it, that didn't really seem like a necessary warning. If one looks at the chart in hindsight, it would seem like a great week. But only those that lived through it, participating through the day, will know what a tumultuous week it really became! Chart 1 details the activity for the week on intraday charts.

The first two sessions were ok. The required breakout of 24,360 happened on Monday itself, and the close too was positive. So, long position creation was on. By 24,000 one should have been on board this train. Tuesday carried on, and one felt comfortable with longs, having a cushion of around 500-600 points with the new gain. But the next two sessions were among the most volatile in recent times, with the markets dizzyingly volatile.
The most surprising aspect was the total absence of any news or even rumours as to why the Nifty got flung around so much. But it did create a resistance zone near 24,600, and that became a point to cross. This is the Nifty did with some efforts on Thursday, bounding upward to as high as 24,900 only to be hurled down the staircase in a sharp swing. Interestingly, the same zone of 24,600 provided the support now, and there it holds (the green line on the chart).
Traders were taken to the cleaners on the weekly expiry day, and doubtless, option sellers were wiped out. This is their bane—make money like a sparrow's lunch but give it all away like an elephant with diarrhoea!
This did not leave traders with very much energy to do much on Friday, which had an event by way of the RBI policy, where the expected cut of CRR did get announced, but the market chose to eke out a sideways action through the day. Certainly a tame end to a rollicking ride earlier!
I had mentioned a lot of items to watch and track on the chart in the last week. Chart 2 details many of those. Let's check those out to see how the market fared in terms of technical indicators.
First, the prices have rallied into the 50% retracement, something that is normal during any countertrend rally. That it also slammed against the overhead Ichimoku cloud is another resistance to run into.
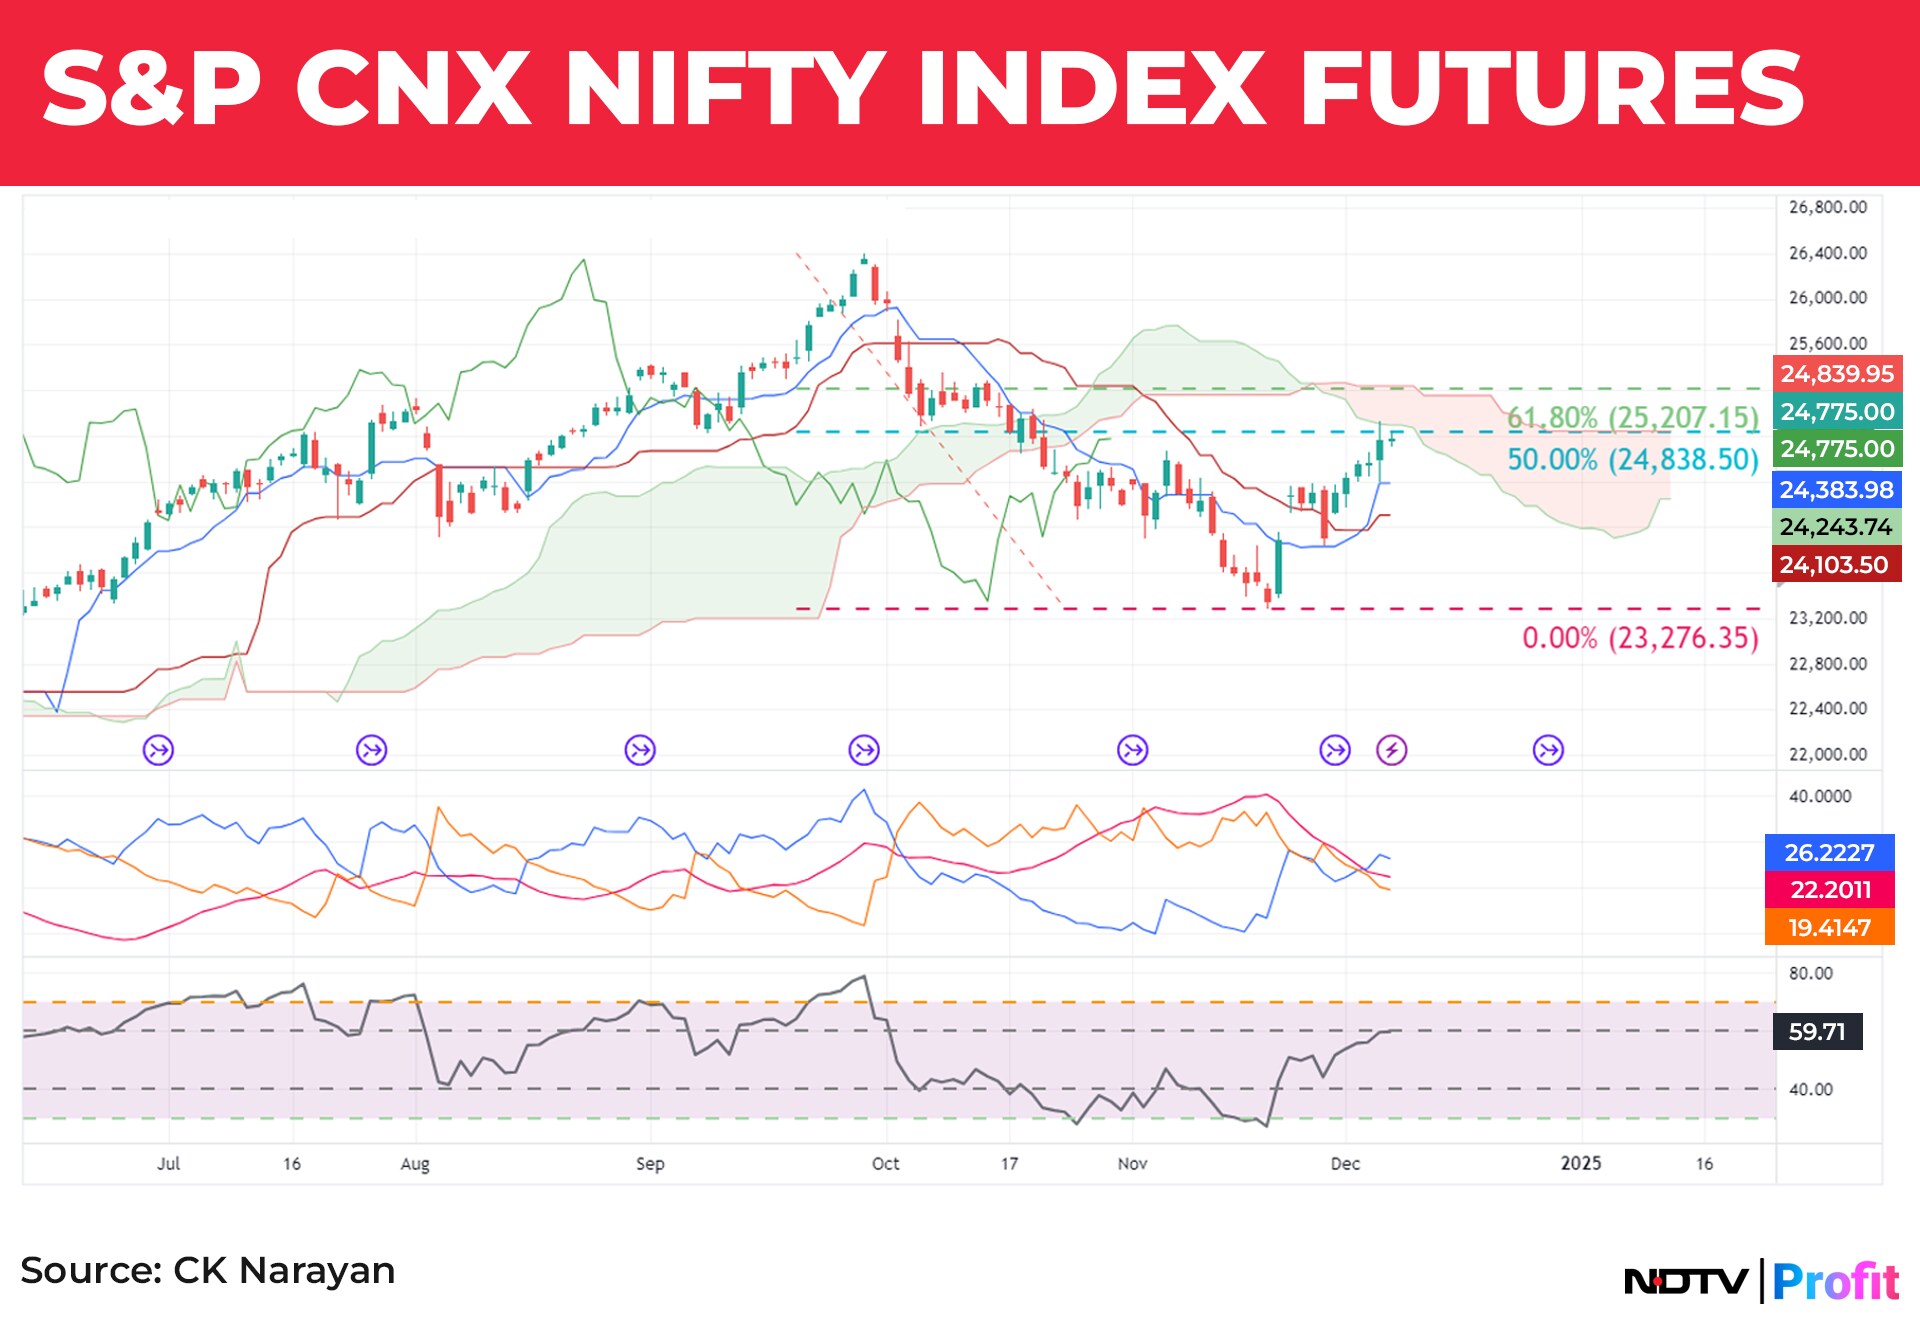
Though the TS-KS lines turned a tad positive and the CS line climbed above the prices, they are all still trading well below the cloud, and hence their positivity is to be considered tentative. In addition, the DI lines did cross positive, but that too is tentative since it would take much action for this indicator to turn dominant. The RSI has rallied to near 60, and that is another tentative signal only.
Thus, while we may have seen a nice move since we tracked the index down into the bottom near 23,200 last month and also tracked the breakout near 24,350, and buys emerging off those signals would be in a sizable profit, the moves are yet to be considered a rally.
There is also something that I spotted last week that could have been highlighted earlier, but I had missed it. I found a price and time match occurring on Dec. 4 at price levels near 24,700. Although the prices traded higher on the next day (5th), the intense volatility smacked of some distribution, and the same behaviour followed on Friday as well. Based on this, I would venture to state that if the Nifty future now does not trade above 24,900 levels and proceeds to break below 24,400, then the rally may be over, and we may witness another decline that would head towards the 23,800 area once again.
In the light of the indicators showing tentativeness and the rise having reached Fib retracement and Ichimoku resistances, the whole picture suddenly takes on a different shade altogether! The bullishness that may have been engendered (if) from CRR cuts and reasonably positive commentary by the RBI governor for growth ahead needs to be tempered by the not-so-good technical picture.
Of course, the market can drag itself out of this seeming hole by showing some strong positive price action. For example, the FII have been cranking up the buys during the week just ended. In the last letter I had already shown how short covering action had been in progress in the derivative space. The same continued throughout the week, and now the FIIs have a very small net short index futures position. In fact, this is on the verge of turning net positive if they continue in the same vein. It is also interesting to see that the retail segment, which was strongly long at the start of the last week, shed their positions by a large quantum in the rise.
But after the high on 5th, the ATM IV has dropped, and so has the PCR, which is now down to 0.89. India VIX, which had gone almost to a breakout level, has now receded and reached 14% by the end of the week. These indicate a gradual softening of the trend, and for the week ahead, some of these would be the data to watch along with the price action.
In the last few letters, I have been expecting the Bank Nifty to provide the triggers for the Nifty as well. It has been slow but has kept the faith, and in contrast to the Nifty, the BNF has retraced almost 80% of the fall into the November low. While the Nifty is still a good distance from the all-time high, the BNF is now quite near this landmark, being just around 600 points shy of it. One good day and this chasm can be easily crossed. If that does happen, then it will definitely provide fresh sentiment triggers for the market. In the banking space, HDFC Bank has been the Virat Kohli of that team, and the others are yet to start swinging for the fences, but ICICI Bank is now making the effort with a push to a new all-time high. Axis and Kotak are laggards but need to keep the upward path going, and if SBI pitches in now, Bank Nifty may still have a party in the coming week.
The RBI came in with a helping hand, cutting the CRR by 50 bps. The Governor made some agreeable statements that mollified the market and helped hold the levels steady on Friday. Neutral statements on GDP will now shift the focus ahead towards a rate cut in Feb 2025. Unless other events interfere. The weekly chart of BNF (chart 3) is hinting at continuing higher ahead. The gap area near 51750 can be kept as a trend decider for the short term for long positions.
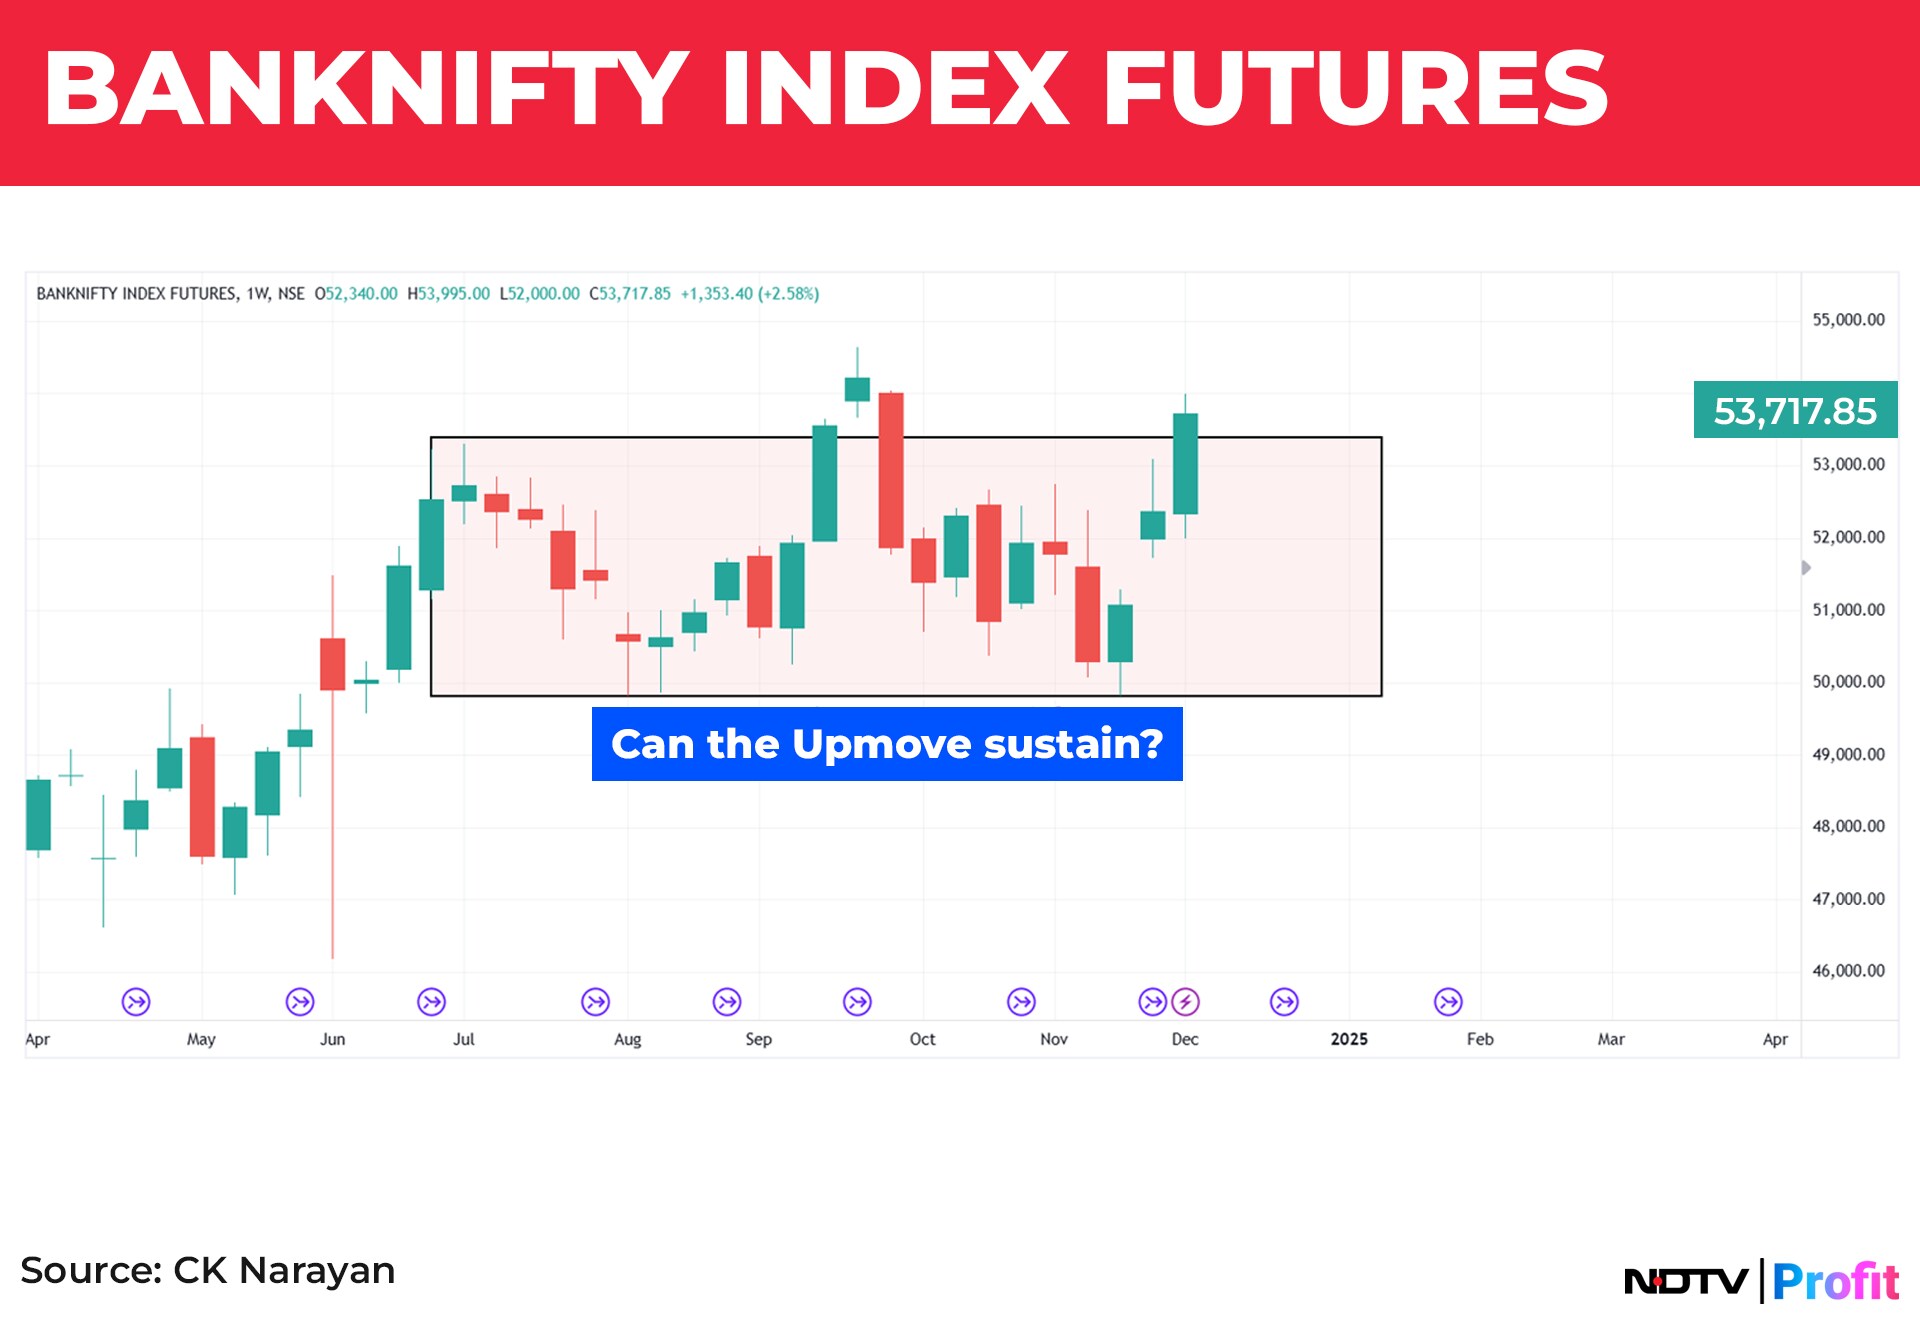
As mentioned earlier, for continuation, the big private banks need to move. Positive price action has already happened in the PSU bank space. That is good for maintaining a positive sentiment bias. Barring SBI, the rest don't really move the needle for the BNF. So, once again, private banks are still the space to watch in the coming week.
How fares the retail trade? Referring to the monthly Heiken Ashi chart of the MidSmall400 chart (chart 4), we see some struggle that has been going on over the last three months. No doubt some portfolios have been hit down badly (where the quality of stocks may have been somewhat suspect), but by and large, the levels have held up pretty well, with very minimal price damage. The prior uptrend is pretty solid, and unless we see some reversal signals (hinted at in the November red candle), we have to presume that the prior uptrend is still in force. Of course, it is early days yet for the December candle to form, and therefore this is an area to watch. For, when retail portfolios are damaged, the volumes in the market go down and the sentiments get fractured—neither of which are encouraging for the trend.
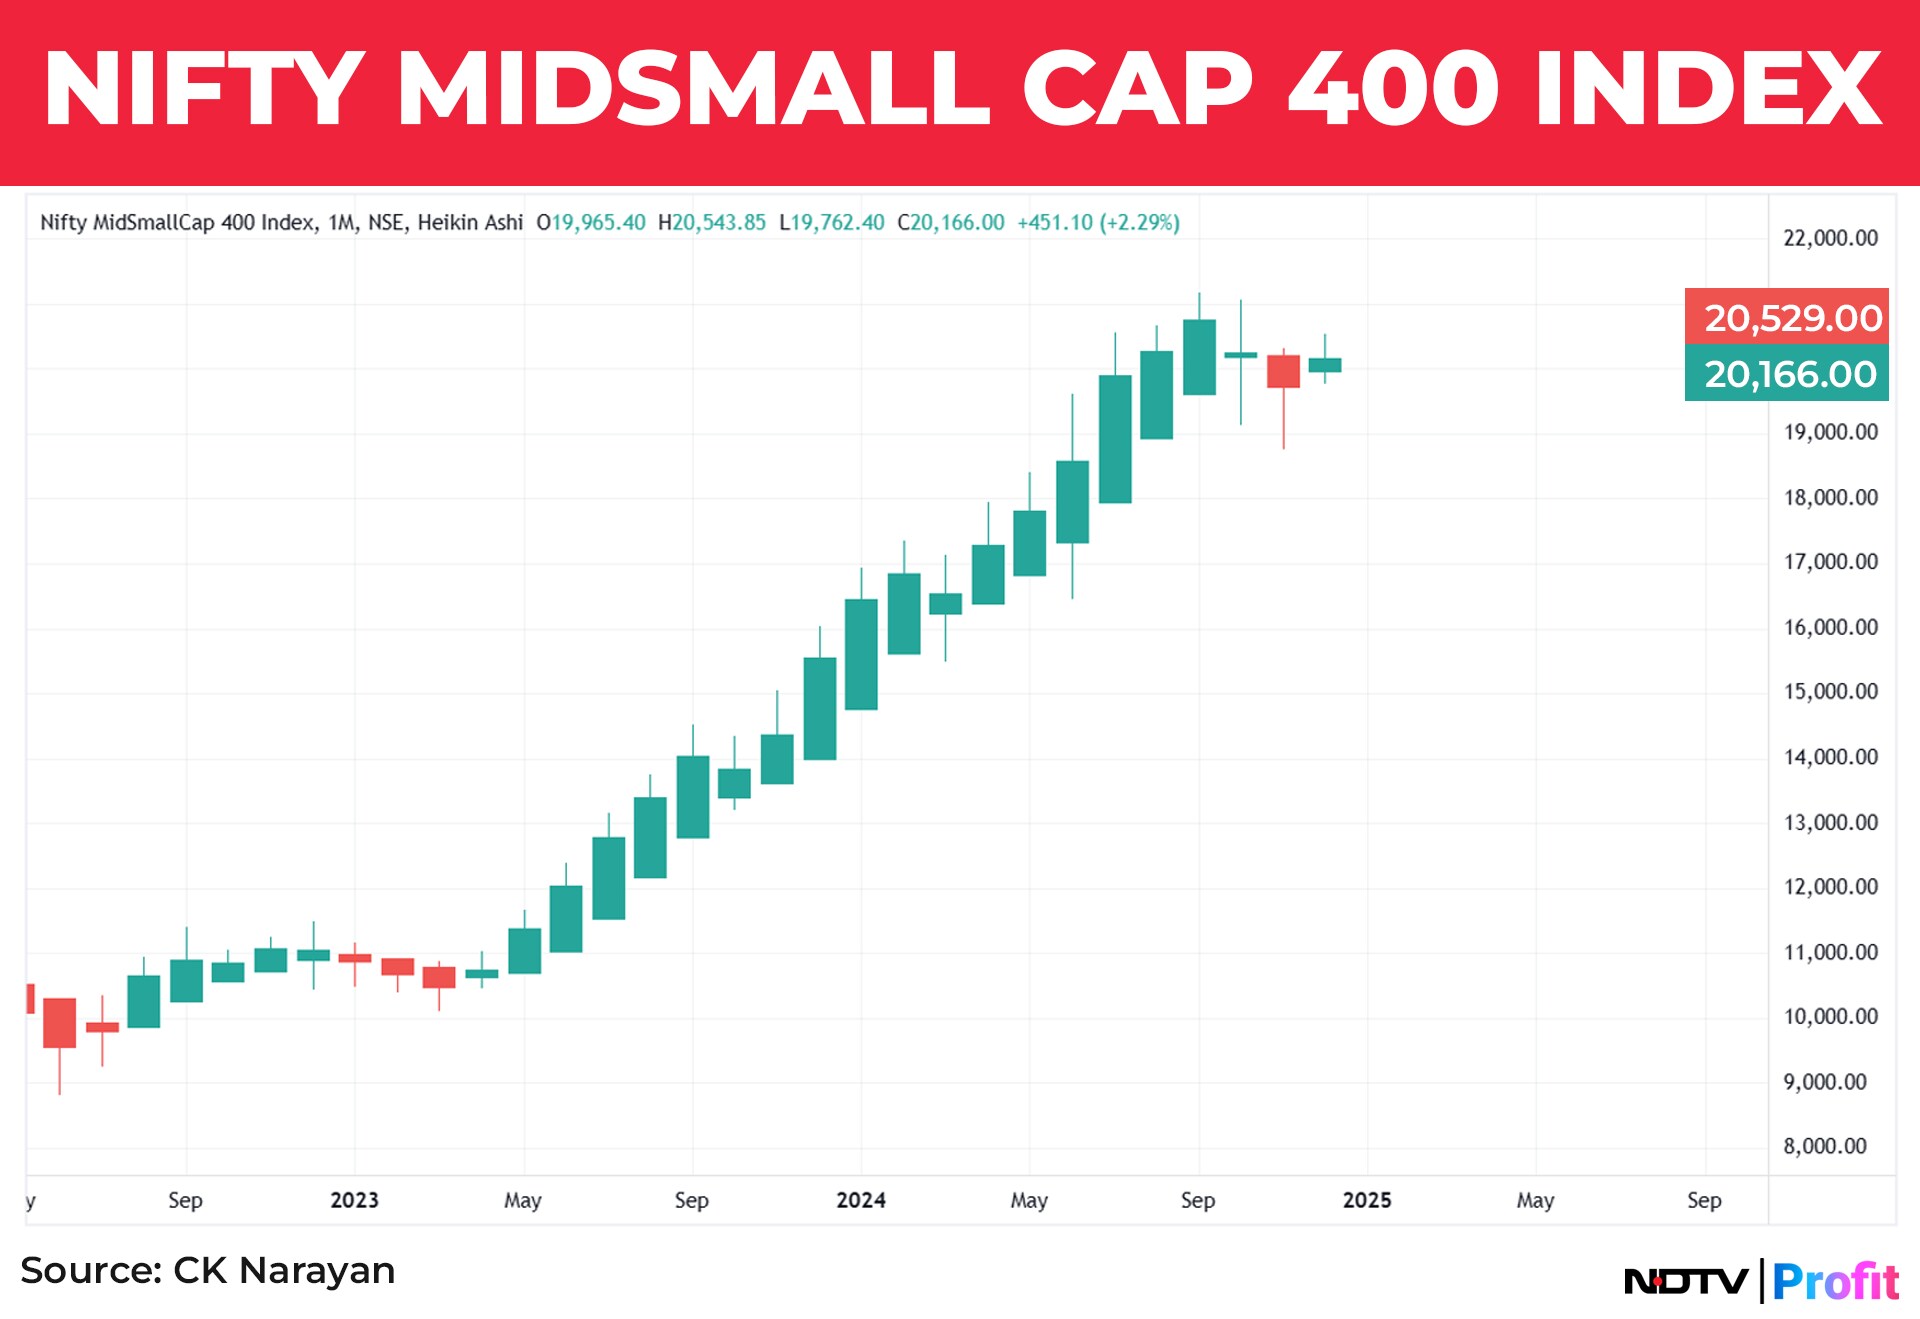
I have used the Heiken Ashi chart here because retail money has been fuelling this rally for a while, and so long as that is not disturbed, the bulls are still in the game. I find the HA chart particularly useful to check longer-term trends.
Let's check what has not moved well. There is one Nifty Commodity index that contains some large-cap stocks that are leaders in their field. See chart 5.
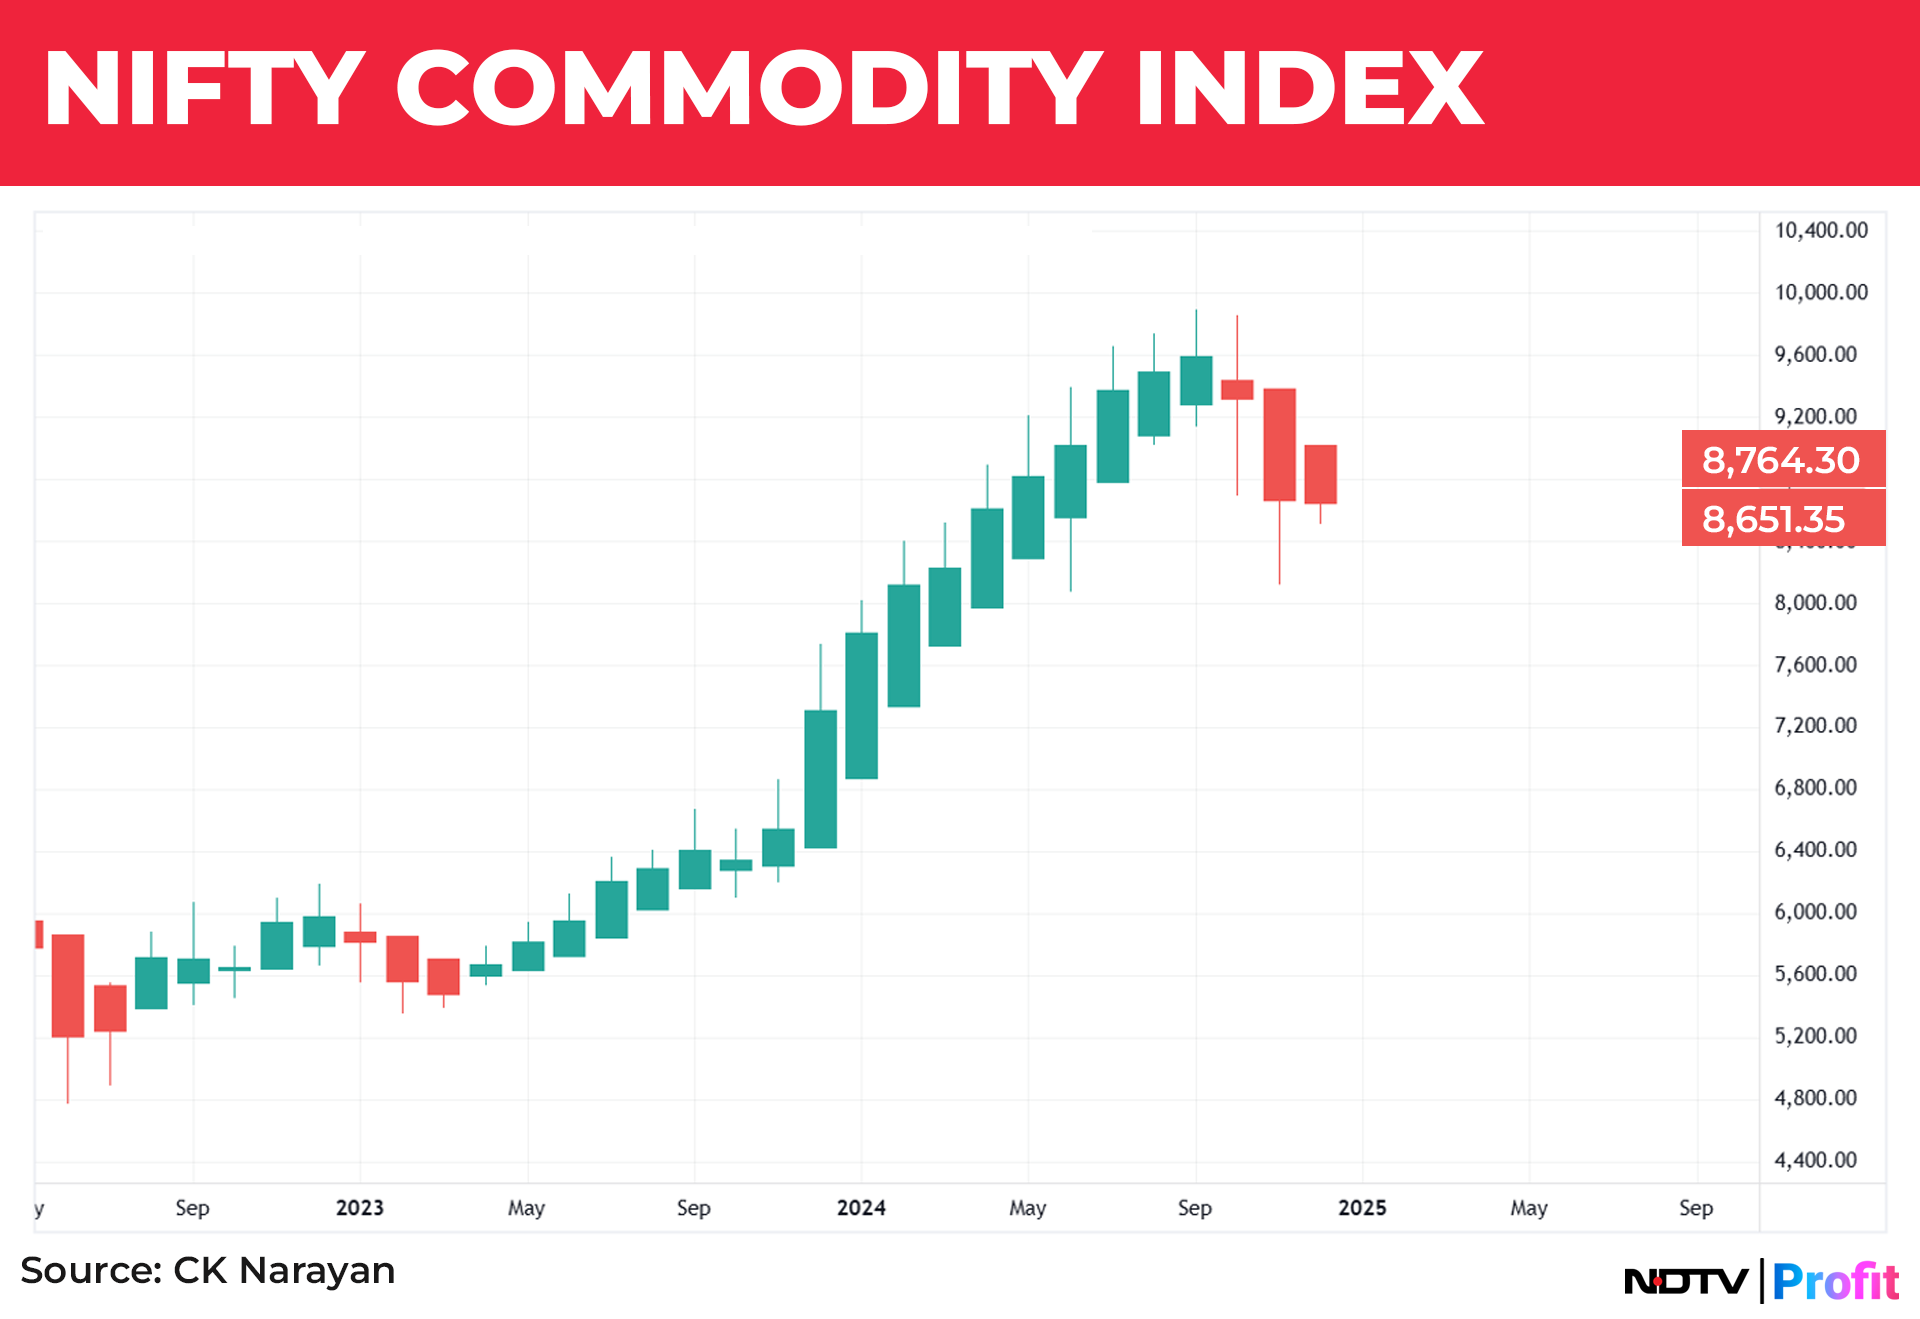
Here, the Heiken Ashi candles have seemingly flipped over a bit. Reliance is one of the main culprits for taking the index down, but there are several others too that are not in good shape. A lone fight is being put up by JSW Steel, but that is not going to be enough. Holders of long positions in the commodity area should be on the alert as leaders are sinking a bit.
It is not as though this index is an exception—there are many others that show a similar flipping-over pattern (MNC, Infra, Power, PSU, etc.). I chose the commodity index randomly from among these, as the list is composed of all large-cap, leader names, and there is a reason to take some notice of changes wrought by three months of correction.
This is not to mean that the market is turning bearish. However, it may certainly signal the possibility of some sustained correction, extending time-wise without too much price damage, perhaps. Now, that is as mentally debilitating as price corrections are—perhaps worse too! Therefore, the market may be hinting to us not to get too hung up on longs or be in any major hurry to rush into buys on every dip as we used to.
We have been so used to reading the short-term signals for some 3-4 years. Complacency is never a good habit. The market is still at a turn. Let not a tentative rally (so far) dull your alertness.
Essential Business Intelligence, Continuous LIVE TV, Sharp Market Insights, Practical Personal Finance Advice and Latest Stories — On NDTV Profit.


