


We had to wait the entire week for the breakout to occur. And that tried the patience of many. Then, finally, on Friday, with the RBI Governor announcing a generous 50 basis point rate cut, the markets staged the long awaited upward thrust. In both Nifty and the Bank Nifty. The last letter had indicated that it would happen in the Bank Nifty first and be followed by the Nifty. But I had also mentioned that it may need an event for the breakout to happen and hence it was no surprise that the market waited till the end of the week to stage it. So here is how it looks at the end of the last week. Below are Nifty future and Bank Nifty.
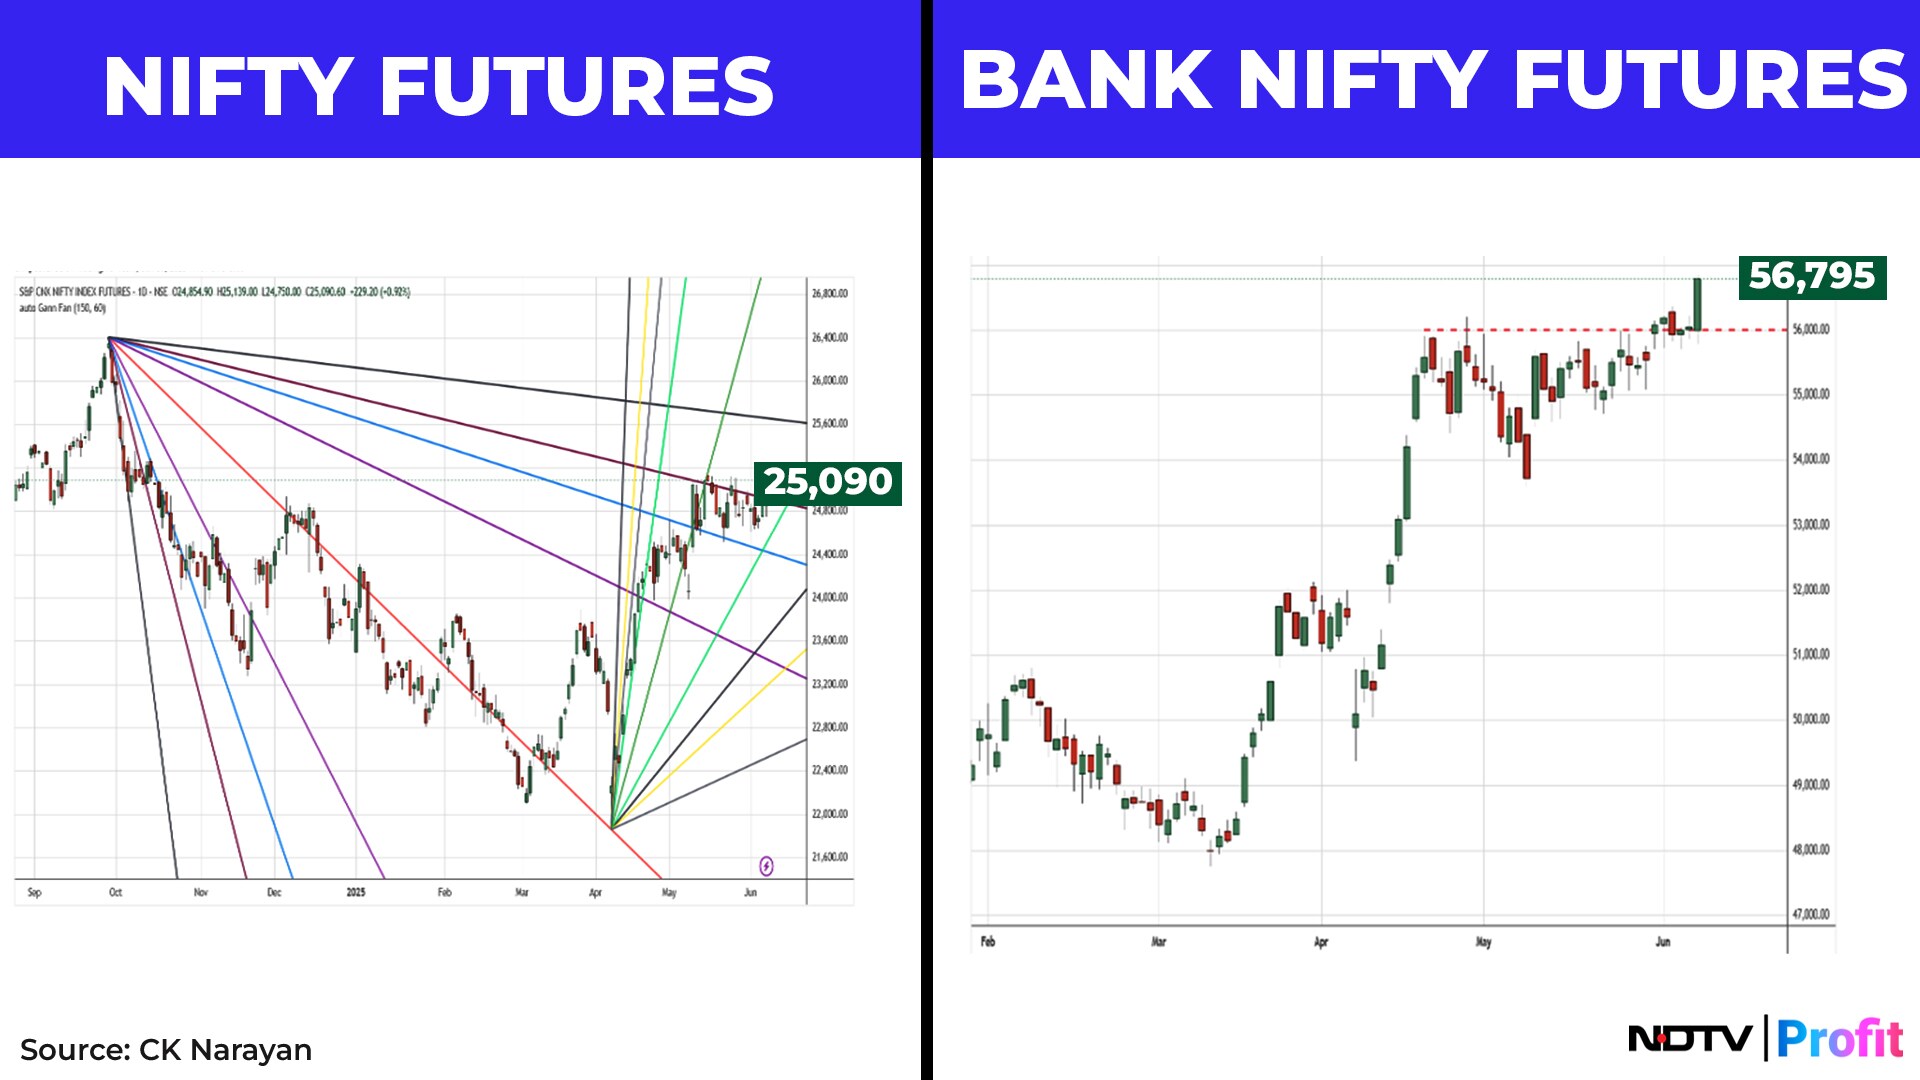
The Nifty chart is annotated with Gann angles and the prices have remained below the angle line all thru the consolidation, until Friday. The Bank Nifty, on the other hand, was already above the resistance Gann angles even before the consolidation started and hence the pattern breakout is shown. They are the same period-just that I have used different compressions to highlight the breakout.
While the Bank Nifty huffed and puffed a bit even though the market priced in 25 basis point rate cut, it was over the last couple of sessions of the week (Wednesday and Thursday) that the derivative markets signalled that the Nifty too would attempt a breakout. There was a steady long OI buildup over those two sessions suggesting that, quietly, those in the know were piling up the positions. It is almost like the magician, who while performing a trick, draws your attention away from the main item even as he creates the situation for the actual magic trick. The media over the week was fully focused on Bank Nifty and its possibilities because the pattern was so evident on the charts and the PSU banks were surging; everyone's attention got drawn to that. That allowed the more seasoned players to accumulate their positions in the Nifty quietly without raising their costs!
Well, now that the breakout has happened, what next? What is needed is continuation. For that, nothing adverse by way of news should emerge. So, that is first thing to guard against. Second, there will be pullbacks and that should hold up above support zones that will have to be defined at the start of the week and then redefined as the move unfolds. Hence it cannot be provided here. All I will say is that the breakout levels of last week should not be lost. Third, we saw derivative positions build up in stocks ahead of the breakout in the index. Ideally, this ought to continue. Fourth, the FII short positions in the Index futures should now start getting unwound once again. They got built afresh all thru the recent weeks. Chart 2 shows this.
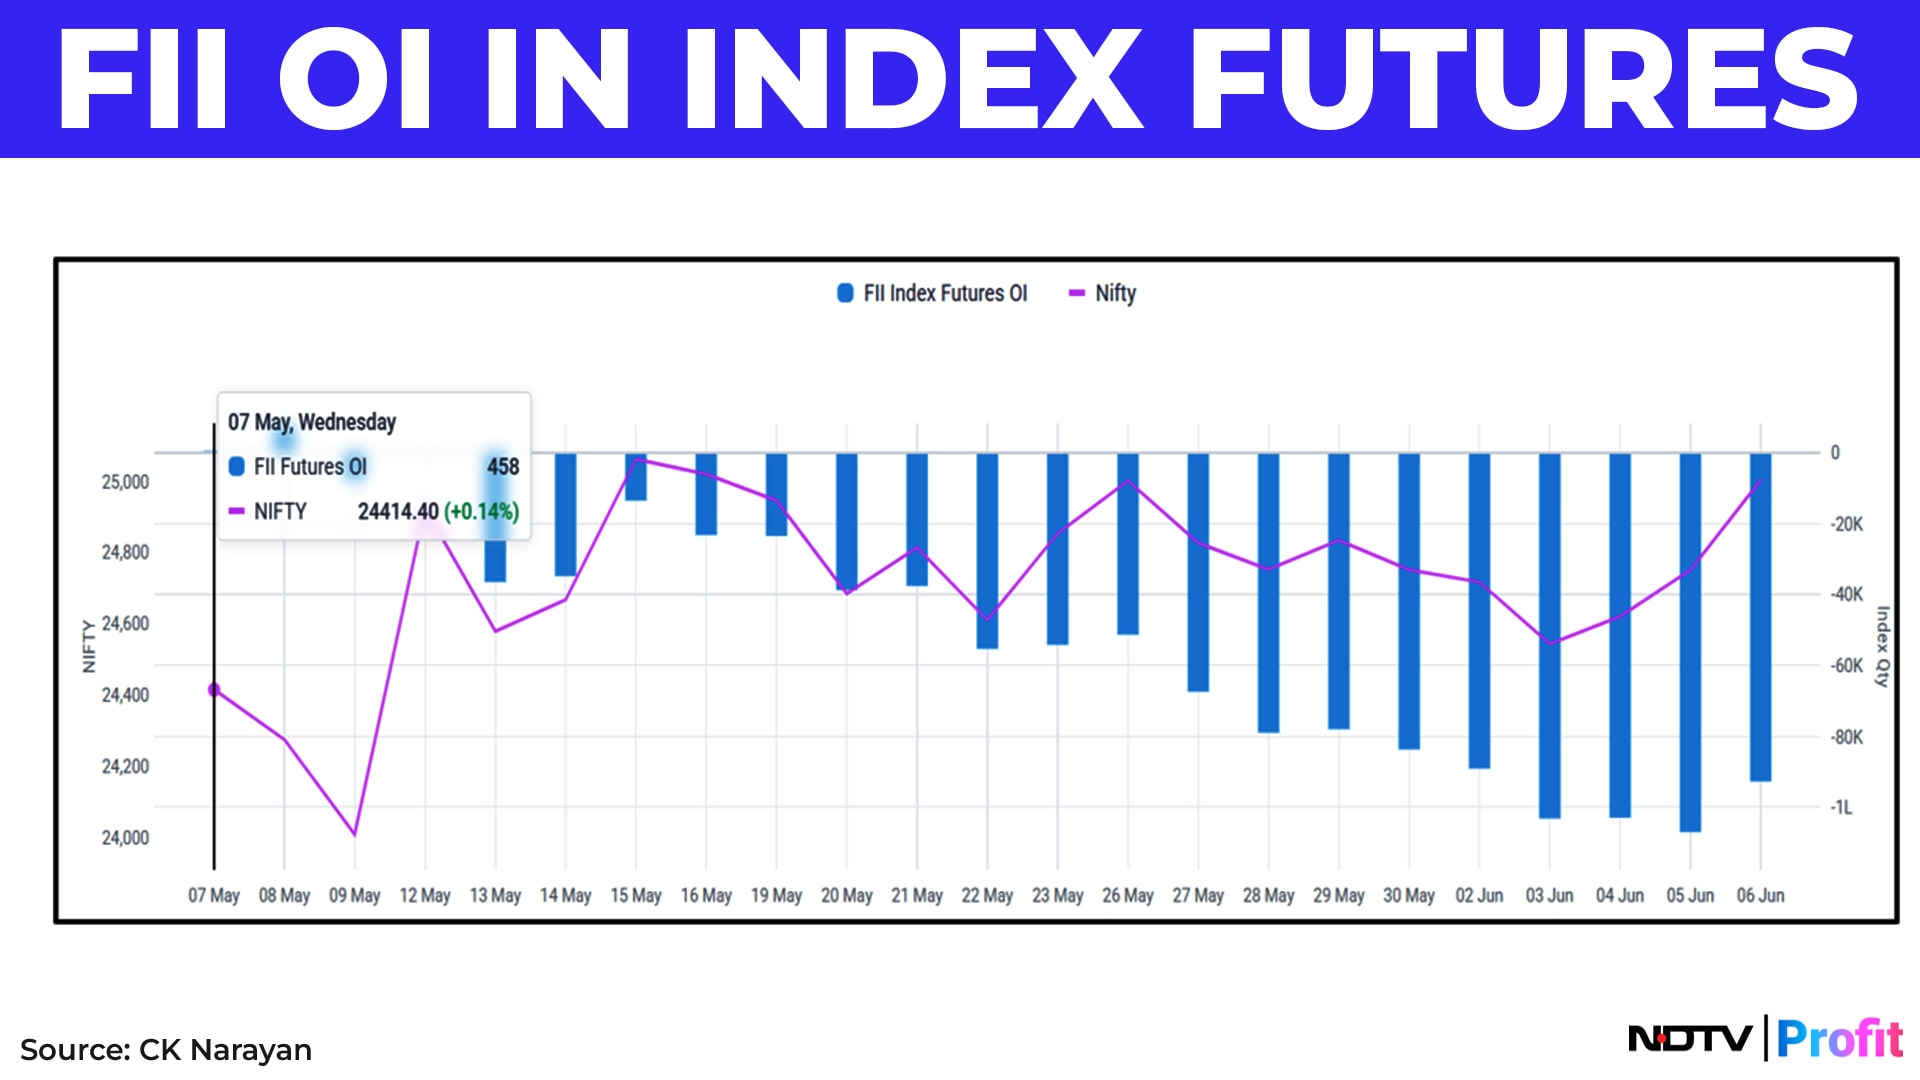
Now, as to why the FIIs chose to do this (they went all the way to net long in the last month) even as they were going net positive in cash markets is not clear to me. But the fact is, they did. Now, I would want to see them unwind these net short positions as a signal that they too believe this breakout will last.
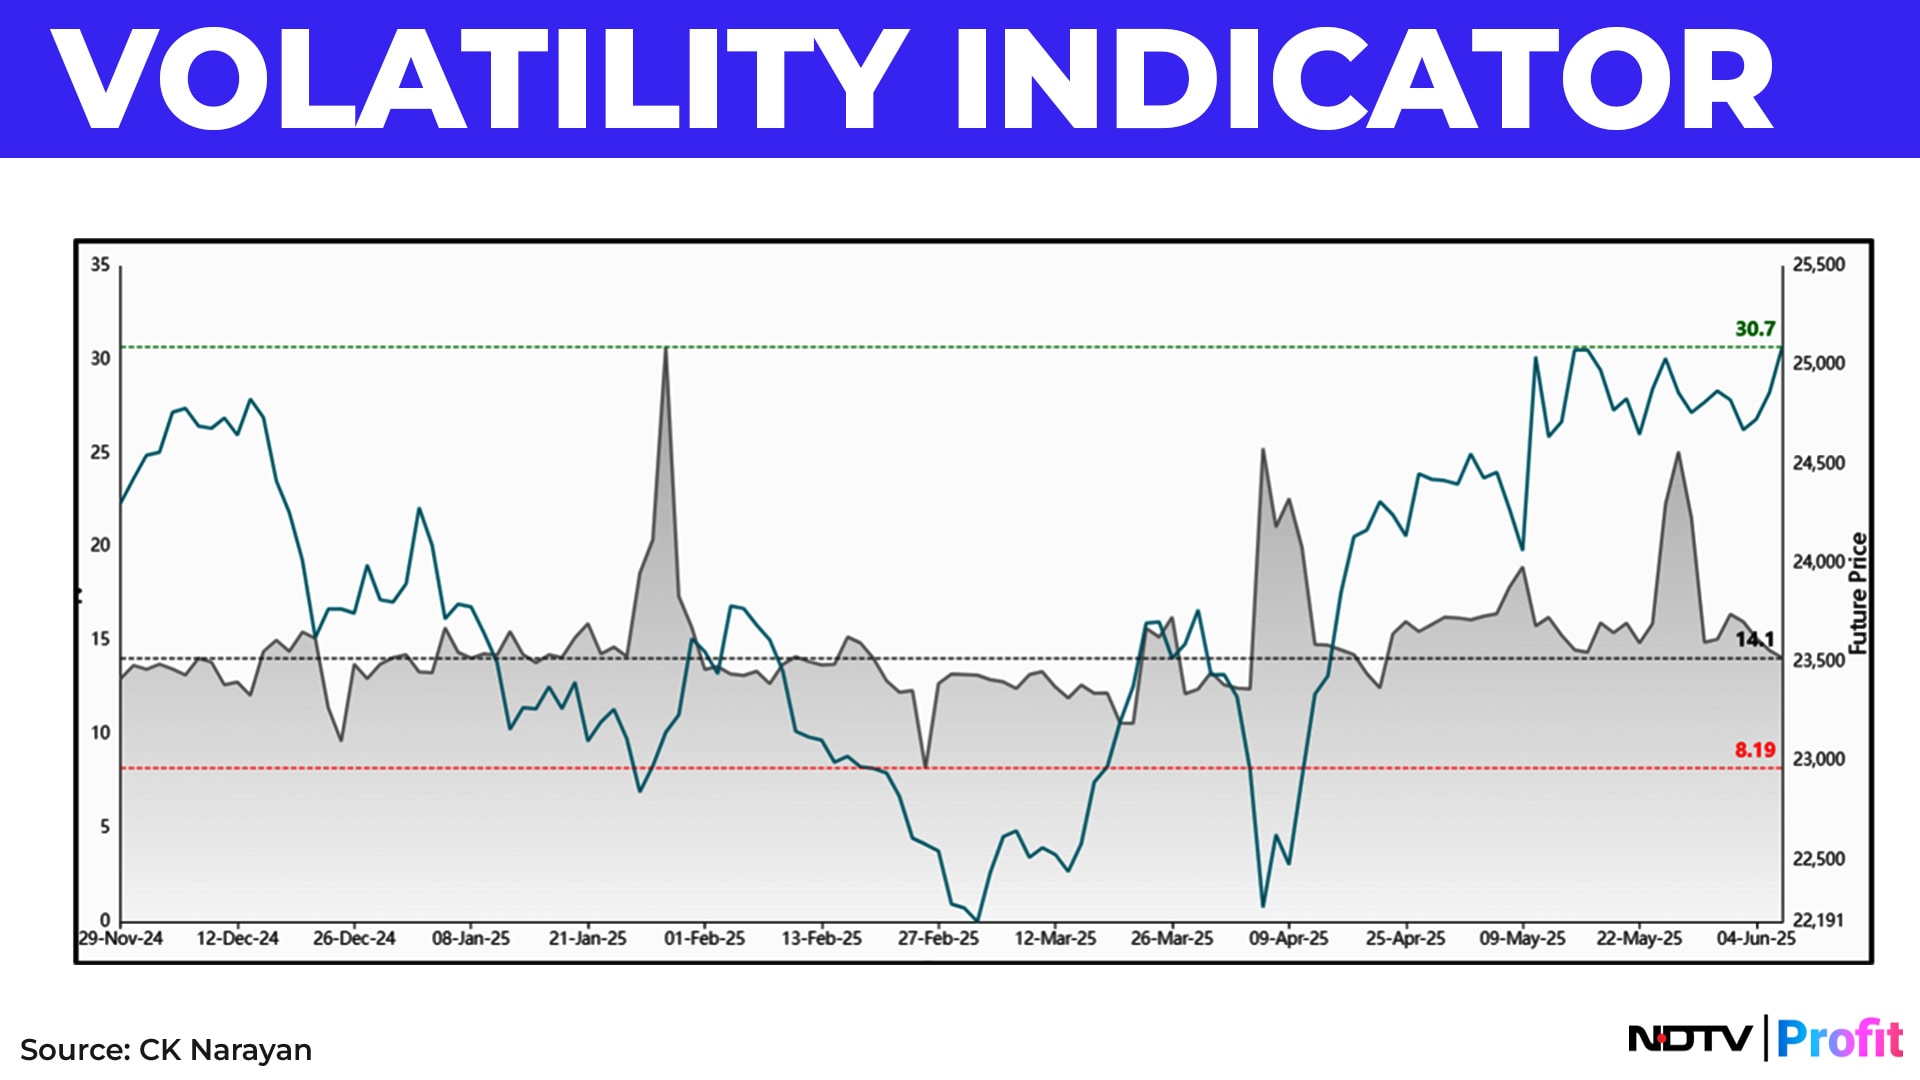
Chart 3 shows the implied volatility coming off. This typically shows the fear level in the market and we can note that as the prices are going up, the IV levels are coming down. We need the IV plot to go down a bit more in the Nifty (as it is already down into a support zone in the Bank Nifty) so that we can be sure that dips will get bought into with more confidence.
Short covering in Options area is something that could drive markets higher, particularly in Bank Nifty. The highest concentration of shorts seen at 56,000 strike in both Call and Put (19L each) dwarfs the other strikes. On Friday, call unwinding was seen (small, 1.6%). The premium at the end of Friday for the straddle is around 1,750-1,800 points and given that we also find big addition to the OI (@10L) at 54,000/58,000 strikes, this also looks like a Condor position, given the wide enough range. But this gives one an idea of the expectations of the market. In the last letter I had mentioned that the triangle pattern in the Bank Nifty suggested a 2000+ point move upon a breakout. This is in line with that expectation. Adroit managing of the Put shorts, as prices rise, could bring in decent returns to the seller.
The RBI Governor managed the policy smartly this time by adding a 100 basis point CRR cut as well. This should buoy up the financials well. Many NBFC stocks were up and could continue to remain in the limelight ahead. So, in addition to the banks, this is another area of interest that has emerged for the weeks ahead.
If one looks at the one-month performance of the sector indices, the standout performers are Realty (21%), PSU Banks (14.6%) and Financial Services (ex Banks). Market was expecting the cut, after all. Only, they left it till the end of the week for the big indices to break out. But bulk of the traders focus on the main indices and hence that governs the sentiment. This is a good lesson to look at more evidence if one wants to get the jump on trends.
Continued follow thru in these sectors would be a further signal that the main indices would push up higher.
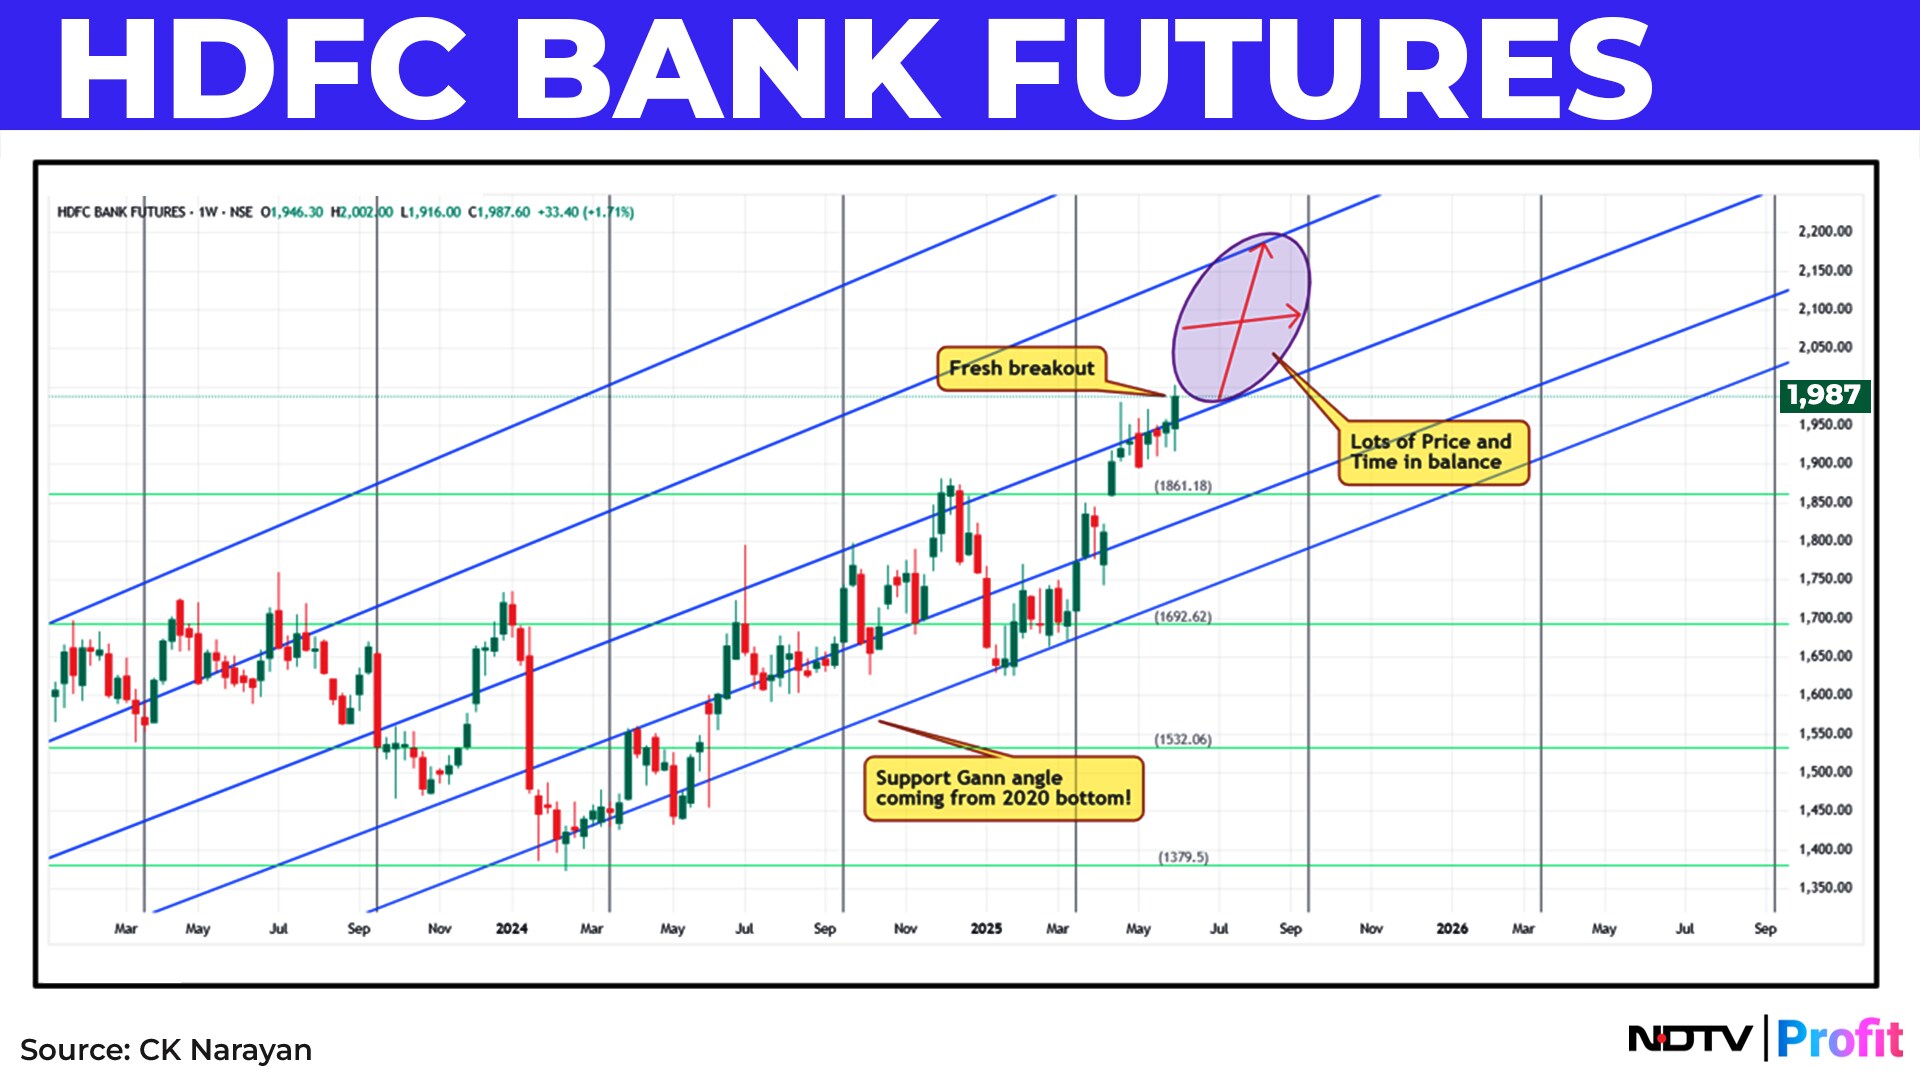
9th June is a time trigger for the Bank Nifty. I would look for some acceleration that can help carry the index towards a target of 58,000 or better. The next important time zone for the Bank Nifty is around 5-9th July. I had looked to SBI to lead. But it now seems like HDFC Bank will overtake and grab the leader mantle.
Chart 4. HDFC Bank with Gann price and time grids.
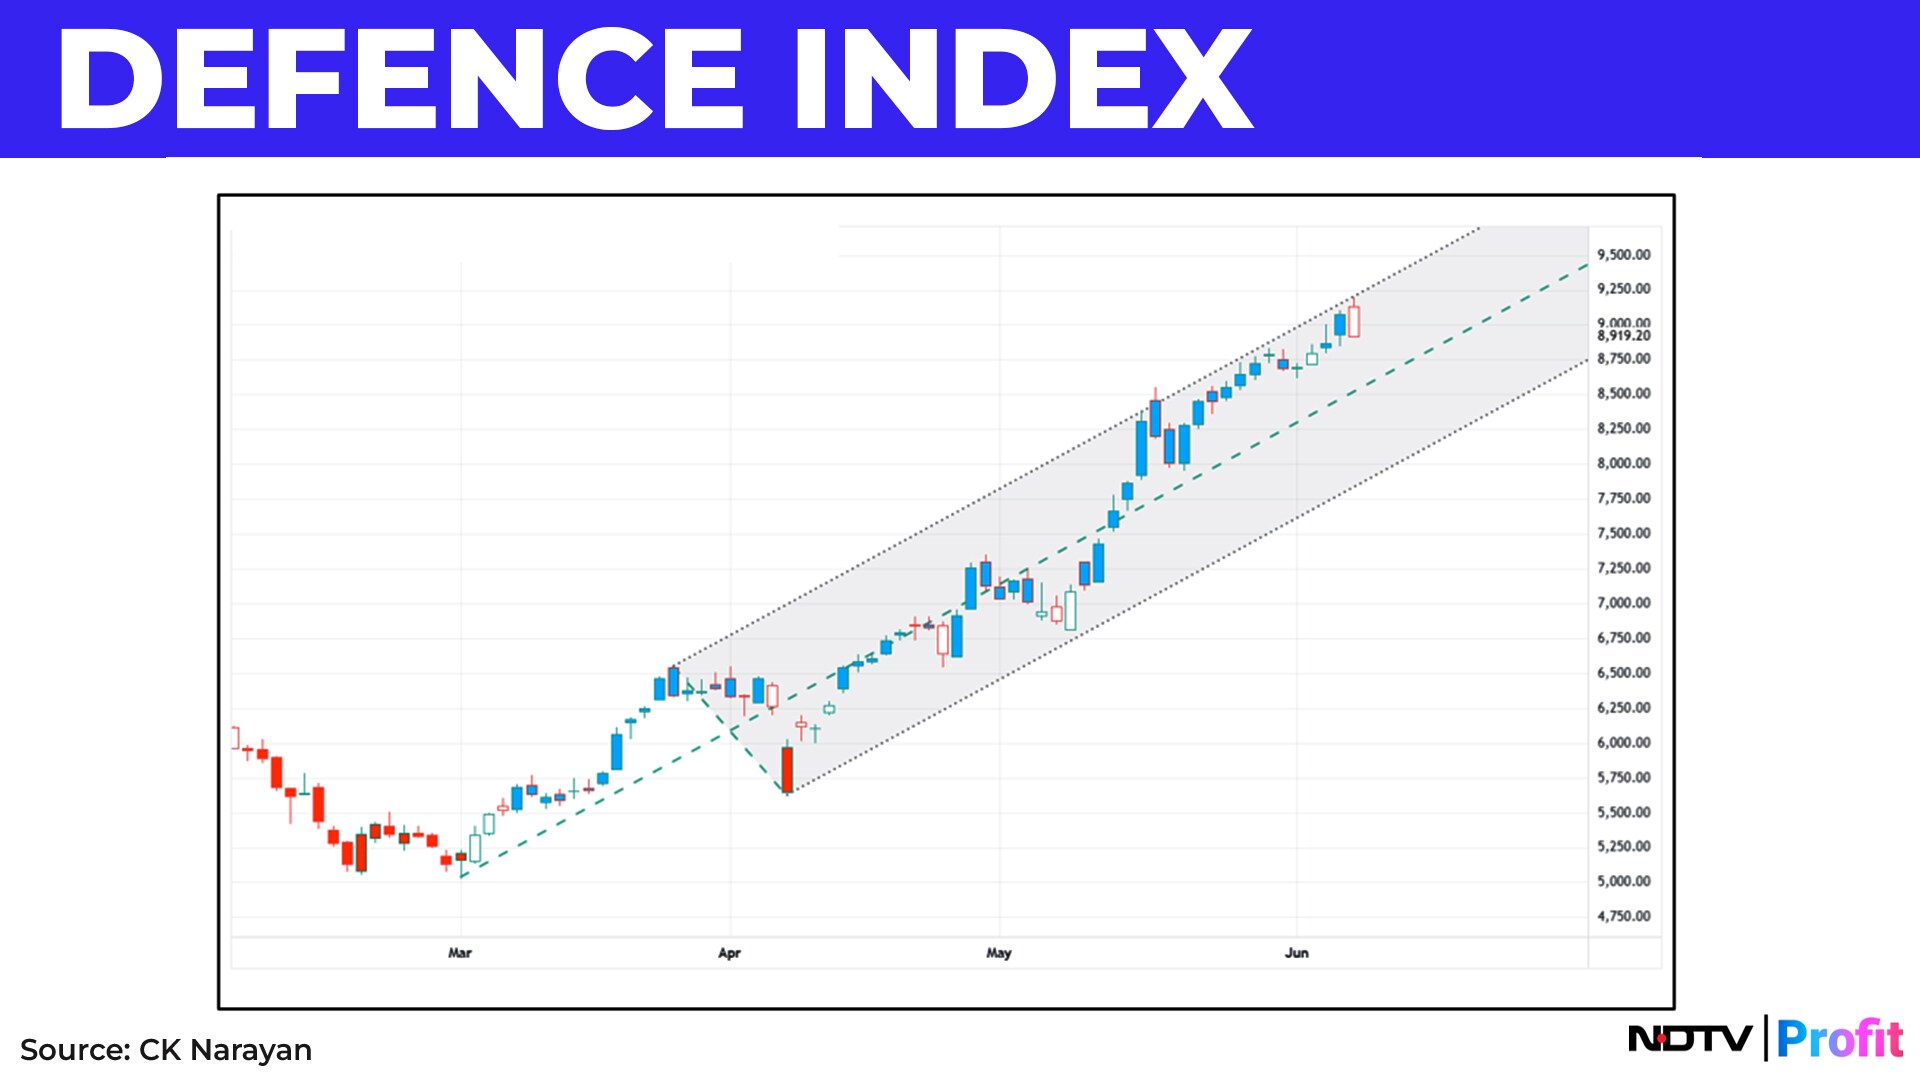
The last time I had shown a chart of the Defence index and how it was at a resistance level and a possible evening star was developing. Well, the buying force continued in it, pushing it higher during the week, overcoming the bearish signals. But it remains in the channel and last week shows a Dark Cloud Cover pattern.
Chart 5. Some bearish candlestick pattern at every high and resistance shows that profit taking is happening even as the prices are being worked higher. Tread carefully and don't get carried away with the noise.
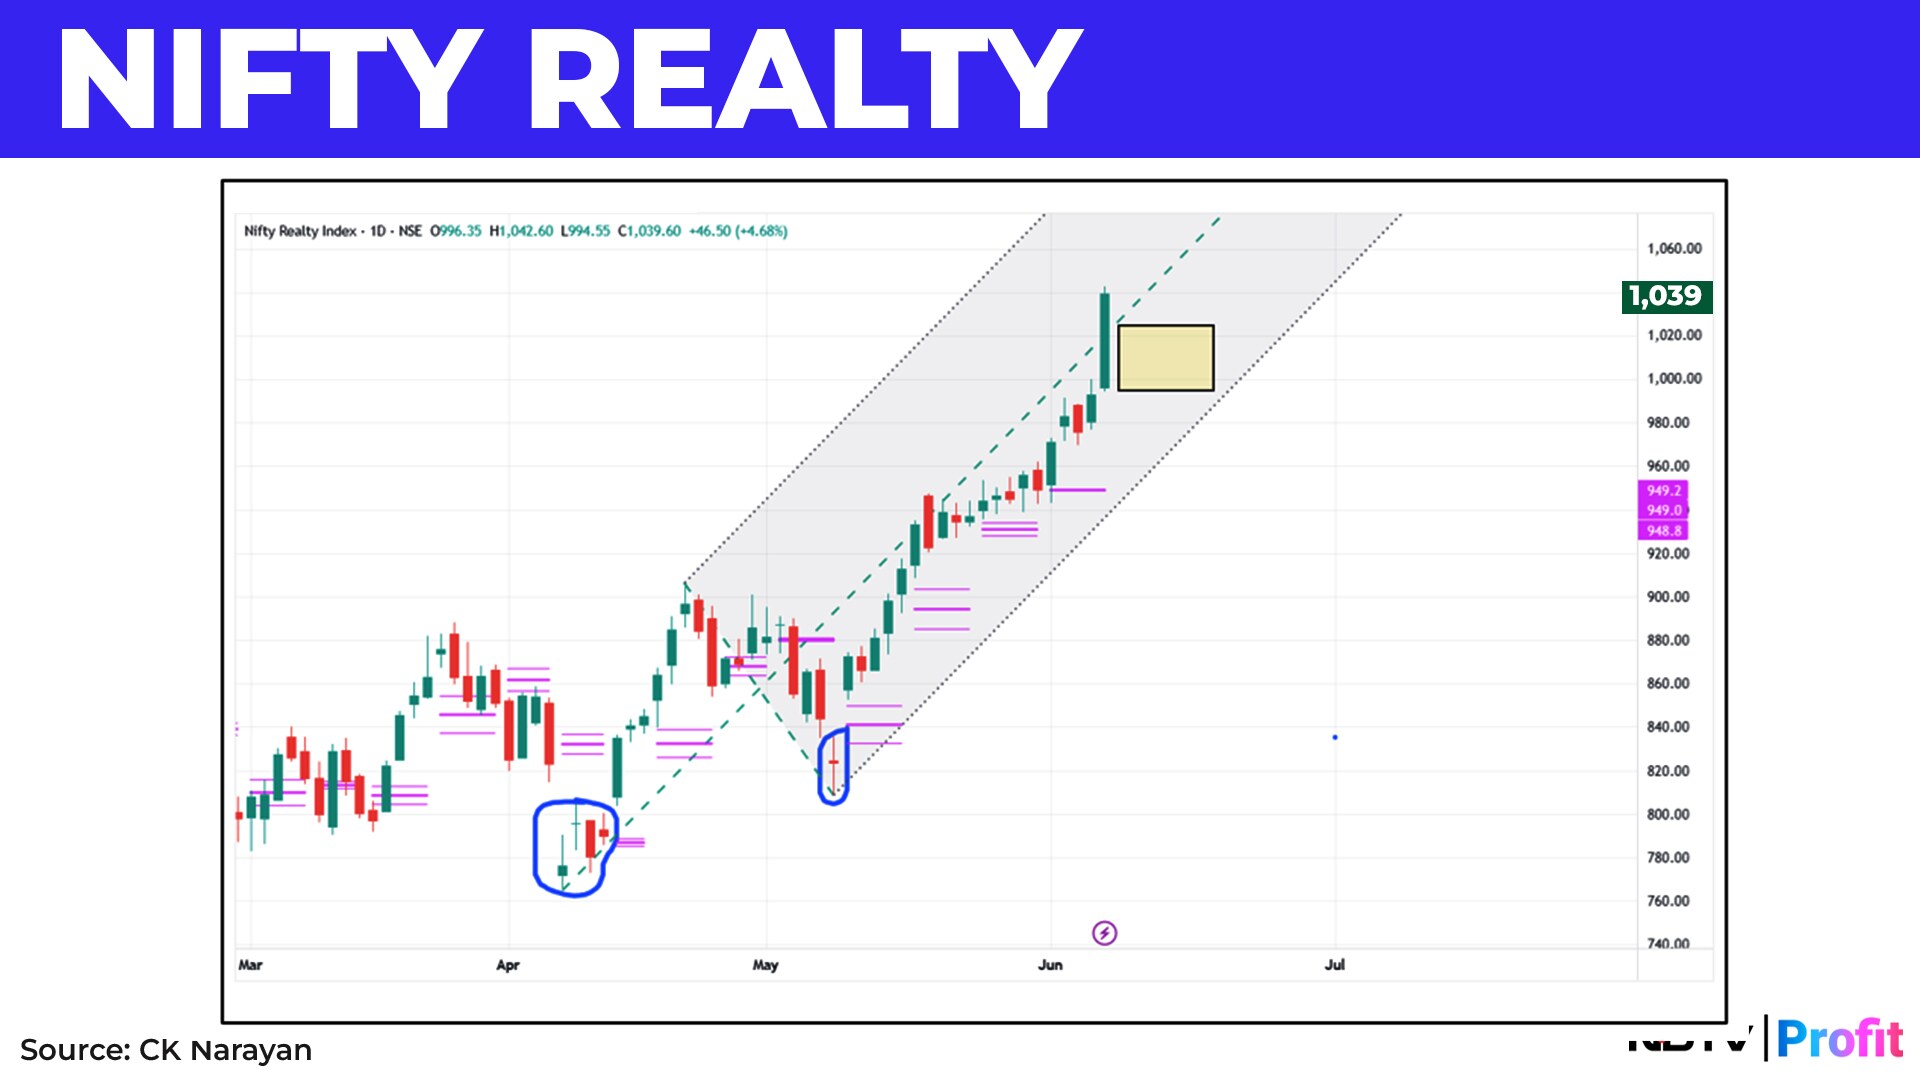
The other rate sensitive sector, realty, has been moving up quietly since the April low but acceleration seems to be setting in now. Chart 6 is daily Nifty Realty index with pitchfork and weekly CPR. The next week's Cpr is projected as a yellow box. It is a wide one and hence we may expect some consolidation in realty stocks rather than a runaway move. Buy dips. Note the two Island formations at the bottom-that seals the bottom for some months ahead.
Summing up, there is enough evidence that we are not going to fizzle out after the RBI event. There are enough sectors in play with some good chart setups for individual stocks. Breadth should widen with an upmove and offer even more opportunities. Swing trading is enabled in the trends now so get out of a pure day trading mindset and look for larger plays and bigger profits. When the times arrive, we should press the accelerator pedal .
Essential Business Intelligence, Continuous LIVE TV, Sharp Market Insights, Practical Personal Finance Advice and Latest Stories — On NDTV Profit.


