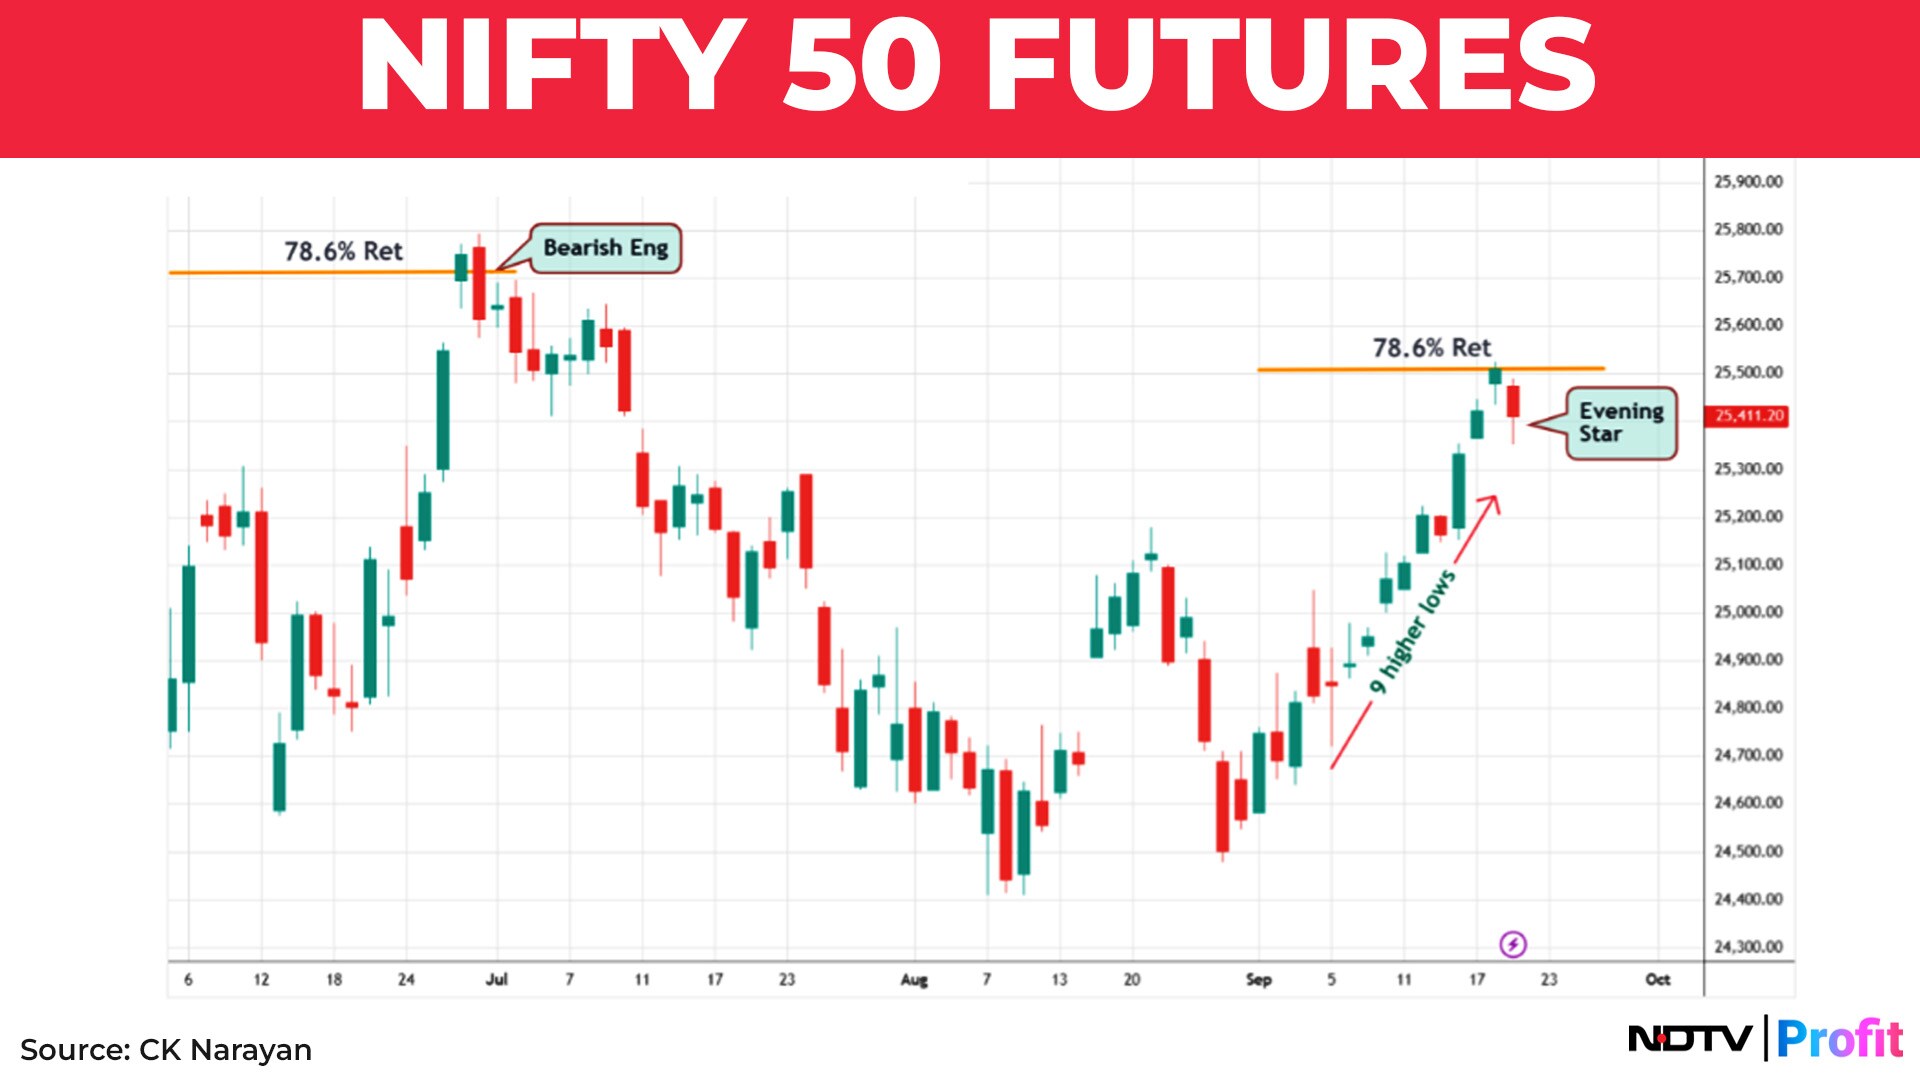
Last week I had shown the weekly chart of the Nifty with the Ichimoku indicator and opined that matters were improving. If one looks at the chart at the end of the last week, there is some improvement on that. So, the view expressed that the tide was turning has been validated somewhat by the market moves so far. We can see in the chart shown here as to why. See chart 1. We have seen a higher low formation for nine successive days on the trot, and almost on all those days, there has also been a higher high compared to the previous day. Suddenly, people discover that the Nifty has actually moved 1000+- points in a matter of 15 sessions!
Had you told them earlier that this would have happened, I doubt if many would have taken that bet- for, the sentiment was quite depressed. But suddenly, we are now challenging the top end of the multi month range (near 25,500) and many have missed this rally! Perhaps day trades in stocks have been engaged and that may have provided some gains as select stocks moved rather nicely. There were three good sessions for the Nifty during the week and the surrender on Friday may be owing to the continued skepticism in the sentiments- despite the 1000-point rally.
I had shown the charts for the sentiment readings in the last week with weekly charts reading Hopeful and daily charts reading Neutral. Well, they remain pretty much in the same place. We get an idea of a similar read from the Ichimoku score reads across different time frames as shown in Table 1.
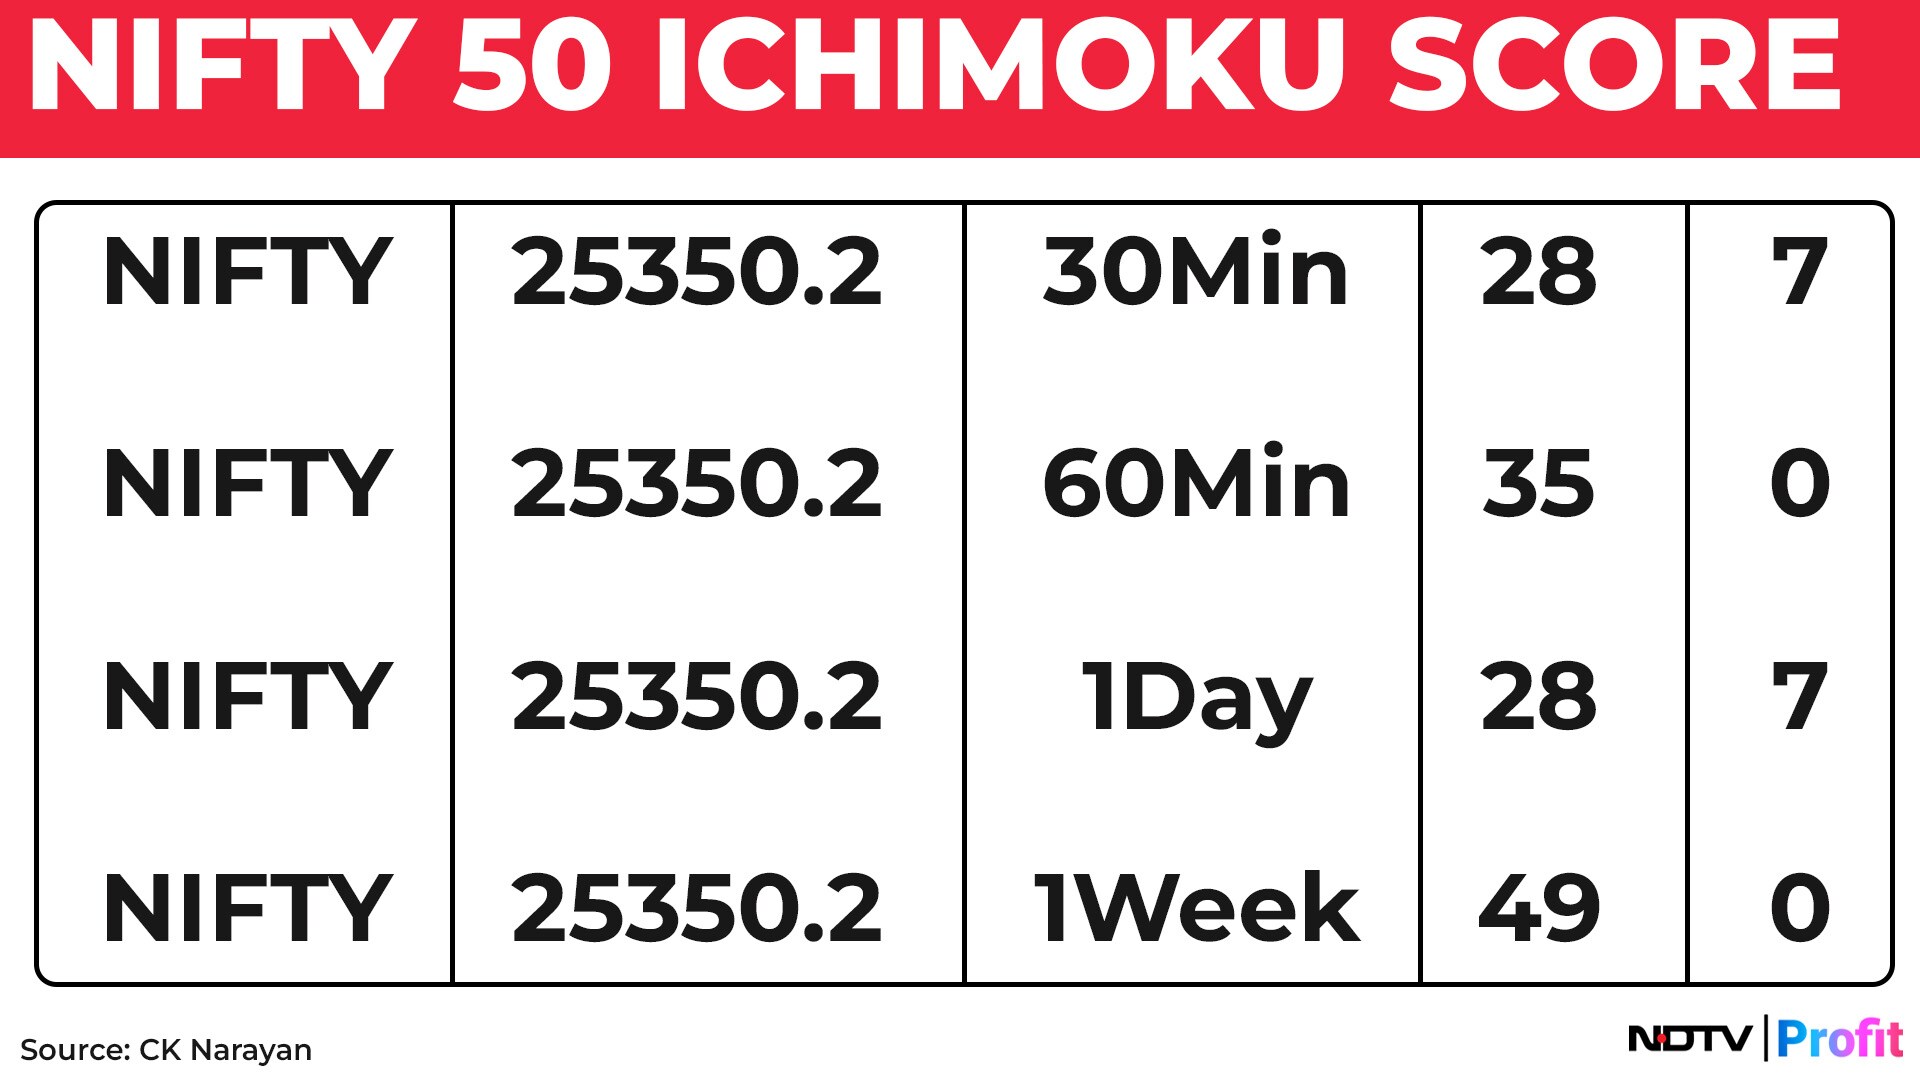
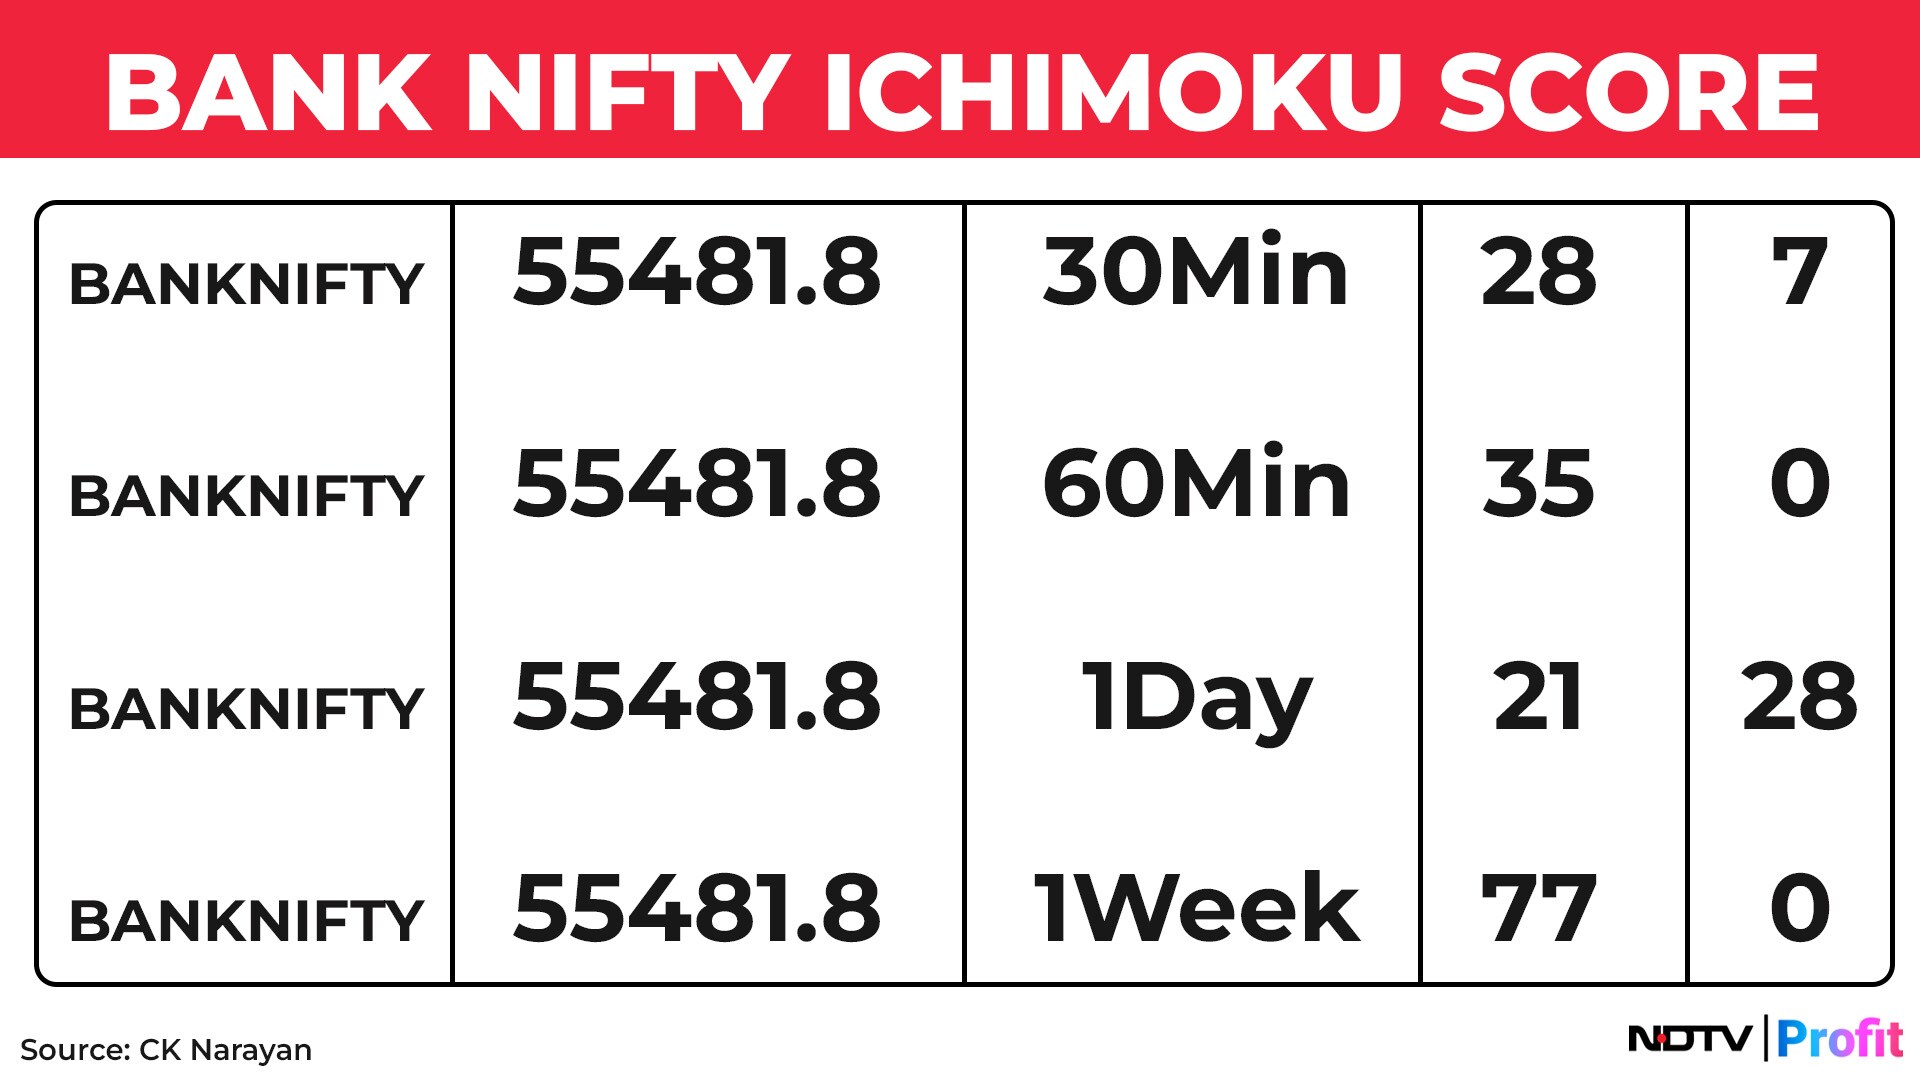
The only continued good news is that the Bear scores remain paltry, and that gives us comfort that the market has managed to digest most of the bearish news and developments of recent times. Now the question is, can the market put together further rallies if there is some continued good news ahead?
During the week gone by, we had the expected rate cut coming through from the Fed. This was the first one in 2025 (after a flurry in 2024), and to make it even better, there is an expectation of further rate cuts to come from the Fed ahead. This will set off new dominoes of its own – the dollar, US 10-year yields, with the latter having an impact on the spread between Indian bonds and US bond yields, etc. Dollar weakness will have an impact on commodity prices and could even lead to INR looking up some. So, a whole lot of macro stuff that will get reflected on different charts in different ways and keep us busy trying to decipher as to how, finally, they can all impact our market trends!
Will all this lead to clarity or more confusion? I don't know.But what I do know is that the weekly charts were poised to improve and the daily charts have improved. Now if they continue to improve in the week or two ahead, then I know what I should be doing in the market. In the last week's letter, I had shown the nearest pitchfork channel. This is what I had written: “Continuation beyond last week would succeed in breaking the channel outward (will happen if prices continue above last week's highs), and that would establish the first of the positive pattern actions within this upmove from the Aug low. It would then enable me to draw a rising pitchfork channel using new price pivots. Let's watch for that in the week ahead.” Chart 2 shows the new pitchfork drawn now.
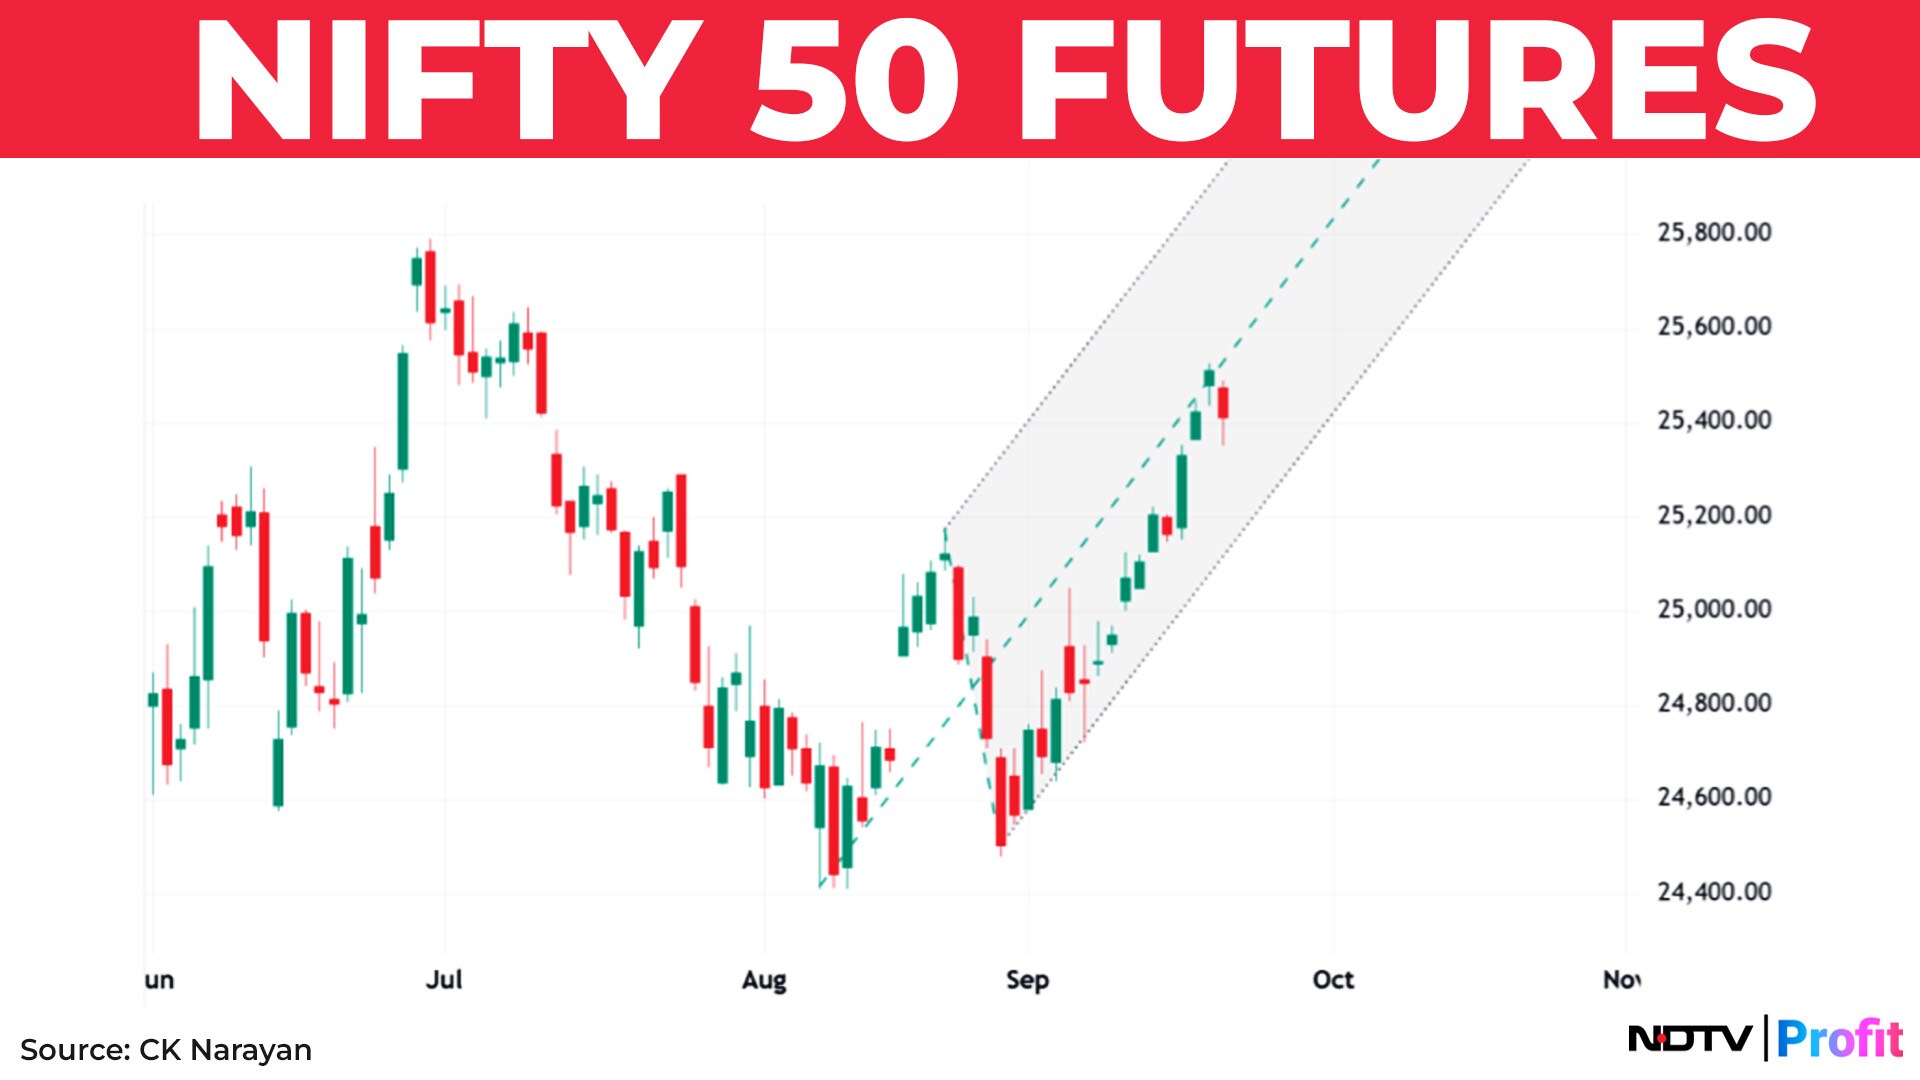
Can there be any flies in the ointment now? Well, look at chart 1 – it shows that the two rallies of recent times – June and Sep – have both retraced 78.6% of the prior declines. At the end of the declines, both have developed some bearish candle patterns – bearish engulfing in June and an almost evening star now. Prices have traded down on Friday, breaking the trend of a nine-day run. In chart 2, we can note that the rally (tracked by the new pitchfork) has moved to the median line, and Friday's trading is placed beneath it.
Measuring some time cycles, I find a consensus in time counts emerging in the coming week. These are from three different price pivots – the all-time high of Sep 24, the intermediate bottom in Mar-Apr 25 and the recent swing high of Jun 30. So, we would be running into a time cluster in the coming week. Importantly, as we saw above, we are also showing some resistance-based price signals.
Can the two combine now to produce some reversal actions? Perhaps. I mention this so that we can be ready for action on that basis. The new pitchfork shows us that the lower channel is now around 25,150, and hence a trailing stop can be placed there. Monthly option positions are also poised around the range of 25,000 (puts) and 25,500 (calls), augmenting the stop-loss level but at the same time warning us to be alert for continuation higher, as that could bring in a flurry of short covering.
Typically, rate cuts in the US have been followed by money flowing into emerging markets. Will that happen again? So far, we have seen continued selling in equity by FIIs, but they did cover shorts in index futures. See chart 3.
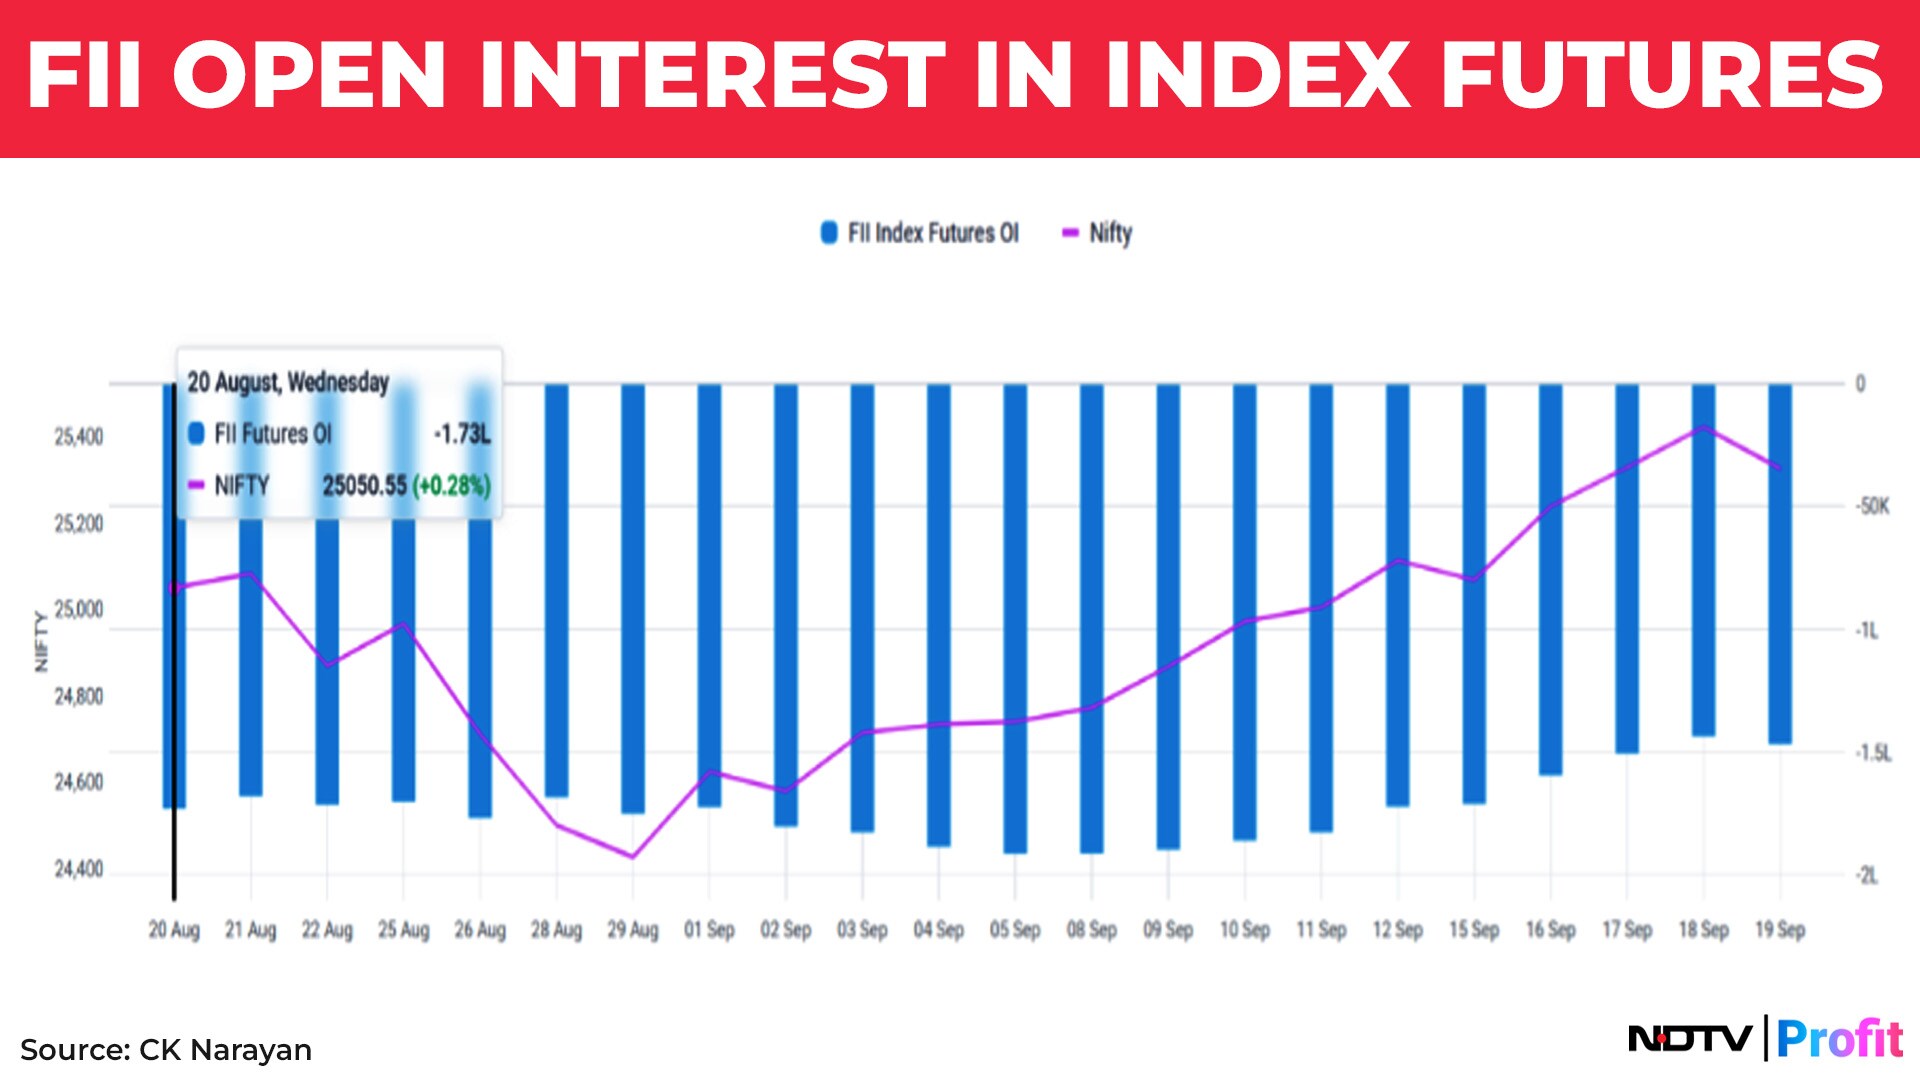
Over the past few days, this improved from around 2.05 L contracts short to around 1.50 L contracts short. Decent number. What we need to see is that this trend should continue, and then it can drive uptrends in the Nifty as well. What we don't want to see, for sure, is an increase in the shorts ahead. Alongside, if we get some positive figures for FII cash buys, then the sentiment can get repaired a lot more swiftly. A small niggling worry here is also that the Pro positions in the index have shown a decline in trends during the recent eight sessions or so. Many times, their positioning is ahead of emerging trends.
So, there we are then. Markets are well poised, mounting a challenge on the 25,300-25,500 band resistance. Bad news seems to have been taken in stride, and now we await whether some good news can produce fresh upside triggers. FII short covering in the index has commenced, and we need to see a continuation of this. Alongside, buying in cash would be an added fillip. Small misgivings exist, like resistance points reached and some time clusters coming up. The way the market handles these will give us a clue about how it is set up from within.
Crossing 25,600 would be the first hurdle for the week. If so, we can then look at 25,760 and finally 25,920. Declines are likely to terminate near the 25,100-25,000 levels now.
CK Narayan is an expert in technical analysis, the founder of Growth Avenues, Chartadvise, and NeoTrader (https://neotrader.in), and the chief investment officer of Plus Delta Portfolios.
Disclaimer: The views and opinions expressed by experts and investment advisers on NDTV Profit are of their own and not of NDTV Profit. NDTV Profit advises users to consult with their own financial or investment adviser before taking any investment decision.
Essential Business Intelligence, Continuous LIVE TV, Sharp Market Insights, Practical Personal Finance Advice and Latest Stories — On NDTV Profit.