


Just when it was appearing all bleak and gloomy, the market pulled out a surprising move during the week. The Iran-Israel war news was consumed with just one day of weakness (seen last Friday) and although it took a while to work its way up, the market did make the effort and succeeded in recovering much of the ground lost. Inter alia, it also did a retest of the levels of last Friday highs and then hauled itself up. Chart 1 is a continuation of the chart shown in the last week.
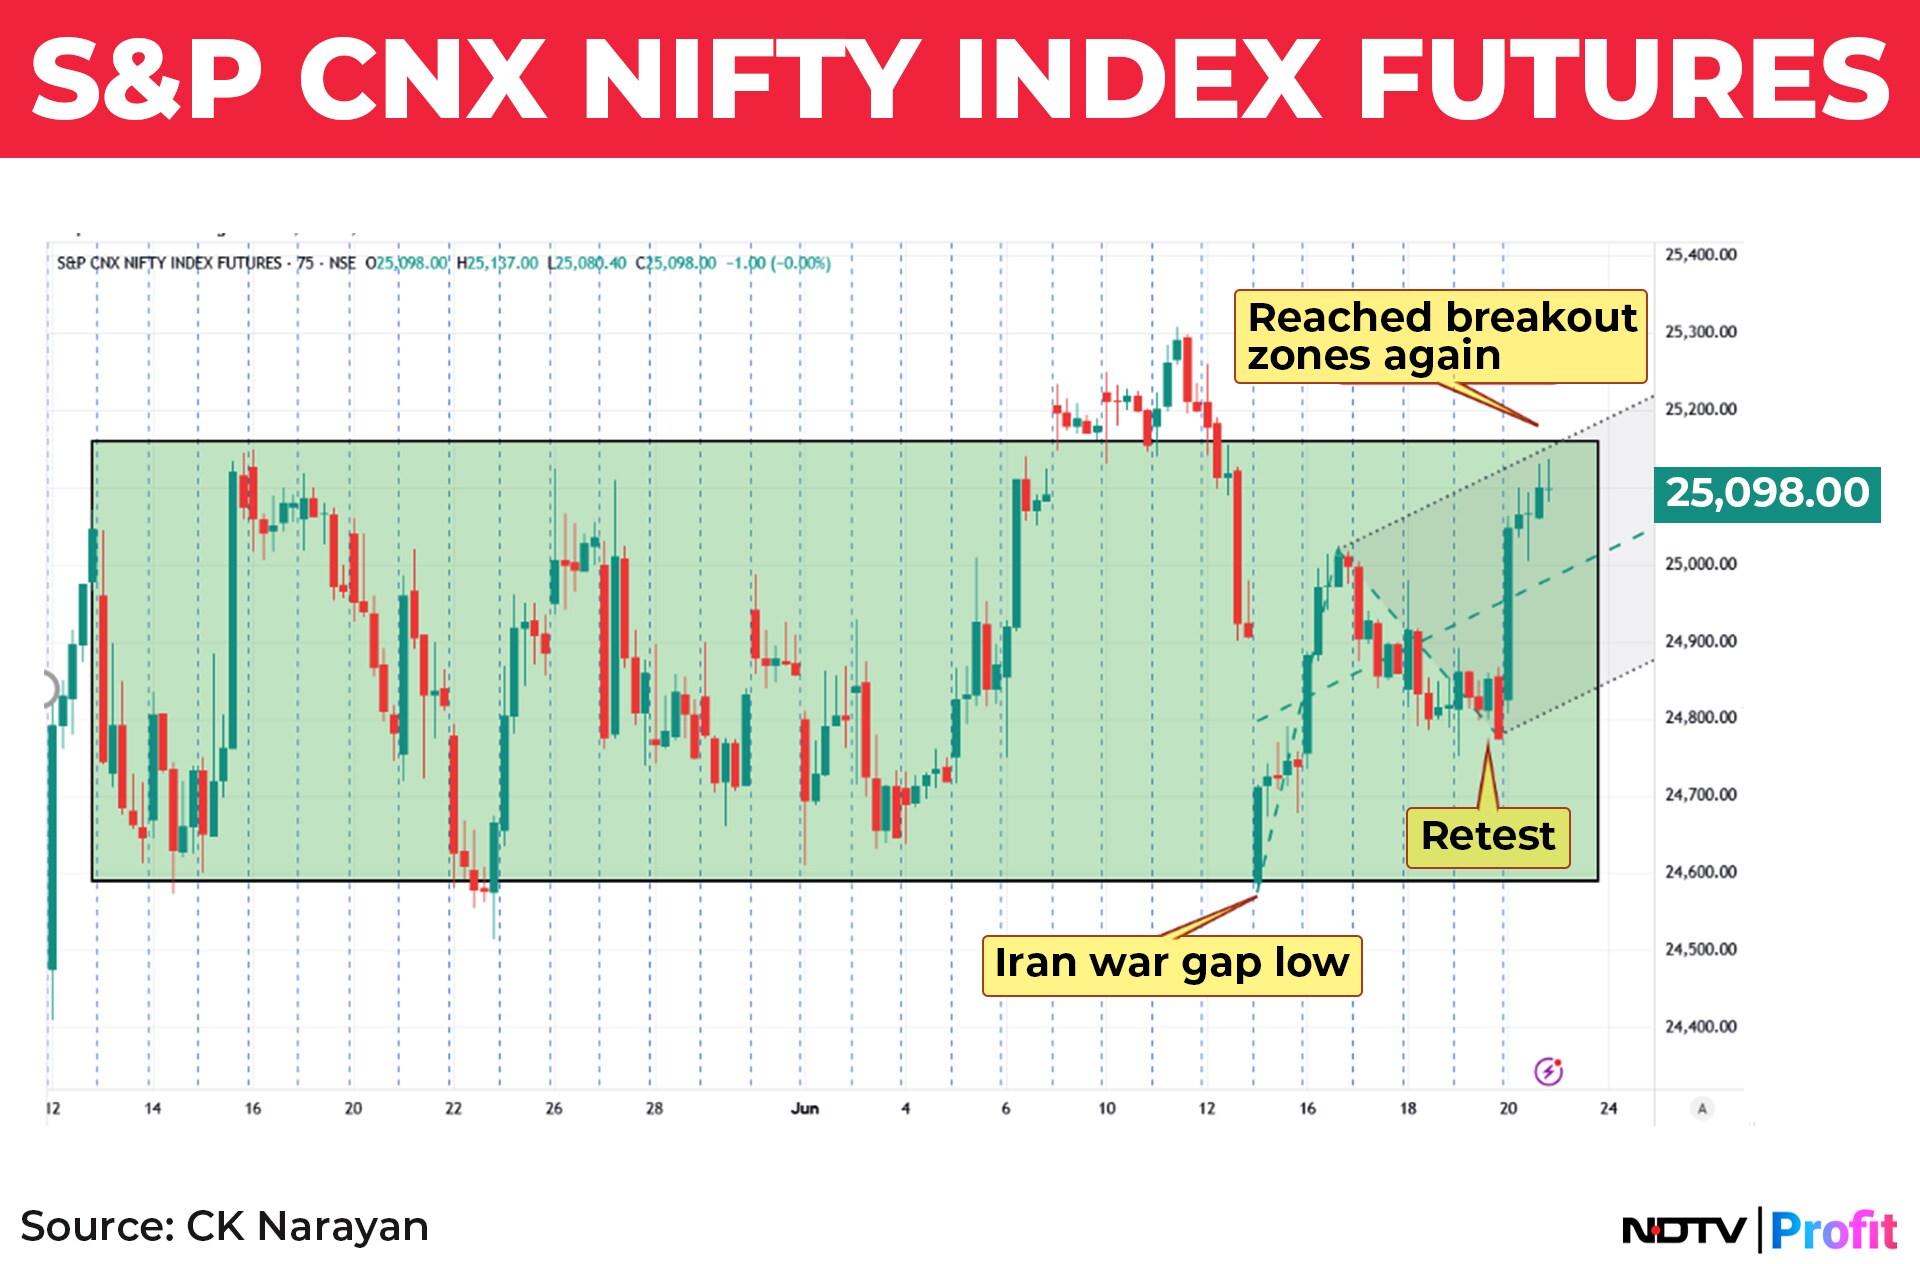
I have shown a pitchfork channel for the rise and we can note that the upper channel is reached. This high is also the 78.6% retracement and it is at the top of the recent consolidation at 25,100.
That means that a follow through action to the upside is now "a must". This is the area from where the index got pushed down the last time which culminated with the Iran-Israel war gap. This is if a continuation has to be built. Failing which, we will continue the consolidation.
In general, every directional trader hates a consolidation. Mainly because it is difficult to trade or take advantage of. But options guys remain very happy. June has so far been happy hunting ground for them. Despite some sudden surprises, the IV didn't get jerked around and that helps them the most as premiums climbed up some but got crushed as the week was unwound.
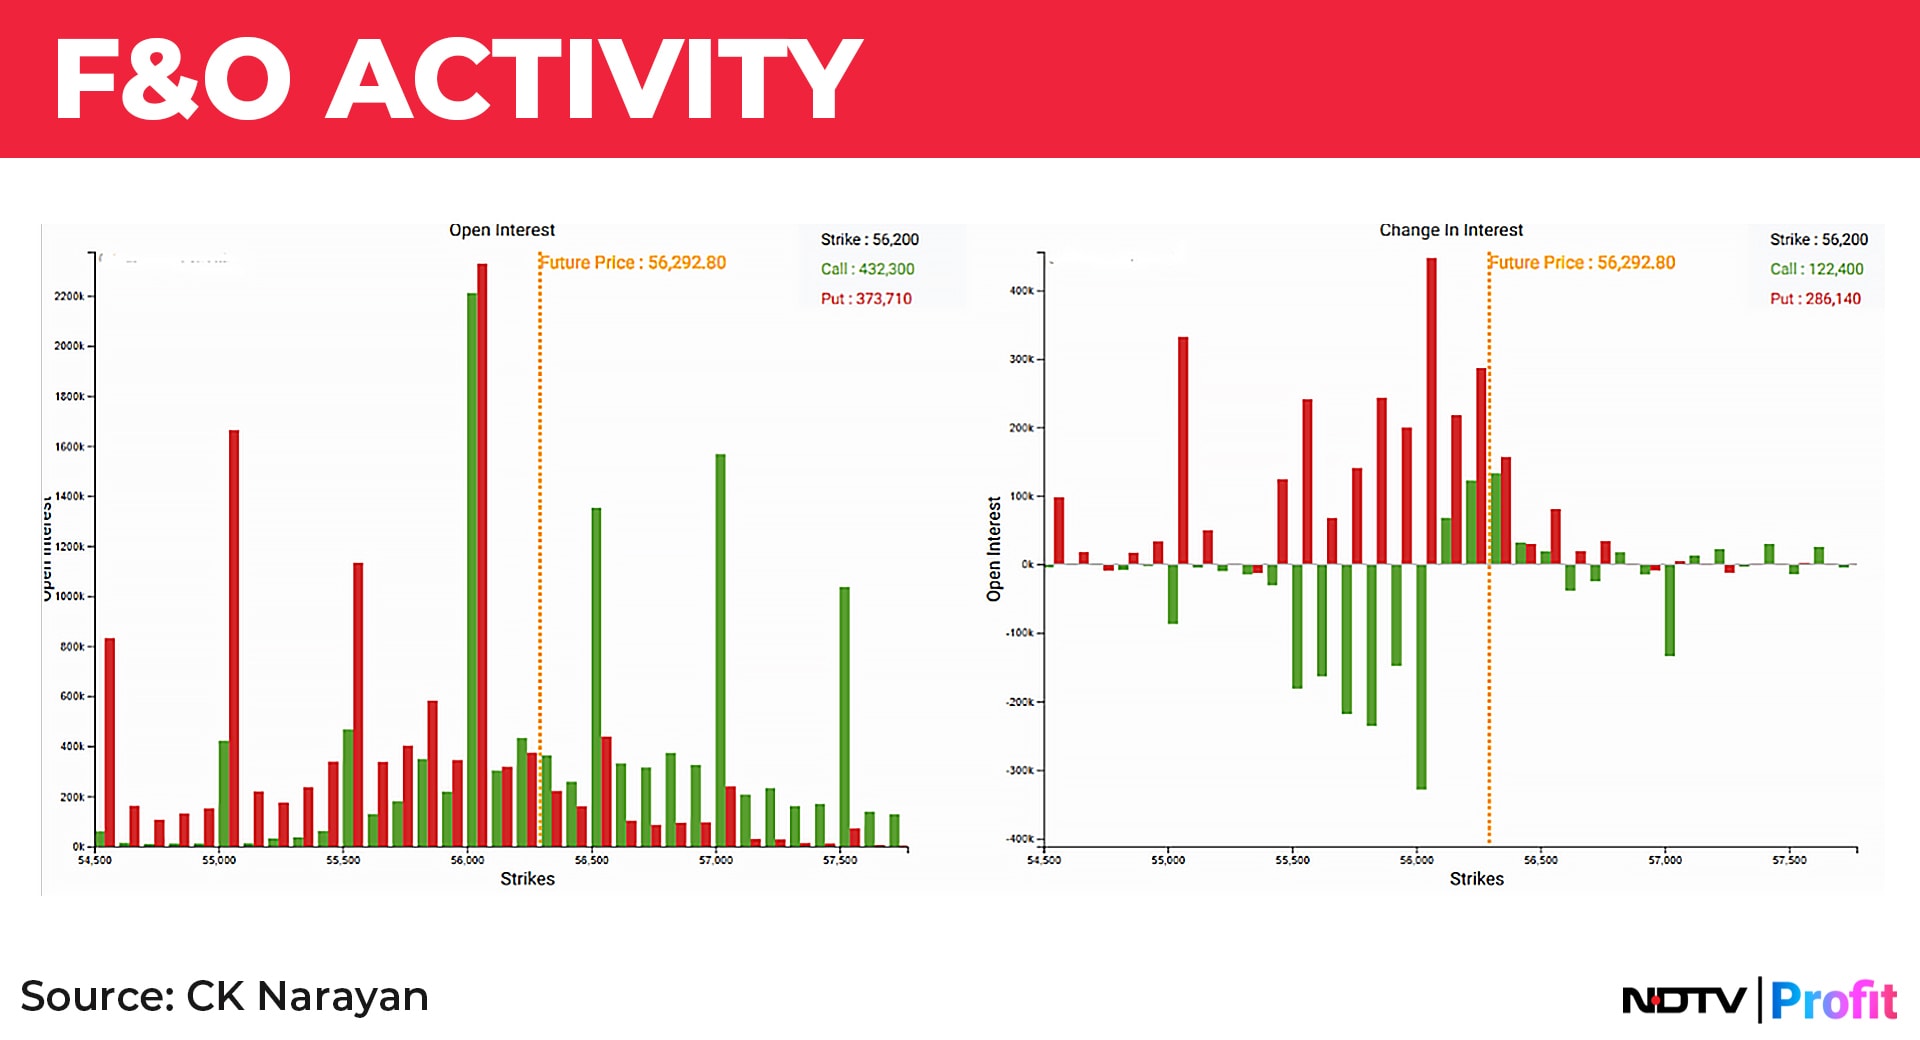
On Thursday, when the market fell, it looked pretty worrisome. The Nifty future was threatening the recent support swings near 24,650, the Bank Nifty future had surrendered substantial ground to hit the intra week supports at 55,600 area, the Mid and Small cap indices took a sharp knock, slipping into a lower-top-lower-bottom pattern. There was a large Put short position at the 56000 strike and a large bunching of short calls in both the indices. All of these collectively seemed like some formidable resistance build up. But the market picked itself up on Friday and appears to have decimated quite a few of them on Friday.
Hooray and all that, but while we may seem ingrateful, we do need more from the markets to get out of the damn range and get going once again. The Bank Nifty did a decent job, rising from the support zone and covering strong ground to finish well above the big sold Put area. That deserves a high five for the bulls. No mean feat in these circumstances. And option traders being a savvy lot, switched quickly to short Puts once again. All this can be seen in chart 2. The largest position is still at 56000 strike and hence that continues to be the main fulcrum for the BNF for the coming weeks.
The daily picture in the Bank Nifty got restored promptly, even if the highs are yet some distance away. See chart 3.
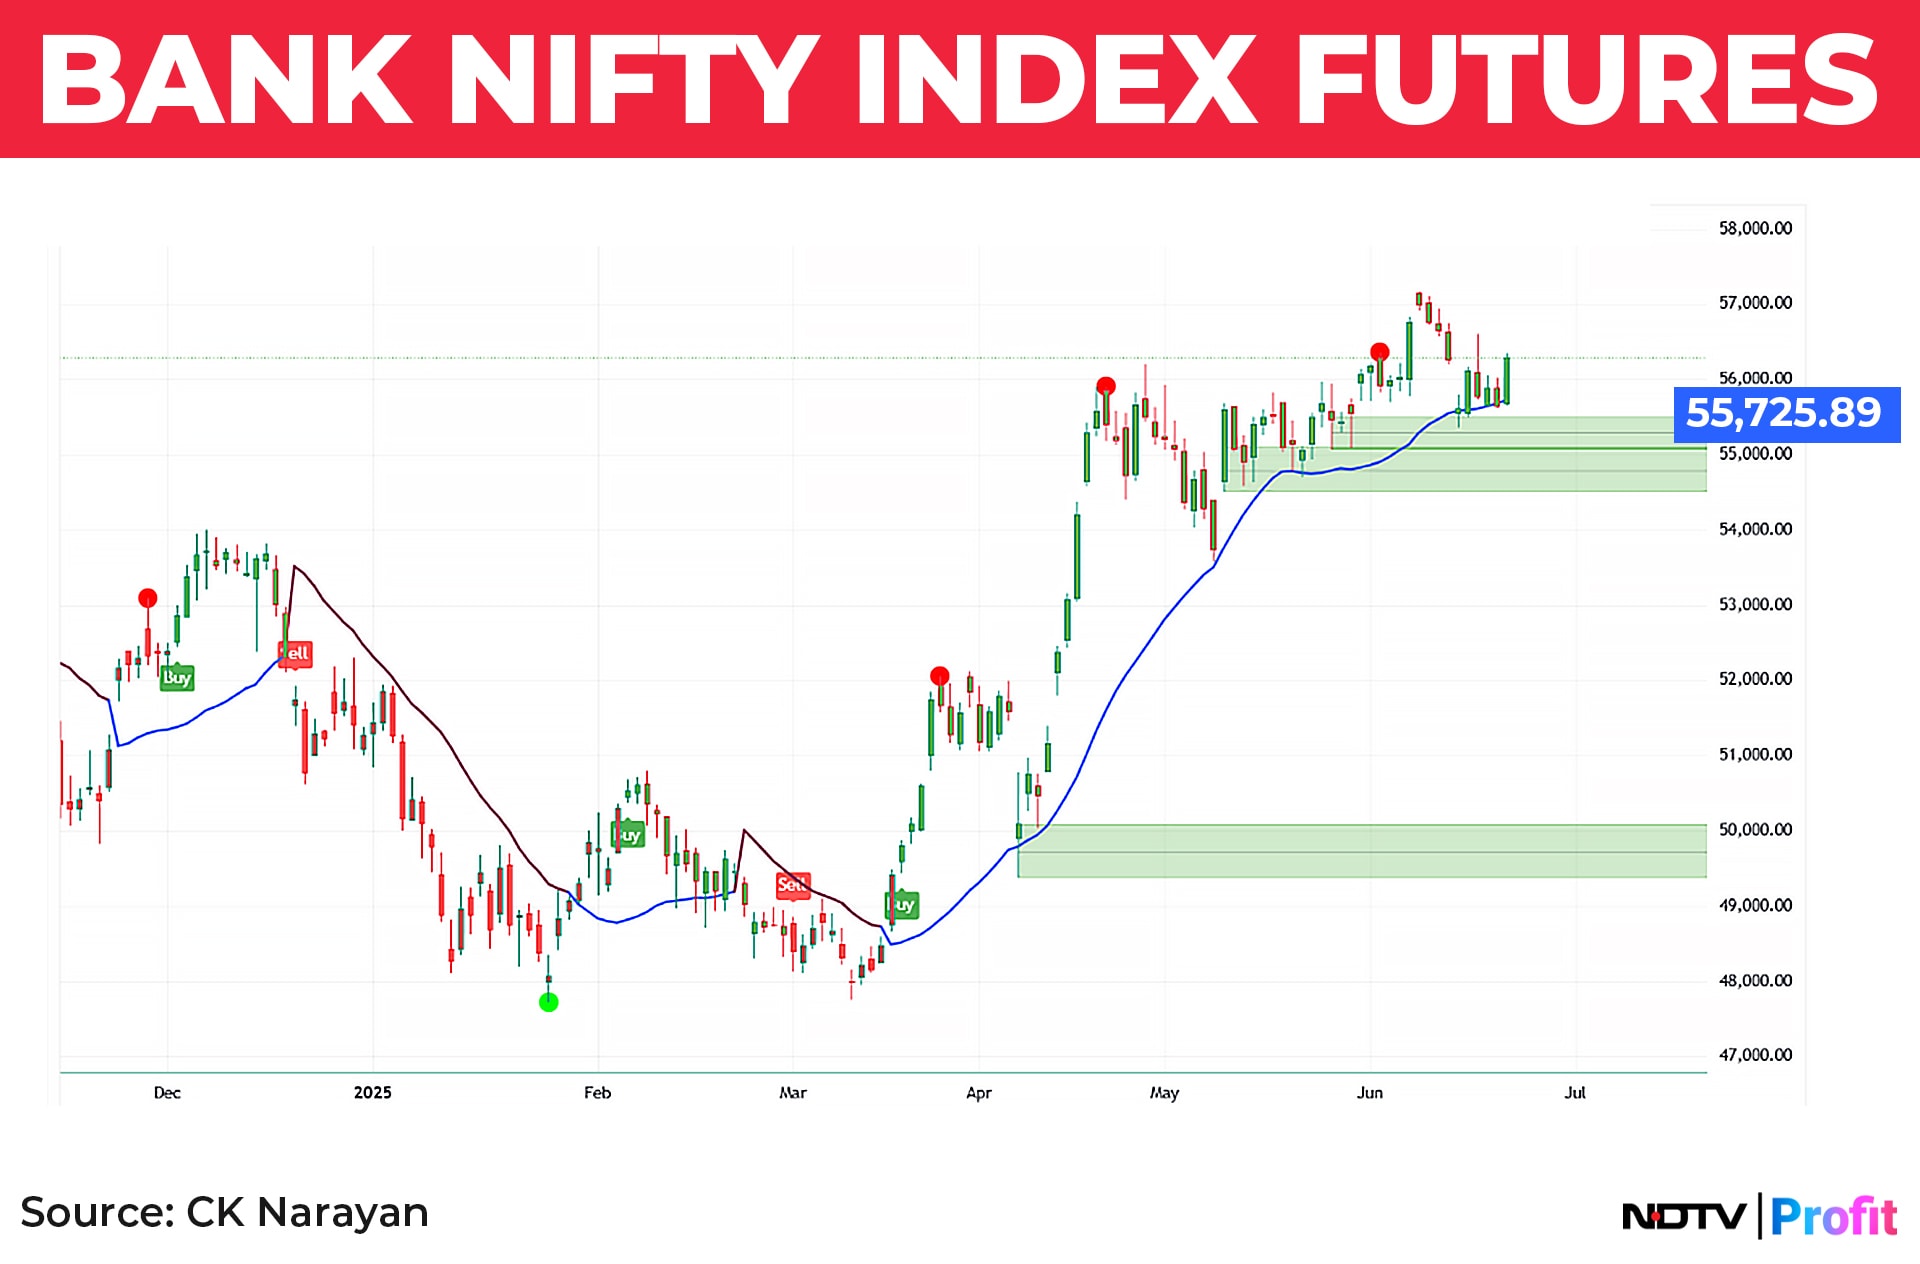
The Gann trend tracker average acted once again with great precision and the strong volume demand area provided support at the very first level. The long term Buy signal issued way back in mid-March 2025 still remains intact despite decent pullbacks and Friday's candle is a nice move out of a tight consolidation.
When a counter is in the grip of bulls, one should develop the faith in the with-the-trend signals, using them to add. I agree that last week's fulminations did test our resolve but that is how the market is. But remember also this: when you go for a long pull trade, you have to give the stock room to breathe. In the case of the BNF here, this was about 1000-1500 points! If this is not part of your trade plan then you won't be able to handle it. That is why I often say that day trading is so much easier than positional plays. The latter really tests your resolve and discipline.
The Nifty futures hasn't exactly been a slouch either. Chart 4 shows the daily chart with the buy signal of April 15 still intact. No doubt, the consolidation at the highs over the last couple of weeks was difficult to handle but the chart shows that the trend remained undisturbed. The oscillator signal that coincided with this price action signal is also intact despite the consolidation. This oscillator (an RSI type variant created from the Williams %R) is actually an aggressive oscillator but even that could not be tripped up. (I like trying out creating modification of standard oscillators because everyone is using the standard ones). In this one, I will be worried only if the 50 level gets busted, for that will indicate a weakening of the trend.
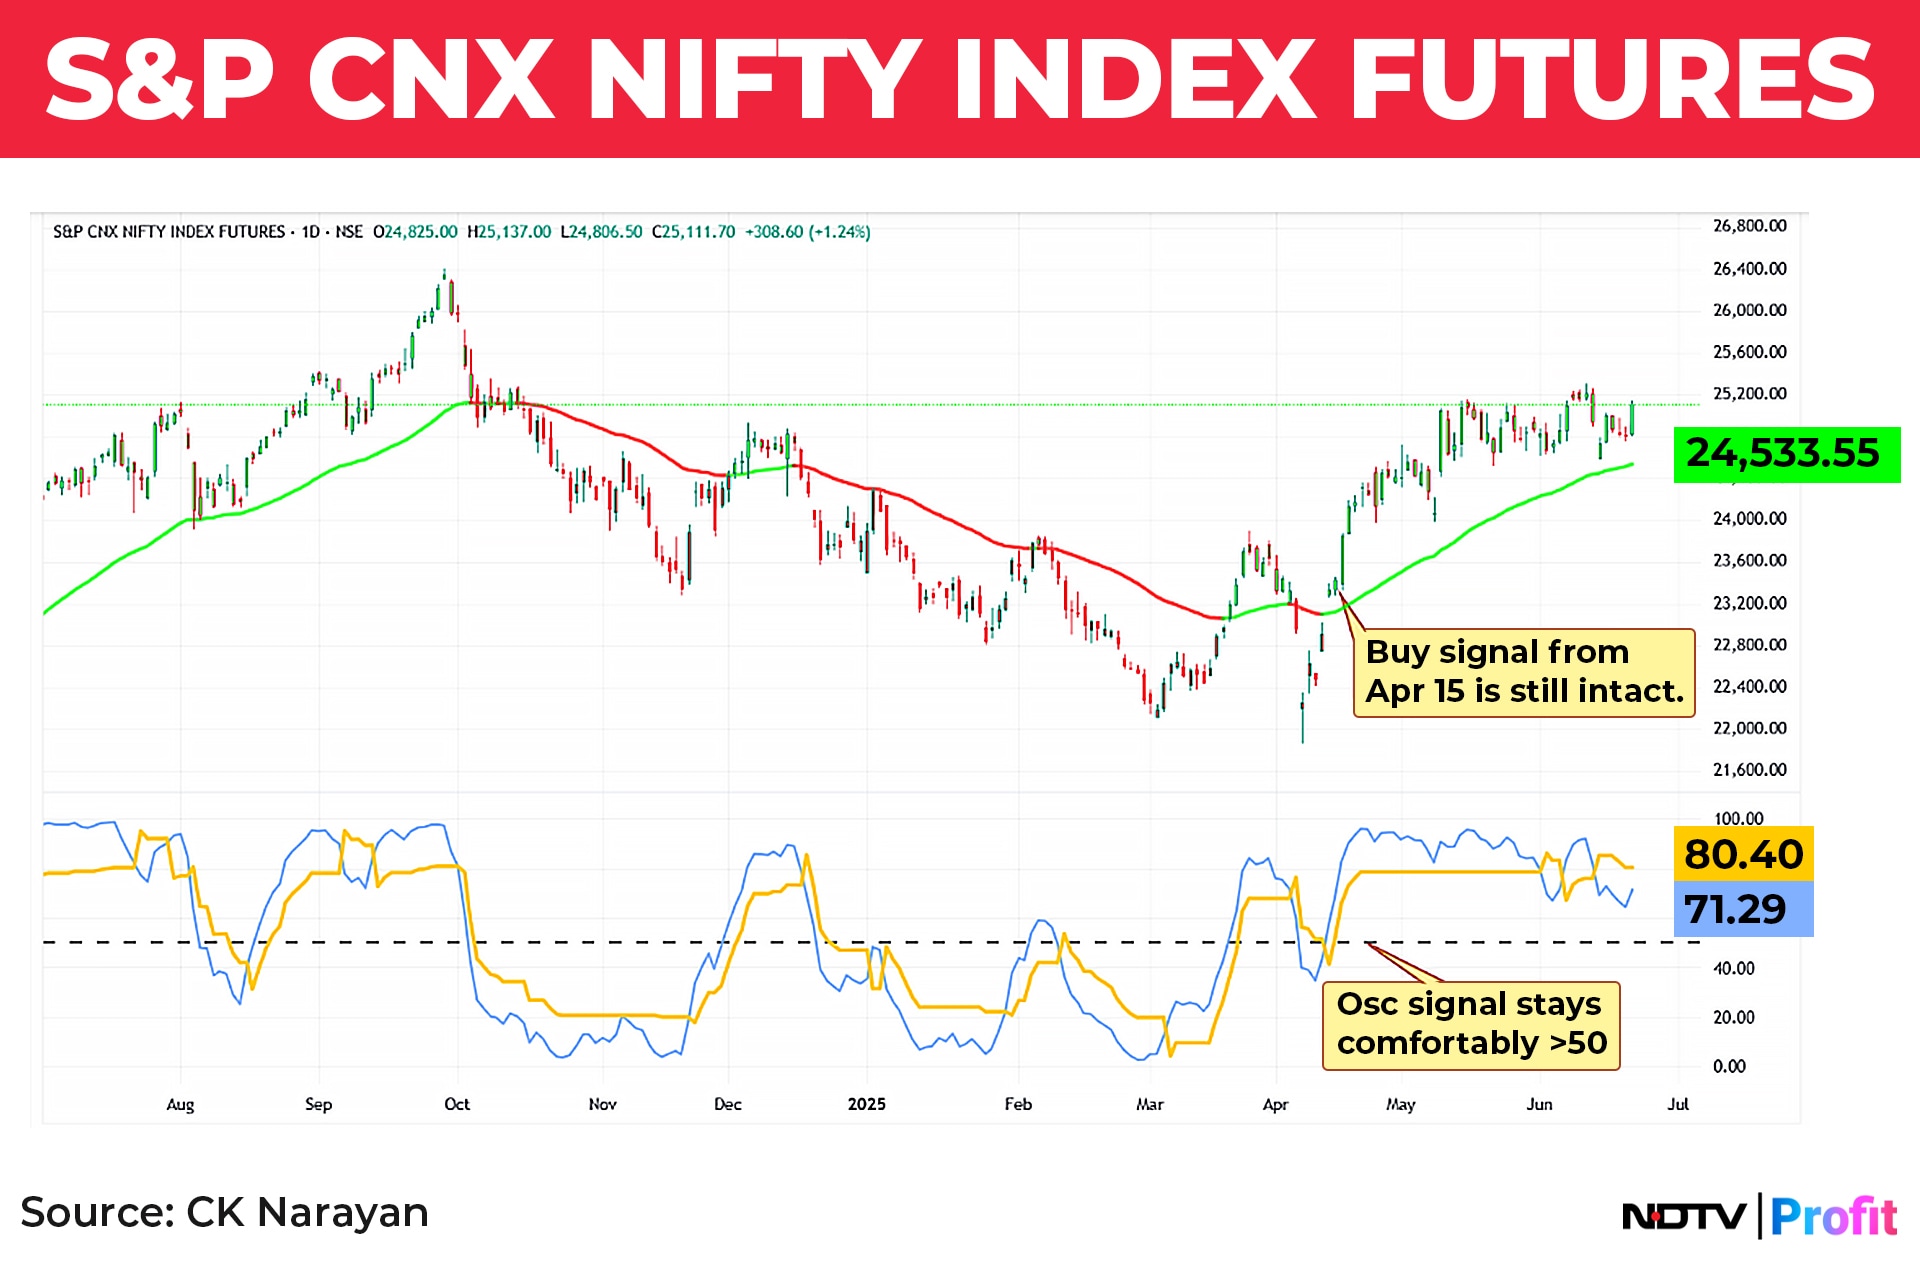
In the Bank Nifty chart, this signal is even better placed than in the Nifty!
So, we have a situation now where both the major indices have staged a recovery. Both need to continue further in the coming week else it will become yet another disappointment. Let's leave it there fore the moment. 24850/55800 can be kept as trailing stops for now.
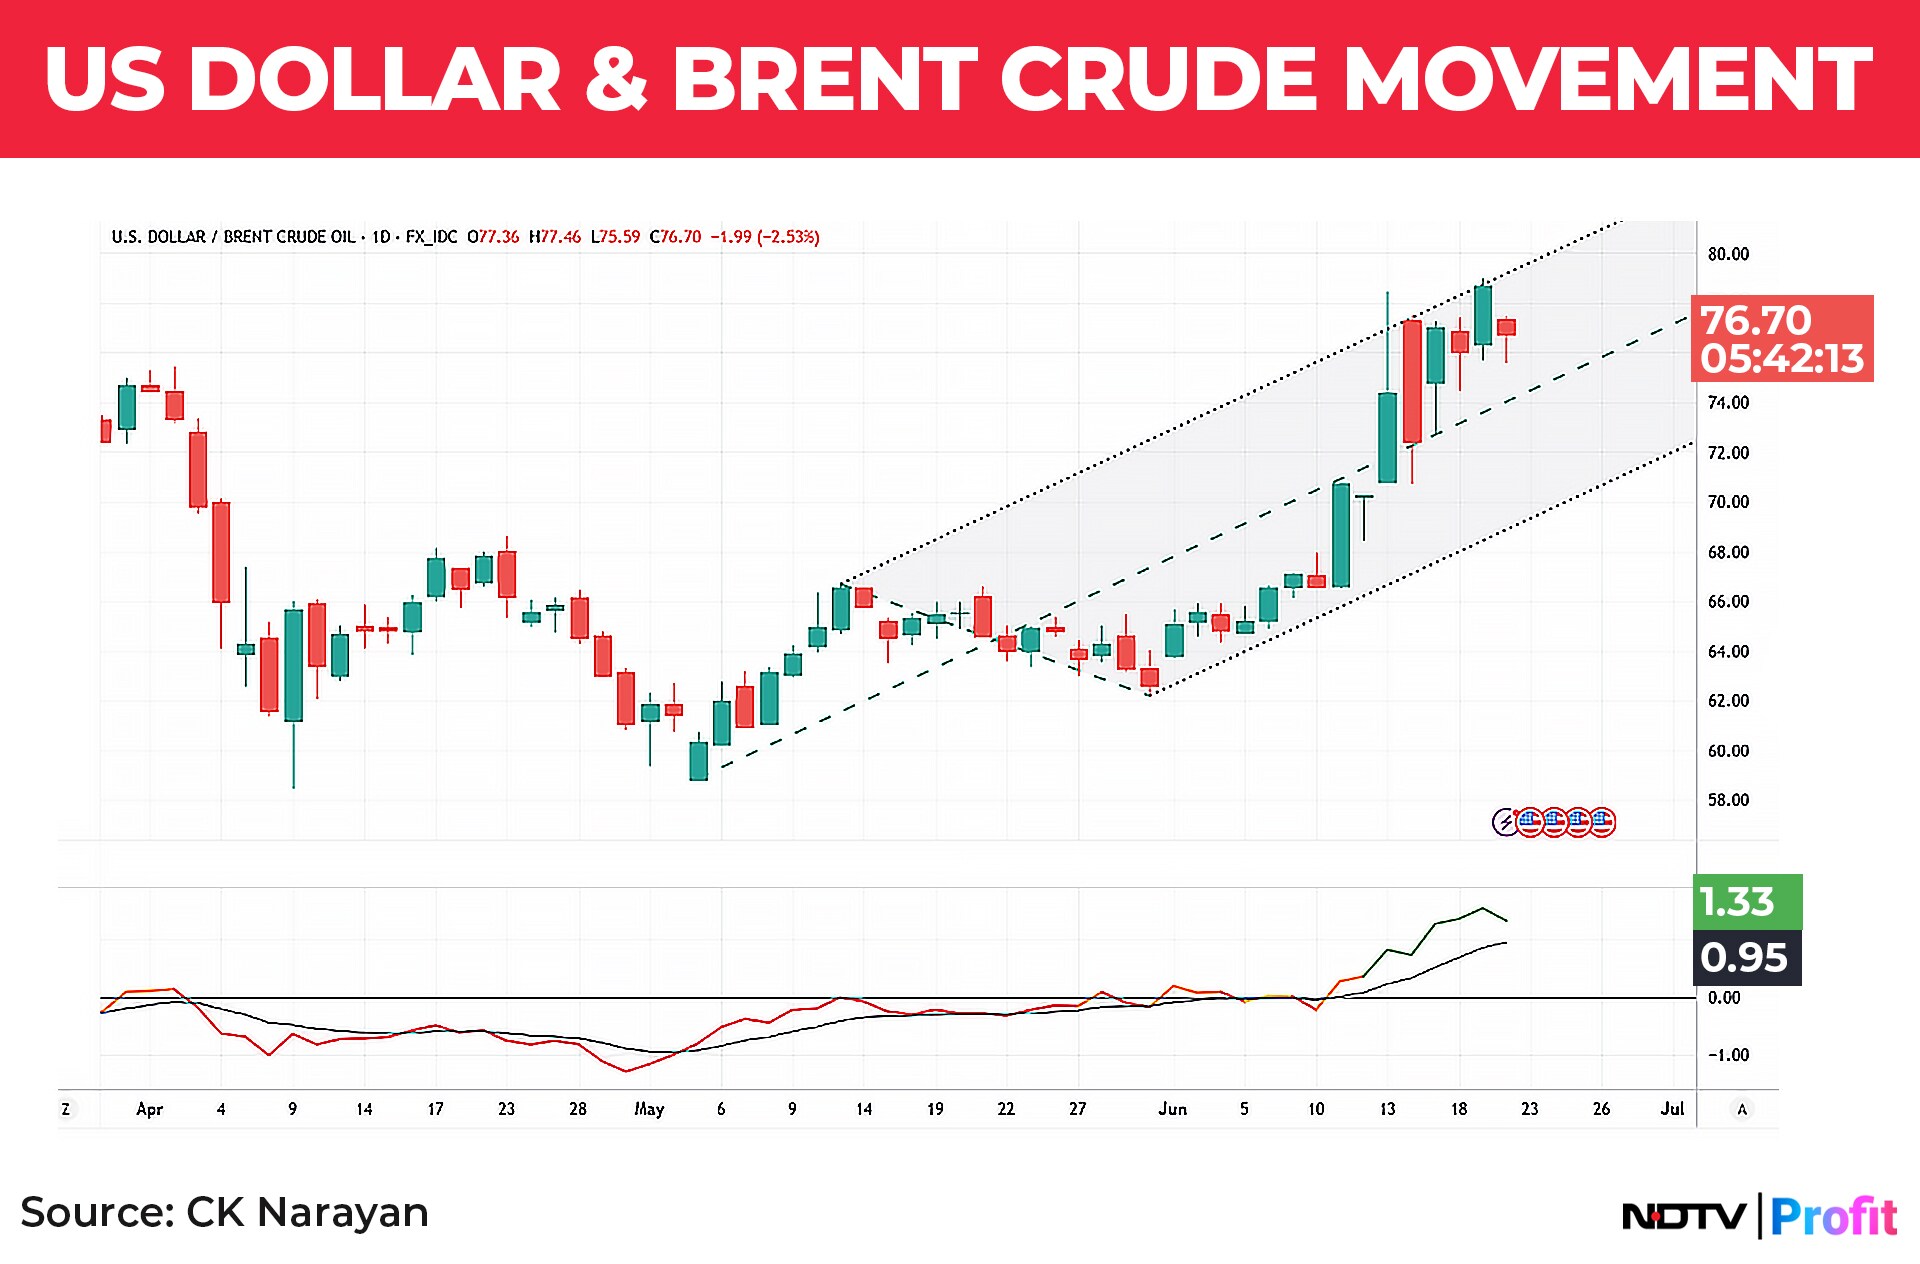
Since the war is the main talking point, we have to address the situation with respect to the Brent chart. On the day the war commenced, it shot up to around $79. It fell back to near $70 and we saw it remain in this range across the week. Now, that has become a new reference range for traders in India. From what I hear and read India should be okay with Brent prices rising to even around $80 but sustaining above those levels may cause difficulties. But there are statements from IAEA that there is enough supply of oil available and that has calmed the sentiments a bit. However, oil markets remain the most sensitive commodity as far as geopolitical tensions are concerned and hence this is a chart that one needs to keep track of into the near future. The situation there is fluid and difficult to say what may happen. Will it drag on, like the Ukraine-Russia war or will if finish quickly? If it drags, the trends may get impacted some as Iranian oil supply is a critical element. If it ends quickly then it will be a big positive because everyone else can get back to their work and volatility can die down.
The Brent chart (no. 5) shows that prices are captured within a pitchfork channel and hence there are chances that it may pullback some. But momentum pick up on this rise is high and so, it is not going to die down just yet. Maybe prices may trudge along the median line? If it does, then it will be a slow grind higher and probably occur on the war dragging on. Ideal will be if it breaks down into the lower portion of the channel.
Dollar has slipped below 100 levels on the Dxy chart. This continues the ongoing weakness in the greenback. Chart 6 shows possible targets ahead. Weak dollar suits Trump just now as he struggles to kickstart the US economy. It also helps in negotiating with other nations at the moment for the US.
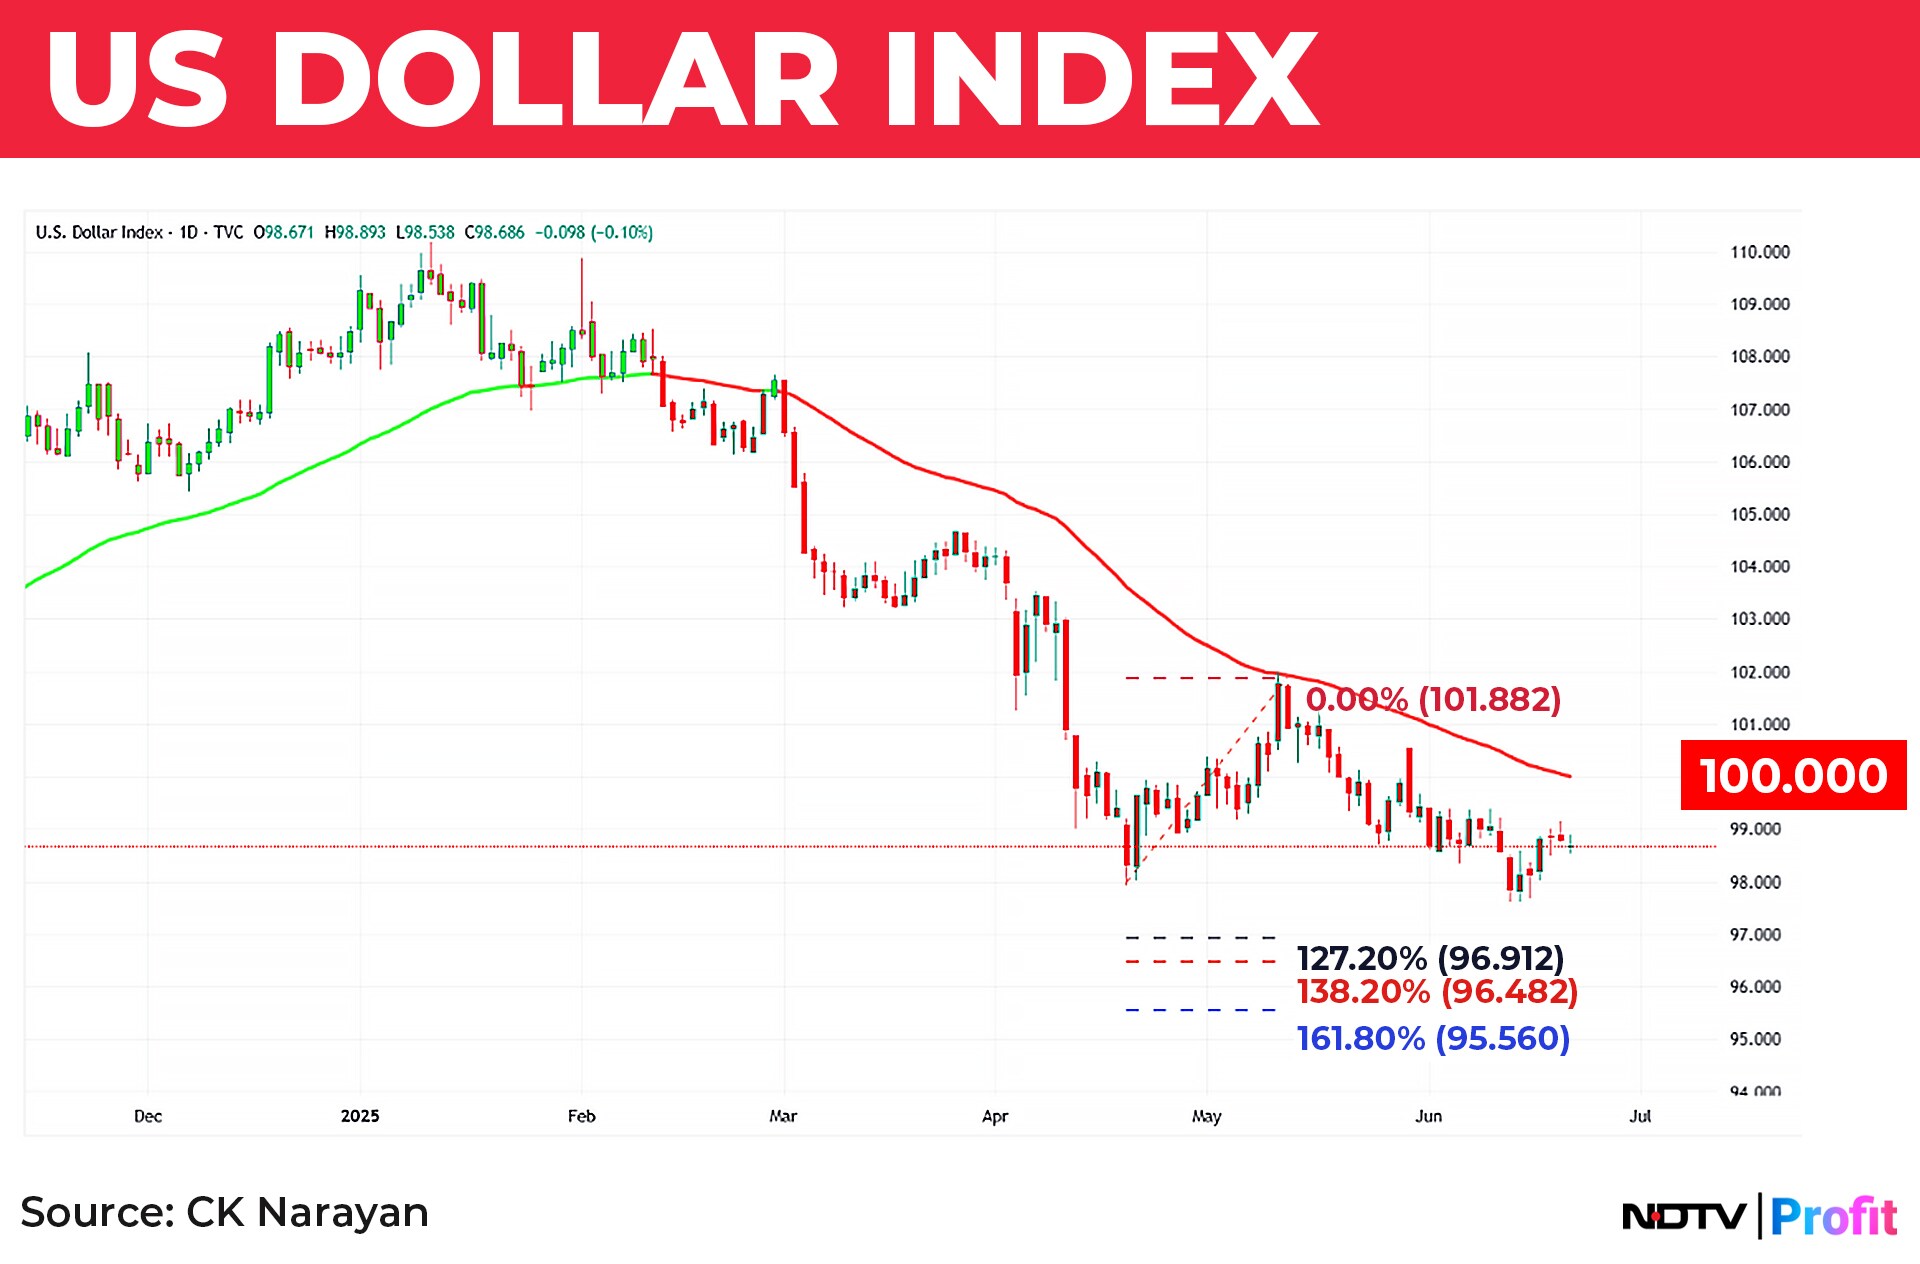
A weakening dollar can drive money out of the US, chasing yields and move towards emerging markets like India. A very big plus for us would be cheaper oil, especially if the rupee appreciates alongside. The downside is that our exporters take a bit of a hit to their margins. India's external debt is largely dollar denominated and a cheaper dollar will help service those obligations. For Trump, this is a fine line to tread. So, not to expect any collapse but maybe a slight slide.
So, for this weekend, we are left with quite a different set of considerations compared to the last week. While the equity market has made an attempt to right itself, it does need to do a bit more for us all to breathe easier. The Iran-Israel situation is delicately poised and could send Brent prices either way and that shall have a major impact on how prices and volatility move in the coming days. Dollar is slipping- and slowly- and that is a slight positive (overall) for us. Derivative data is flipping around faster than a weather cock in a storm.
Traders need to be on their toes to take advantage in markets like these. Day or 1-2 days trading preferred, largely. Not a time for swing and positional plays. Slide in mid and small cap indices warn of some new shifts therein - unless swiftly reversed. So one needs to be careful on the delivery trades too.
Disclaimer: The views and opinions expressed by the author are his own and not of NDTV Profit. NDTV Profit advises users to consult with their own financial or investment adviser before taking any investment decision.
Essential Business Intelligence, Continuous LIVE TV, Sharp Market Insights, Practical Personal Finance Advice and Latest Stories — On NDTV Profit.


