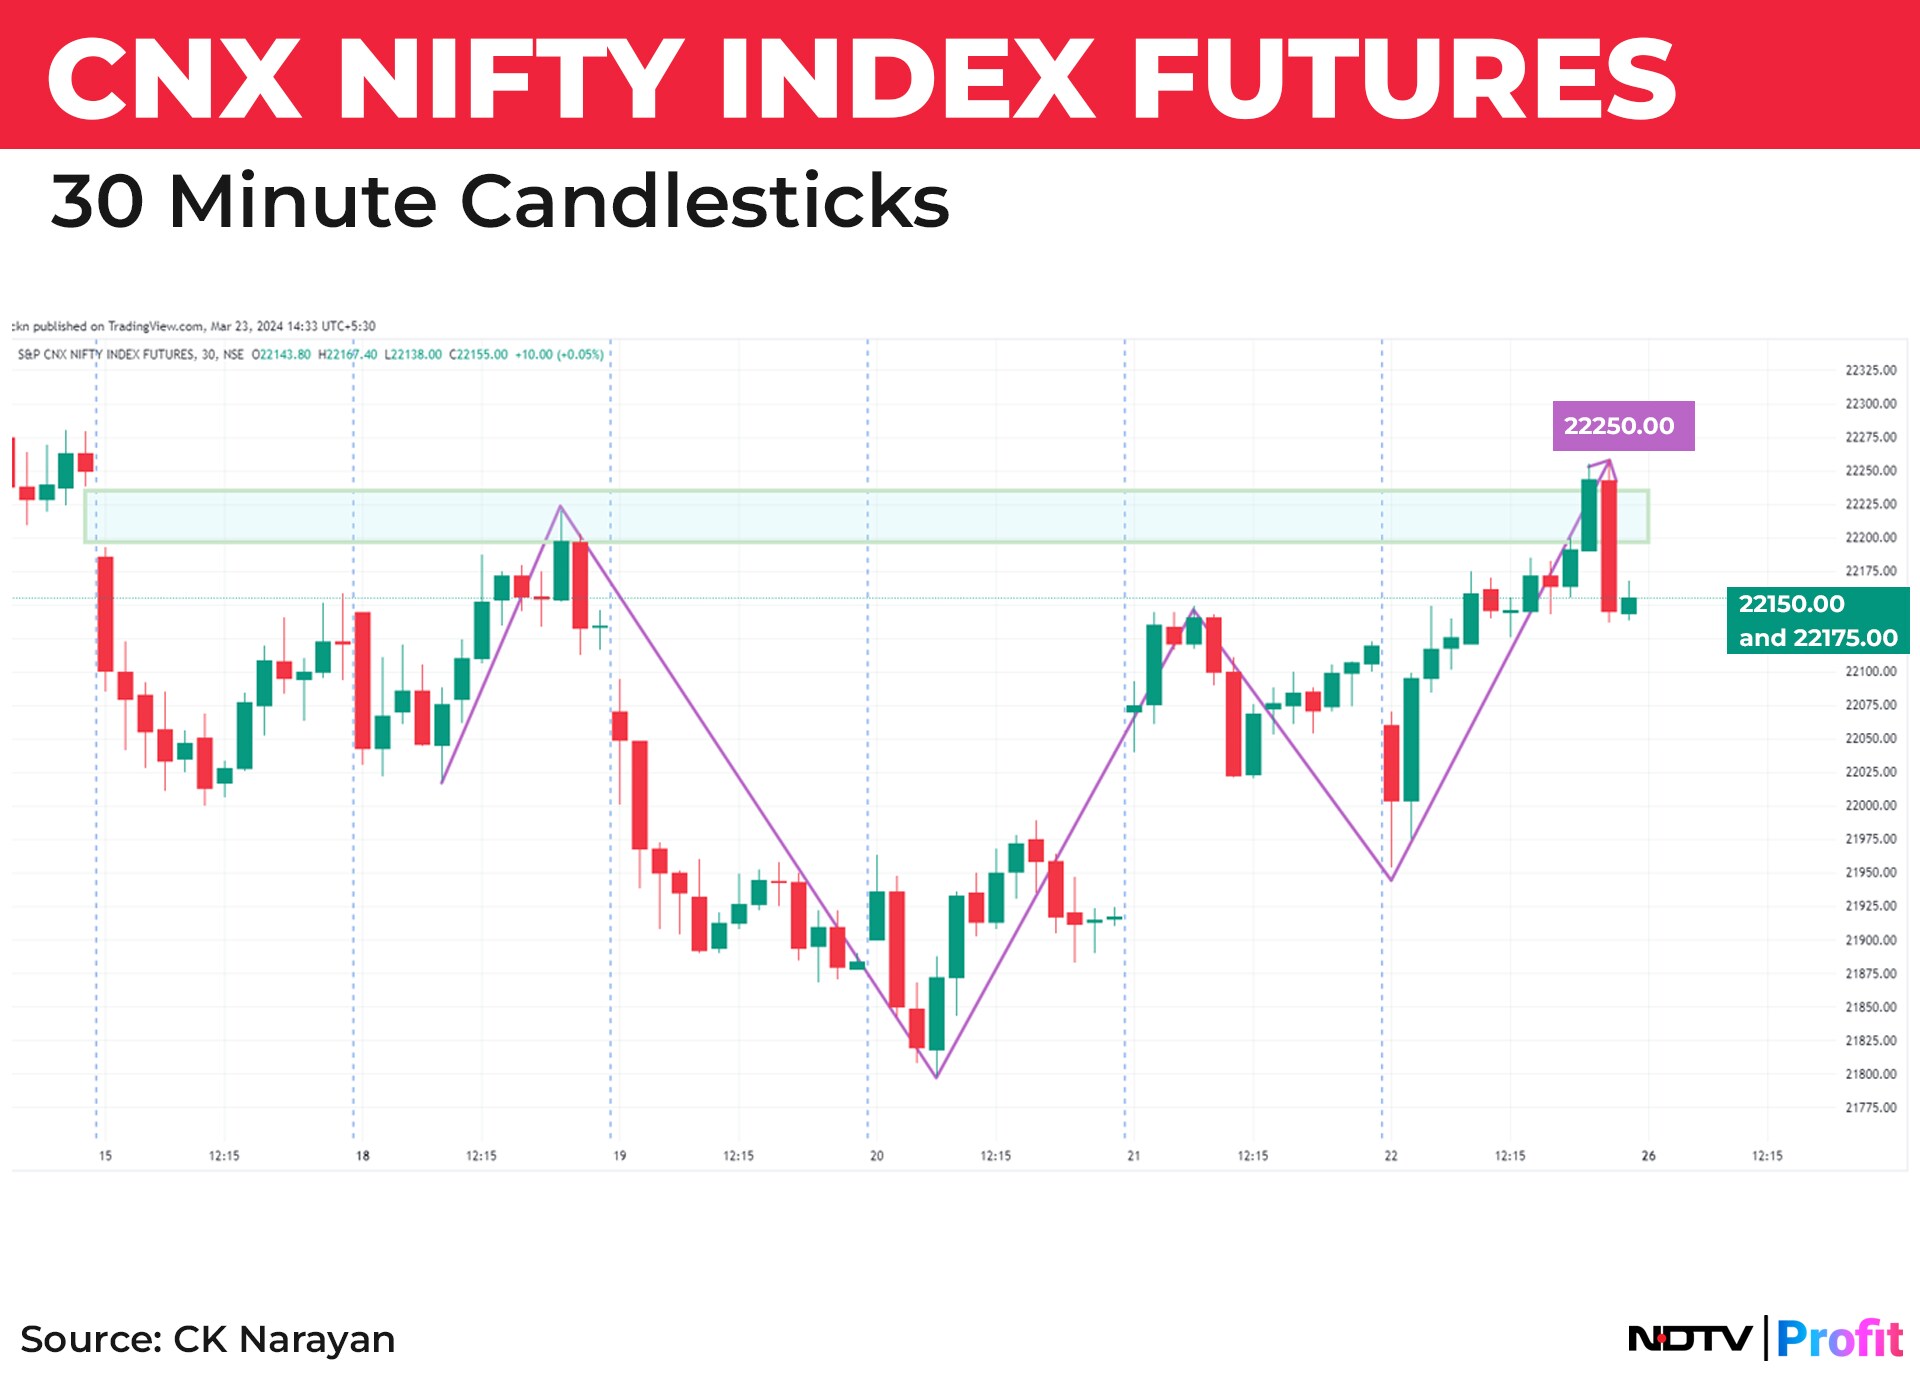
We had mentioned in our column last week, we had written, “….alerted to expect in a more difficult time for the trends ahead….may still be a buy on dip time….” We had also mentioned “…that the bulk of the selling appears to be done.” After starting the week on a negative note to breach important supports around 21,843, Nifty turned around smartly as anticipated. The intraday swing action seen in Chart 1 highlights last week's movement, indicating that Nifty is back to the same point from where it started the week. Thus, the ranging characteristic of the market continues. Given that the coming week has only three trading sessions, there is little to hope for big trends to emerge just yet.
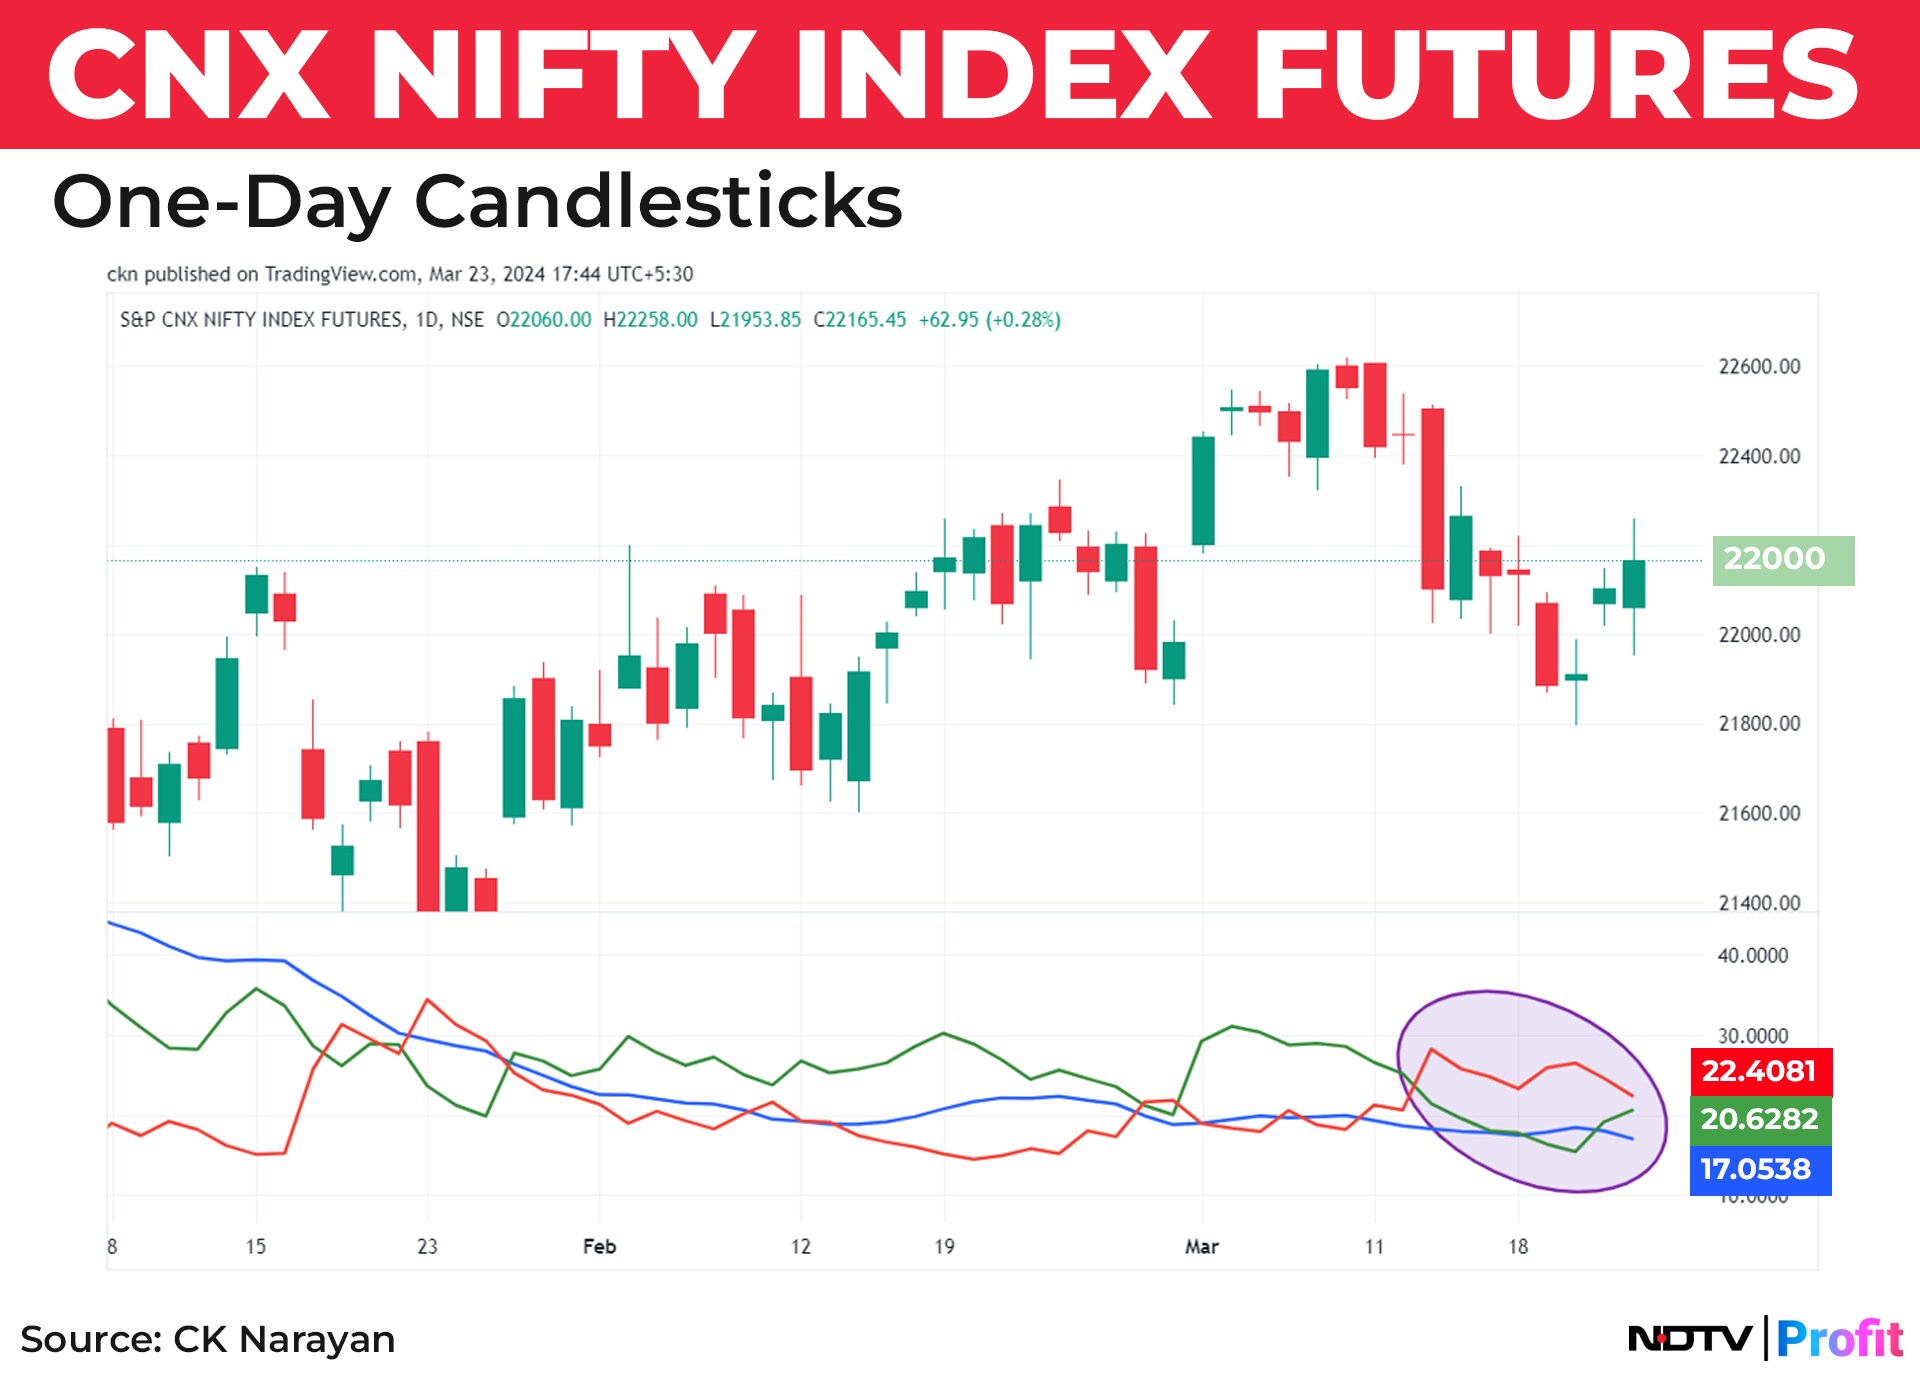
Moving to the Nifty Daily charts (Chart 2) that we have been featuring, the swing low of 21,843 was challenged last week. Despite the breach, Nifty did not sustain below these levels. The option data through the week were suggesting that there were some steady Call writing, which drifted lower towards the 22,000 strike. Short squeeze of these produced a rally in the latter part of the week, emerging out of our Trend Change Date of March 21.
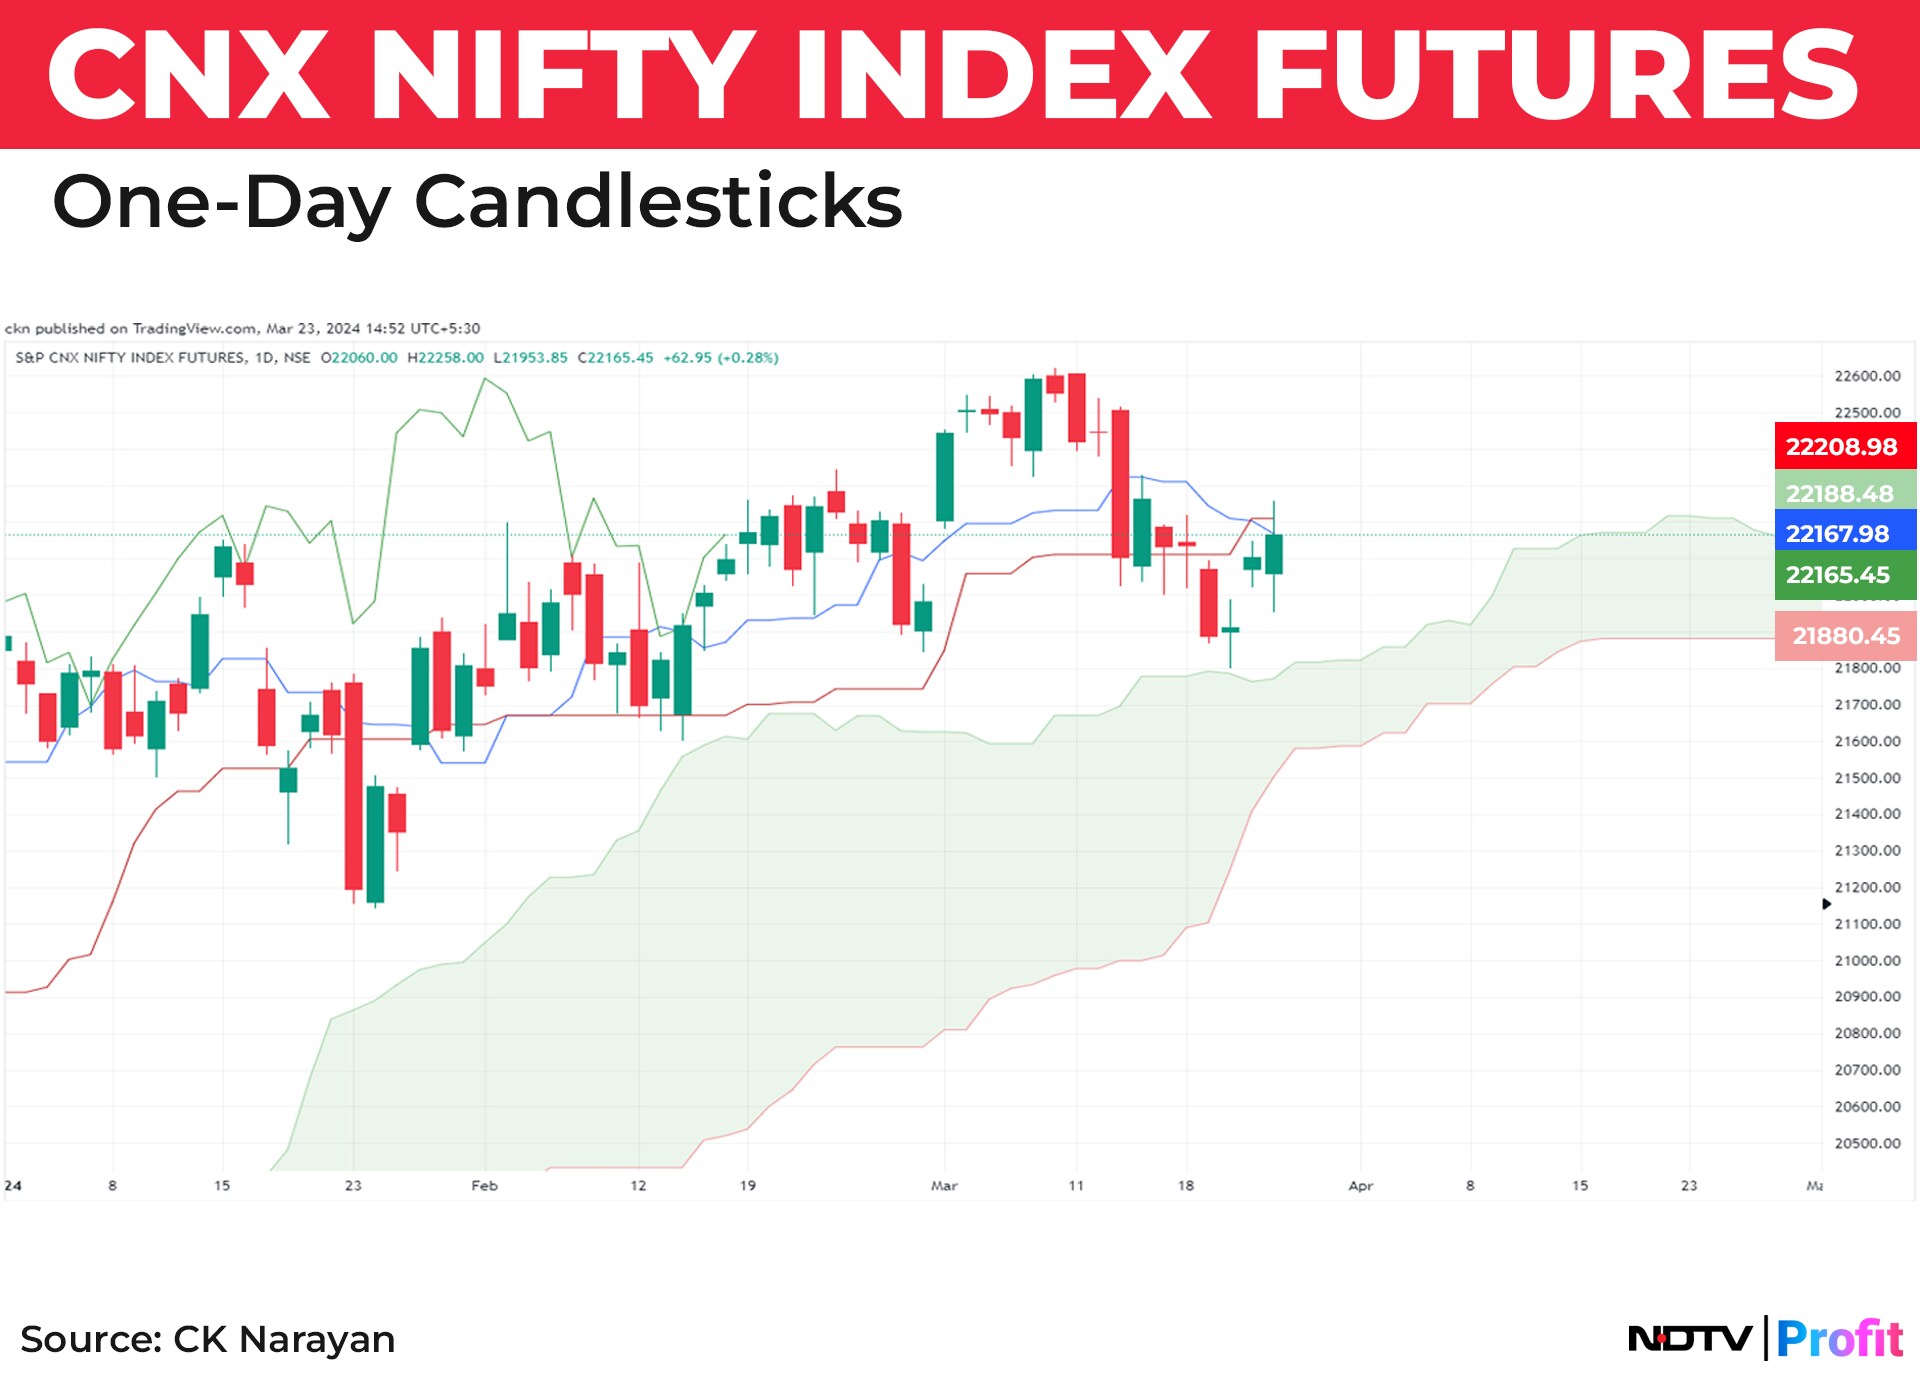
Some factors favouring the bullish bias is that the price continue to trade above the cloud, even as the Chikou Span is delicately placed. The weekly chart continues to remain largely undisturbed, with the dip seen during the week tapping into Weekly TS line and forming a Doji. Also, the other lines of Ichimoku firmly remaining in positive phase. Also, on the DMI chart we note that the bears have not been able to establish any dominance during the fall of the last week. See Chart 3.
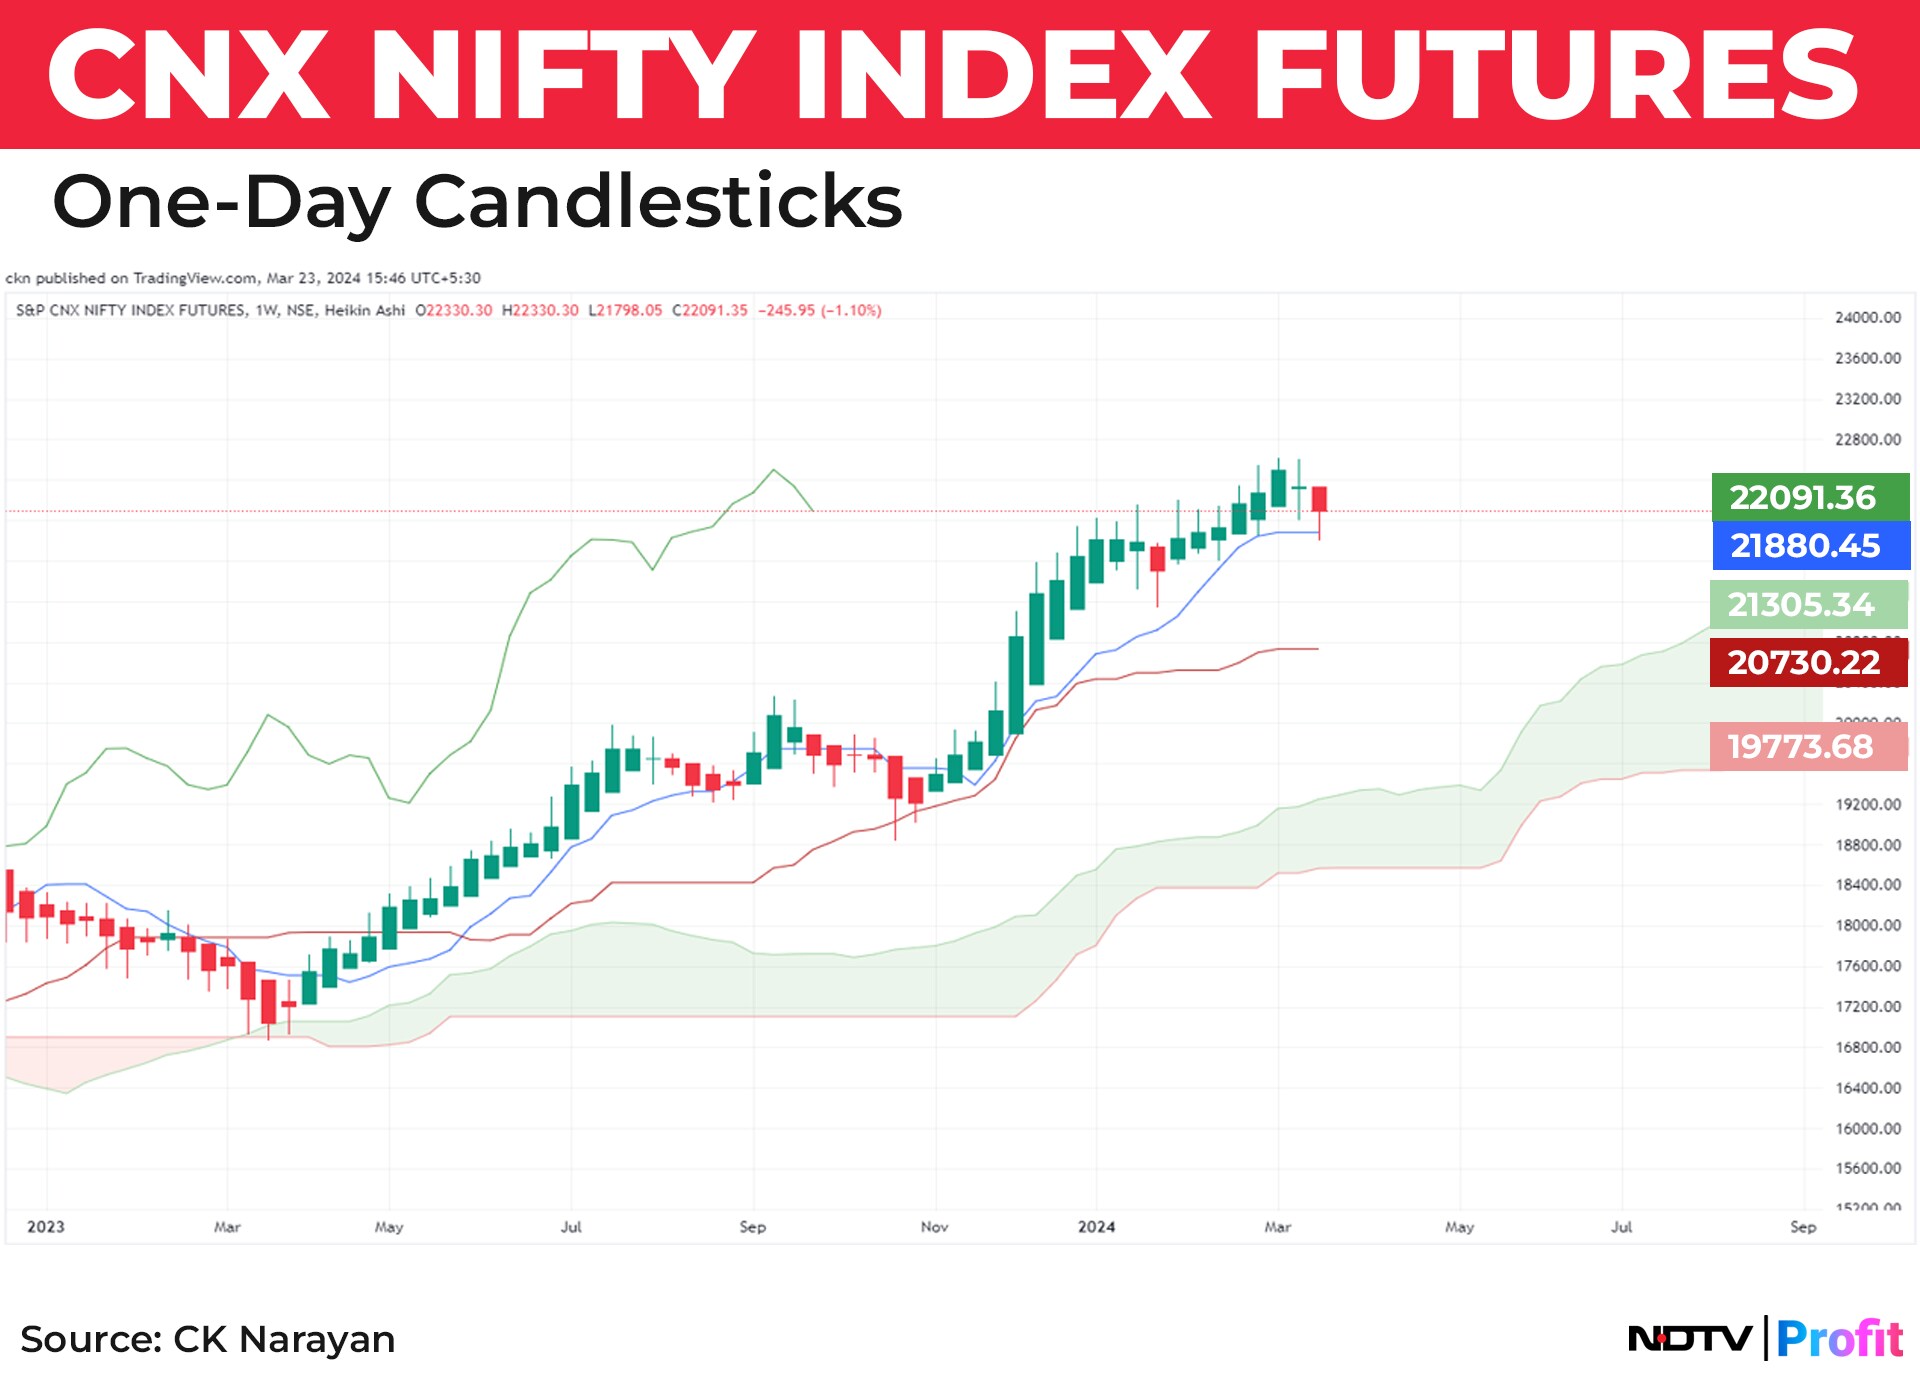
However, when we see Nifty as per Heikin Ashi (Chart 4), the charts are showing signatures of possible reversal that needs further follow-through price action to the downside for a confirmation. The bears may get into action if Nifty stages a breakdown below 21,800 in the coming week. In the event of such a break, the downside possibility extends to 20,730 (Weekly KS Line). The bearish overhang in Nifty was also highlighted from the CPR, as Nifty traded below the weekly CPR for the entire week and the decline ahead will repeat this signal in the coming week also.
However, the key levels to watch out for the coming week is around 21,730, which is 0.618 of last leg from end Jan. The breach of this level could be negative for the sentiment dragging Nifty towards 21,170. The next week with only three trading sessions suggests the possibility of dull ranging action, particularly in light of the fact that it is the financial year ending and traders and investors may be more concerned about balancing their books. One can, therefore, expect the volume to drop along with participation. With local triggers being absent, we may have to continue to look at overseas inputs for bigger price action to occur.
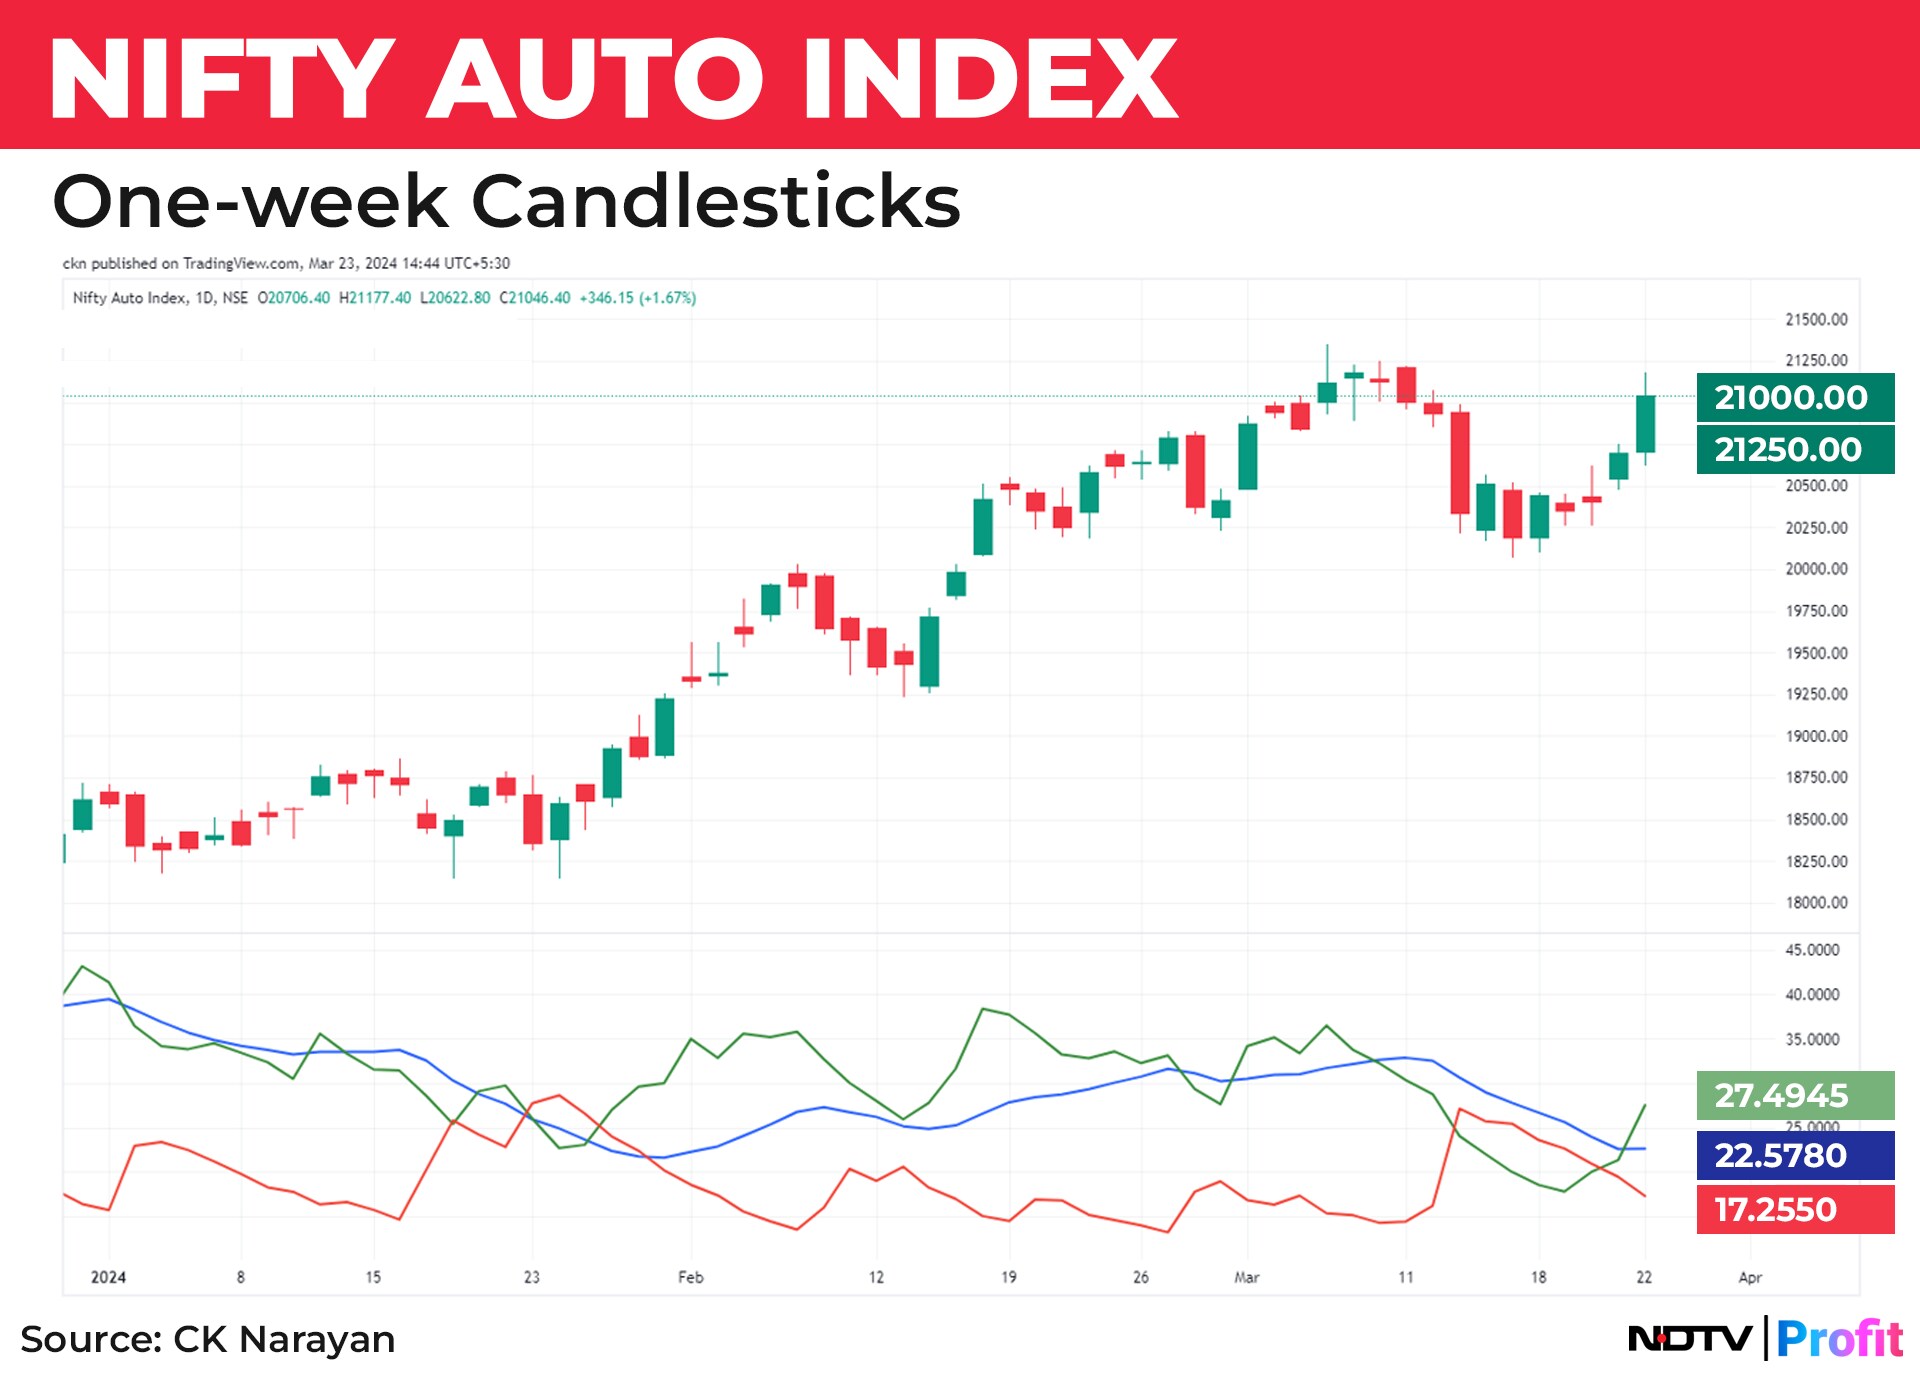
Amongst the sectors, the auto sector staged a comeback (Chart 5) and the strong show seen last week highlights that the possibility of some continuation in the week ahead. Strong moves in Maruti that flashed a new high, followed by Tata Motors, Baja Auto, revived the auto sector. With the auto numbers expected in a week, this could be a precursor to some positive vibes that can be expected in this sector in the coming sessions.
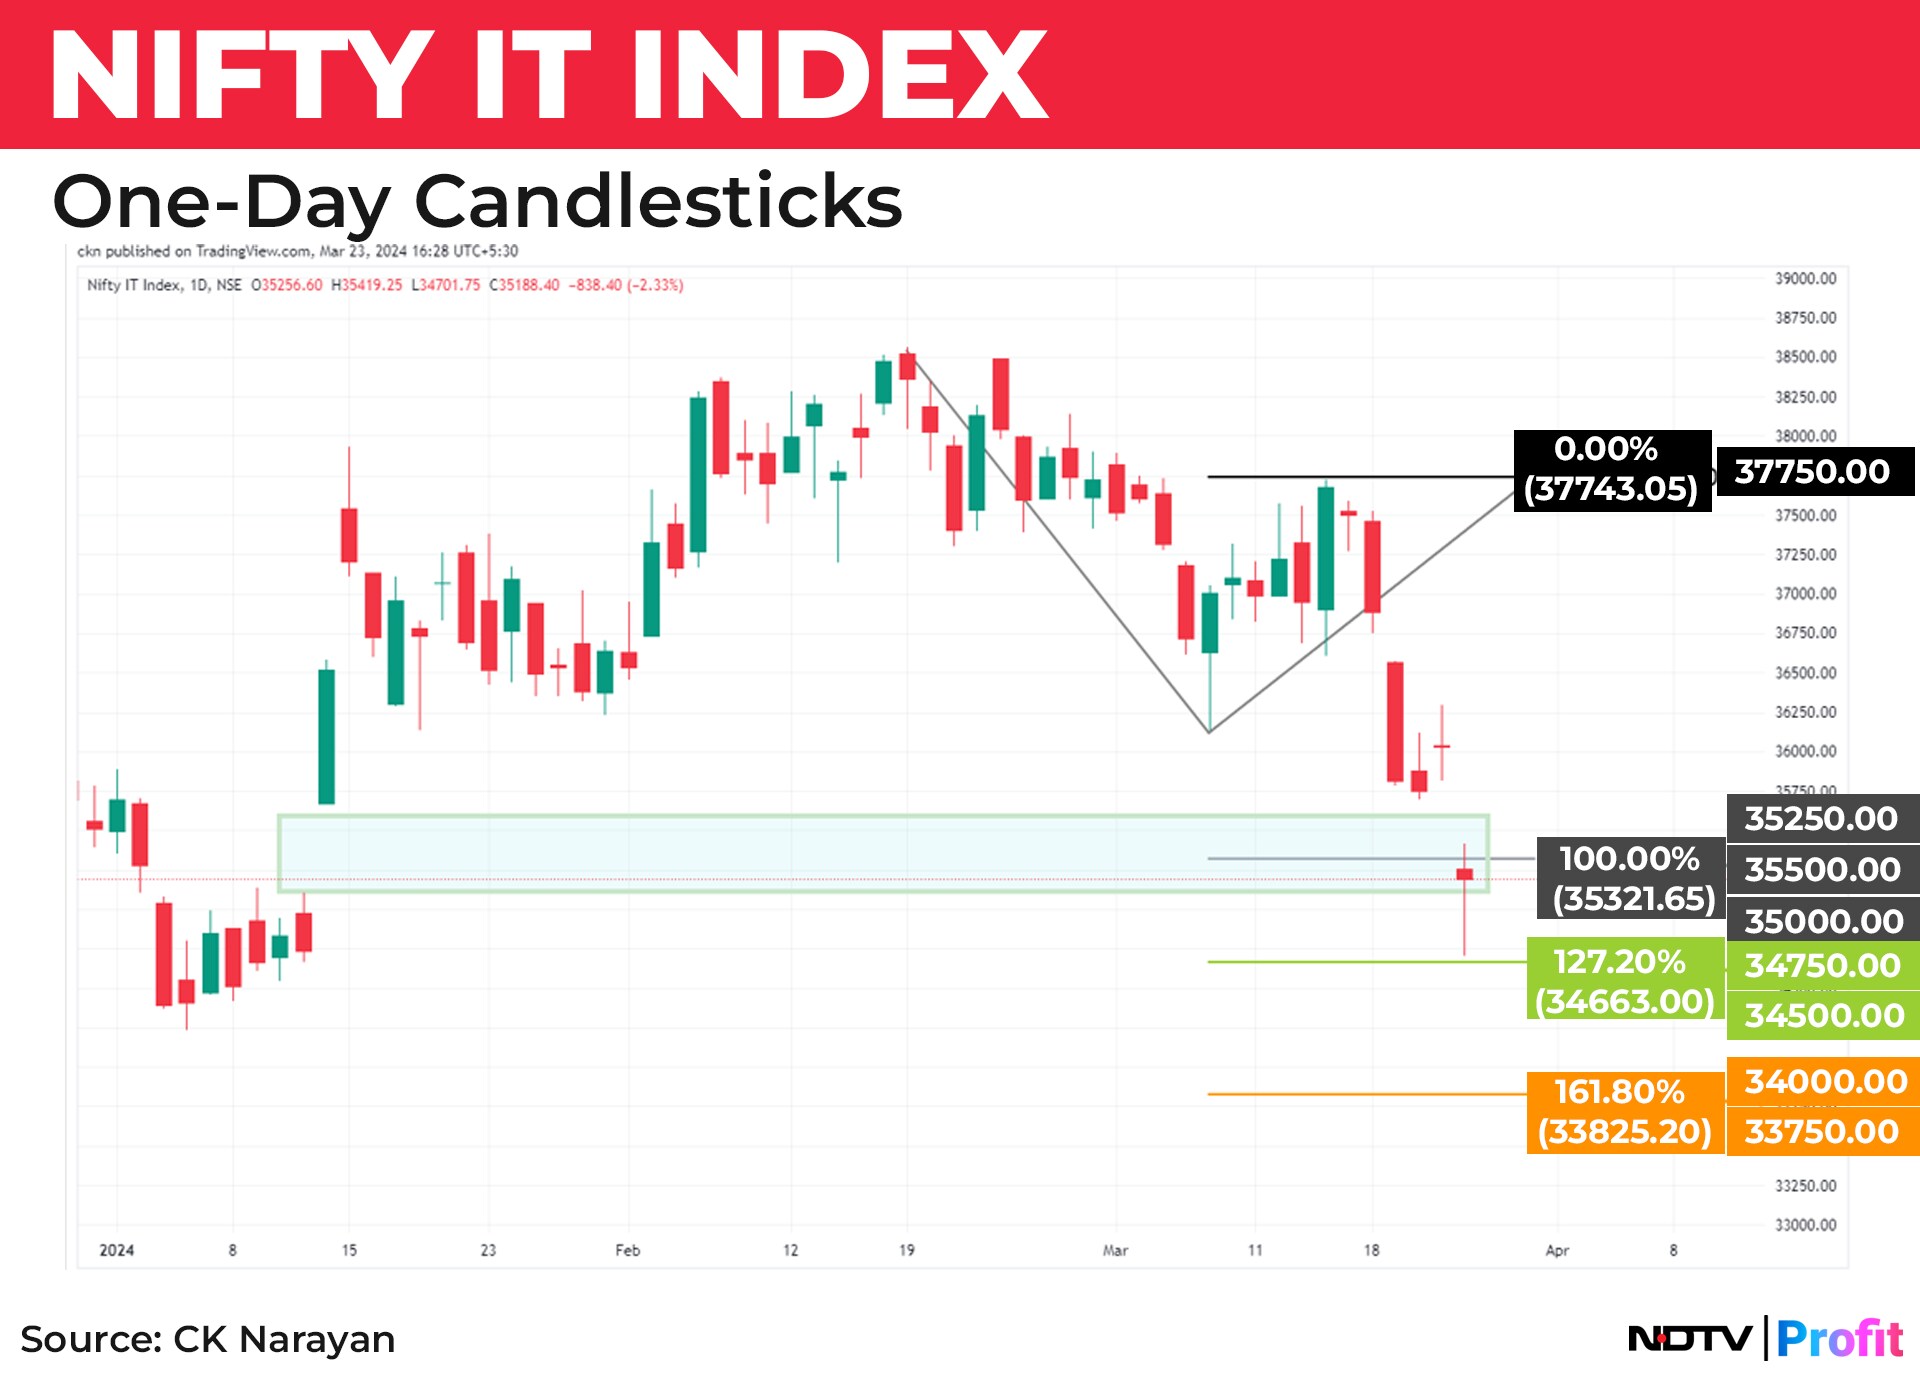
Meanwhile the IT Index (Chart 6) has been on a descent since February 2024 and the fall is expected to continue as the IT stocks came under pressure as Accenture Plc (has a considerable influence on IT sector across the world) cut its financial year 2024 revenue forecast, leading to lower hopes of a demand recovery. The brief rally that emerged in mid-March rallied to 61.8% of the decline witnessed some strong sell off that saw some gapped down moves. A trend extension suggests that if the bearishness persists, it opens up the possibility of a further 4-5% drop from current levels.
Currency market has a strong impact on the money flow of FIIs and the surprise move of last week has been the sharp weakening in USDINR as can be seen in (Chart 6). Historically, we have seen that weakness in the rupee is accompanied by weakness in equities. The impact of the gold hitting new highs, Bitcoin sustaining at higher level and record spree seen in US markets could all provide competing asset classes to wean away money from equities.

Wrapping up, we do not find any evidences of a bullish signature for traders in the week ahead. A truncated week, lack of local triggers, influence of March year ending, together with competing signals from other markets, may all combine to either keep the markets in a range, or perhaps even renew the downside bias. Given that the sentiment is still somewhat tenuous and that there is room for some decline until the next set of supports, it is better to be on the defensive for short term trades. Investors may also bide their time before seeking fresh entries into their preferred stocks.
Essential Business Intelligence, Continuous LIVE TV, Sharp Market Insights, Practical Personal Finance Advice and Latest Stories — On NDTV Profit.