


On Dec. 2, 2022, I had written an article titled ‘Bitcoin hits a bottom'. Citing several technical factors, I had presented a case for a bottom formation in Bitcoin (which had hit a low 15,479 on Nov. 21) and was building a small base thereafter. We had, at that low, a good match for price, pattern and momentum signals and therefore, the odds of creating a bottom there was quite high and was therefore called out. One is therefore quite happy to see that the subsequent move in the price of Bitcoin (as well as most other coins) has been a strong rally (up 46% from the low). So, we really nailed in that bottom in November 2022!
Clinching the issue was the sentiment nadir that was hit with the BTC decline hitting the covers of the Economist magazine issue of that week. It is a well-known fact among technical and behavioural analysts that magazine covers are very good contra indicators of sentiment. I first heard of this phenomenon back in 1999, when I attended a lecture of Tom Dorsey, a celebrated Point and Figure specialist at the TAG 2000 conference in the U.S.
Speaking at the lecture, Dorsey said that he once bought an issue of Playboy magazine as they had covered Wall Street moves in that issue. He was absolutely sure, he said, that the market had hit an extreme, because the Playboy mag is the last place that should be commenting on market trends. He also said that the vendor was surprised when he tore the cover page and dumped the magazine in a trash can without giving a further look at it.
This impressed me so much back then that I came back and researched this aspect more. During those times, there were some magazines devoted to the markets but if you went further back, to the 1980s for instance, you didn't really have any magazines dedicated to the market. But even so, there were hints of this magazine cover phenomenon. I continued to track it later, too, and found it to be quite reliable as a contra indicator.
Later, business TV has taken on the mantle of expression of the contra view but details of that phenomenon will be a subject matter for future articles perhaps. Hence, that issue of the Economist, completely nailed in the bottom and we have now seen a 46% rise from the November bottom. By any yardstick, that is a terrific return in the matter of two months.
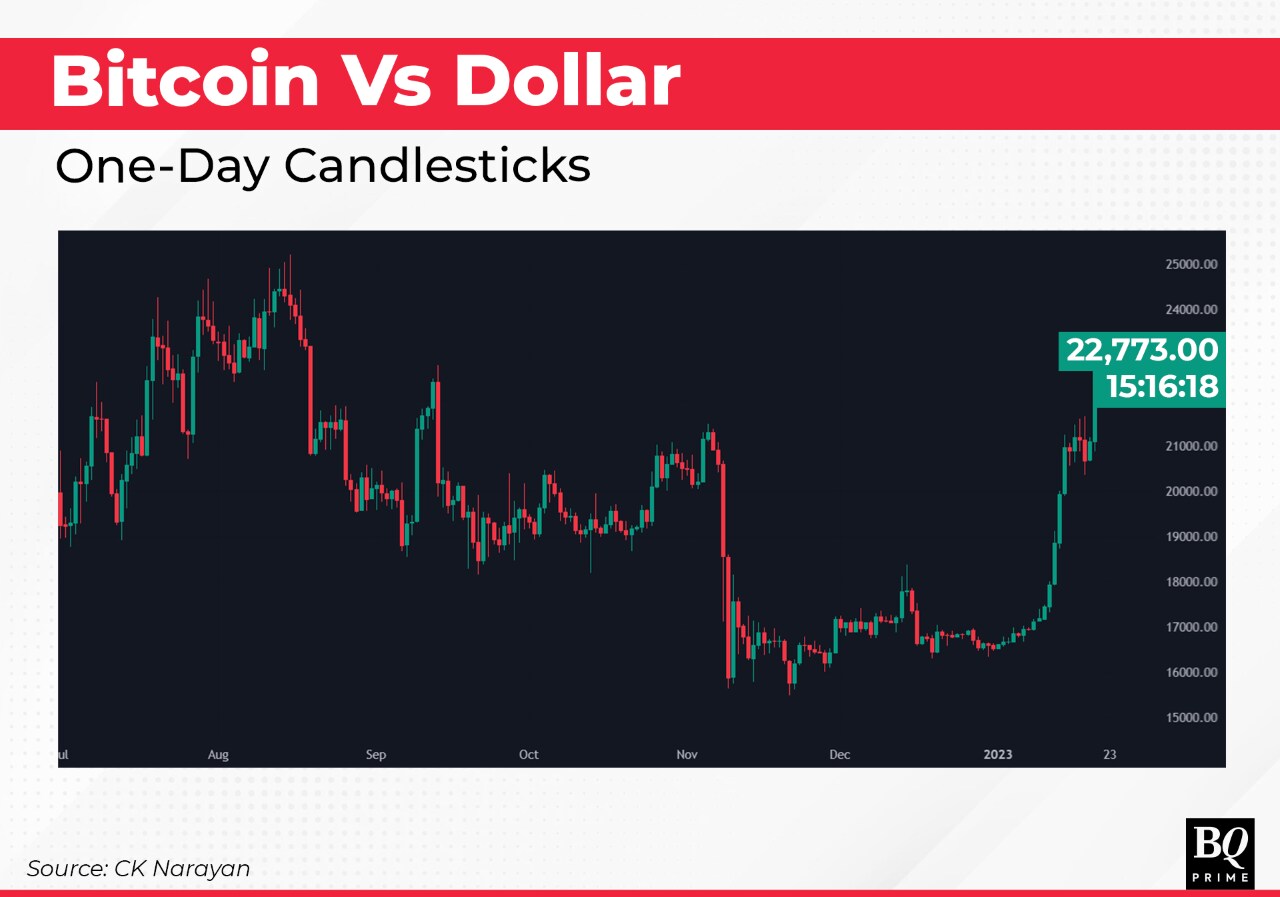
As can be seen in the chart, the prices spent a week or two completing the base building process and then just took off, rising near vertical to the current highs at 22,775 (Jan. 20, 2023). Ethereum was the other well-traded crypto that has a move that is nearly identical with that of BTC. Other crypto symbols have also followed suit, perhaps not as robustly as BTC or ETH.
When all the altcoins start rallying, there is a clear indication of short covering. And that is what has probably contributed in a good chunk to push the prices higher so briskly. The news in end-November, spilling into December was quite negative and hence, lot of shorts may have been present. The collapse of FTX led to the BTC shorts increasing to a two-year high level back in November. Therefore, it was inevitable that the shorts would scamper as soon as some concerted buying appeared.
While a 46% hike in prices, that, too, rapidly, might look like a big deal, let's place it in some context to see what may lie ahead. The next chart shows the weekly picture of BTC with Ichimoku indicator, which is my favourite way to look at the bigger picture.
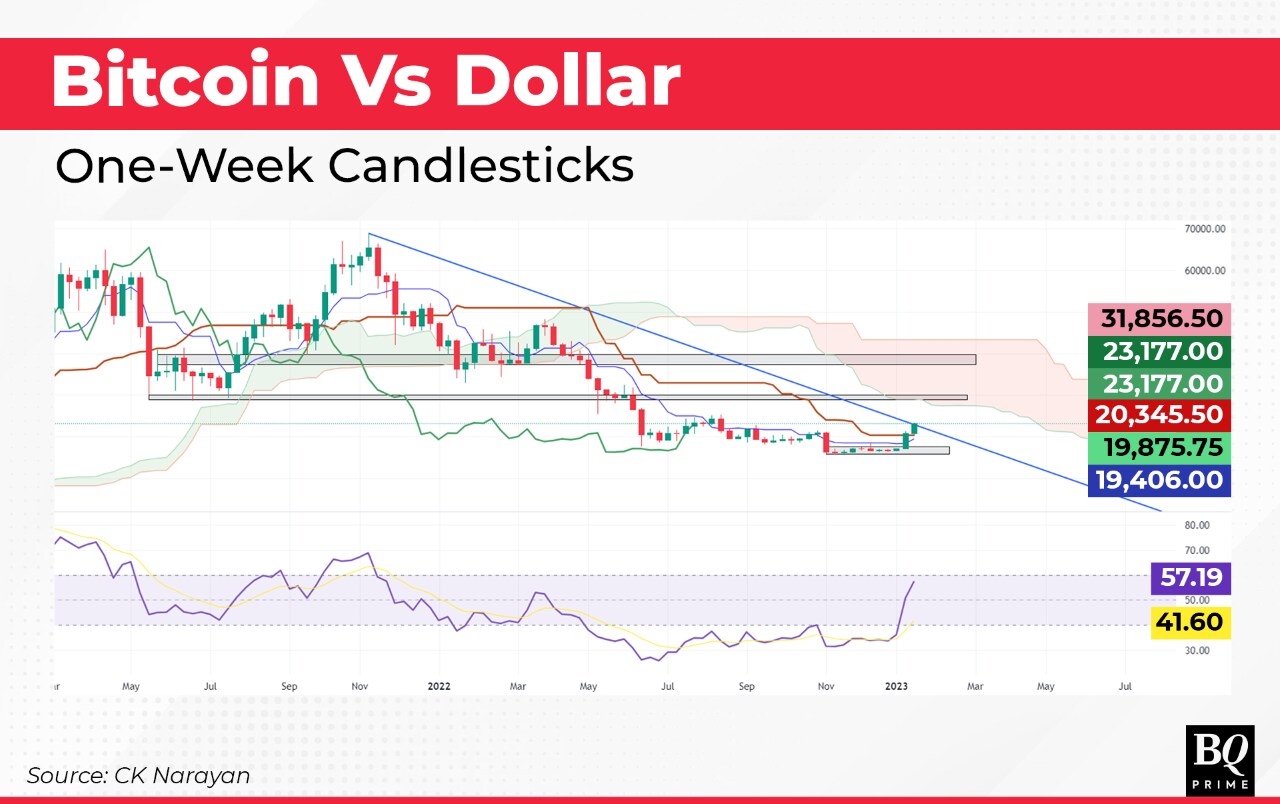
Right off, we can note that the rise is actually pretty meager in the context of the fall. We have just about managed to get past the two short-term lines of the Ichimoku (TS and KS lines), and so, that is just deemed stage one of the rise. Much to do before we can talk about bigger gains ahead. For starters, the move has to at least sustain to create a positive crossover of the TS over the KS line. This will be the first confirmation of bullish intent. The prices, if they continue higher, would probably find resistance at the Kumo that is present around 20% higher from where we are trading currently. That is the zone corresponding to some supply/demand zones created on the way down. So, the short-term target we are looking at would be in the zone of $27,300-28,300.
On the weekly chart shown here, we can note that the RSI indicator is headed higher and is supportive of price advances in the future. But if we look at the RSI on the daily chart, one finds it in deep overbought territory (86 levels) and this may hint at some short-term pullback or consolidations ahead. The fact that the CS line of Ichimoku is now entangled in the prices would suggest that we may see a couple of weeks of corrective move ahead. But the daily chart shows high trend strength and hence, any price damage in a correction may perhaps be limited to say around $20,500 area.
We need to be tracking that fall for evidence of completion because it will represent a buying opportunity in BTC ahead for targets mentioned earlier at near $28,000 area. It will also be very important to gauge how the prices handle that next resistance zone because a crossing of this zone can be quite bullish for the trends as the next zone of resistances lie a good distance away (around $39,000). Thus, we are looking at an overall bullish situation for the cryptos in the coming months!
On chart 2, I have also drawn a proprietary resistance trendline using Ichimoku methods and we note that the prices are on the verge of crossing this trendline. Doing so will push the trend status to up in the intermediate term.
This should not be misunderstood to mean that prices would continue at the same pace as seen so far. I have already mentioned about the possibility of some consolidation. Note on the charts that the Kumo is a rather thick one and it is going to take some time for prices to work up the kind of upside momentum required to breakout past the cloud. There has to be a great consistency to the news flow for that to happen in the near term. So, we need to caveat the above statement about bullish times by adding that while the trends may remain bullish, there may also be several phases of consolidations in the short term.
A question one could ask is, what if the support at 20,500 does not hold? Well, that is possible and we can then keep levels around $19,800 (current KS line level) as being the next target. If prices start reacting, then we would find the KS line may continue to advance, so the support zone of the KS line may be a rising one.
It is my firm belief that the lows recorded back in November 2021 ($16,800 area) is a very durable low and hence, unlikely to break across 2023. This encourages me to consider any decent dip in the crypto leader's prices during this year to offer multiple buying opportunities. As the matter stands today, Bitcoin should be one of the assets that I suggest should be traded actively through the year.
CK Narayan is an expert in technical analysis; founder of Growth Avenues, Chartadvise, and NeoTrader; and chief investment officer of Plus Delta Portfolios.
The views expressed here are those of the author, and do not necessarily represent the views of BQ Prime or its editorial team.
Essential Business Intelligence, Continuous LIVE TV, Sharp Market Insights, Practical Personal Finance Advice and Latest Stories — On NDTV Profit.


